
The ISP Column
A monthly column on all things Internet
|
|
|
|
|
|
|
Other Formats:
|
|
|
|
January 2011
Geoff Huston
It's January again, and being the start of another year, it's as good a time as any to look at the last 12 months and see what the Internet was up to in 2010. This is an update to the report prepared 12 months ago when looking at 2009, so lets see what has changed in the past 12 months in addressing the Internet, and look at how address allocation information can inform us of the changing nature of the network itself.
For many years the growth of the Internet has been inexorable. Around a decade ago the confident prediction was made that the annual doubling of the "size" of the Internet would be a constant, akin in some ways to the underlying optimism in technology that sits behind Moore's Law. That particular Internet bubble burst a decade ago, and the wildly optimistic predictions of the continued growth of the Internet were tempered somewhat. There was, however, the continuation of an underlying view that the Internet would just continue to grow and just when we thought that the world of humans represented a market space that would reach saturation sometime soon there was the "internet of Things" to keep us going for many decades to come. So, once again, by the late 2000's the Internet was portrayed as a form of economic miracle that would defy conventional cycles of business activity.
The global financial crash of late 2007 and its continuing repercussions have had a negative effect on the wildly optimistic assumptions of future growth. However, at least from the Internet's perspective this was not a major crash, and could at best be termed a "mild correction". The effects of this economic downturn have been short-lived in the Internet, and 2010 has seen the network expand at the highest rate seen so far. The market in mobile devices, fuelled in no small part by Apple's iPhone product, and the various competitive offerings that make use of the Google's Android platform have created an invigorated market in mobile Internet services that continue to drive growth across much of the world. In addition, the inexorable process of development in China in particular has now reached into the area of consumer electronics and communications services, and the process of deploying broad-based Internet connectivity into a country with a population of 1.3 billion has itself represented a large element of Internet growth in the past 12 months.
So lets see how the Internet fared in 2010.
Growth of the Internet
Using address allocations as the metric its possible to observe the impact of the global financial crisis on the expansion of the Internet, and the subsequent recovery. The deployment of new services often calls for an associated investment in infrastructure and related services, and the constraints on capital over the past couple of years has had its impacts in the rate of expansion of the Internet in 2009. However, this has proved to be a temporary condition, and 2010 saw a total level of address allocation that is the highest ever seen in the brief history of the Internet.
| 2005 | 2006 | 2007 | 2008 | 2009 | 2010 | |
| Allocated Addresses (IPv4, Millions) | 174.5 | 168.5 | 206.4 | 203.8 | 190.1 | 248.8 |
| Relative Growth | 8.0% | 7.7% | 8.8% | 8.0% | 6.9% | 8.4% |
Table 1 - IPv4 Allocated addresses
During 2010 the total number of IPv4 addresses allocated from the RIRs, supporting the growth of the Internet, was 31% higher than 2009, which represents a significant level of investment in new network infrastructure. In global terms the Internet continues to expand, but the number of new services has picked up in 2010. The long term (2005-2009) average rate of increase in growth is 7.8%, while 2010 saw an increase in the rate of Internet growth by 8.4%.
Which economies received these addresses? At a regional level its possible to compare the allocations made by each RIR.
| RIR IPv4 Allocation | 2005 | 2006 | 2007 | 2008 | 2009 | 2010 |
| APNIC | 31% | 31% | 34% | 44% | 46% | 48% |
| RipeNCC | 35% | 33% | 31% | 22% | 23% | 22% |
| ARIN | 27% | 28% | 26% | 28% | 22% | 18% |
| LACNIC | 6% | 7% | 7% | 6% | 6% | 6% |
| AfriNIC | 1% | 2% | 3% | 1% | 3% | 3% |
Table 2 - IPv4 Allocated addresses - Distribution by RIR
What is evident in these figures is the decline in the relative volume of IPv4 allocations in the region served by the RIPE NCC, and the strong growth in demand for IPv4 addresses in the Asia Pacific region. In 2010 almost half of all allocated IPv4 addresses were allocated to economies in the Asia Pacific region.
Which economies are leading this continued growth in IPv4 services?
| IPv4 Addresses (/32's Millions) | ||||||||
| Rank | 2007 | 2008 | 2009 | 2010 | ||||
| 1 | USA | 48.47 | USA | 53.79 | China | 50.67 | China | 45.20 |
| 2 | China | 37.29 | China | 46.49 | USA | 38.55 | USA | 452.32 |
| 3 | France | 13.38 | Japan | 10.06 | Japan | 11.04 | Rep. Korea | 25.73 |
| 4 | Germany | 11.22 | Rep. Korea | 7.96 | Rep. Korea | 10.95 | Japan | 10.02 |
| 5 | Rep. Korea | 7.73 | Germany | 7.29 | Russia | 5.46 | Australia | 9.63 |
| 6 | Japan | 7.14 | Brazil | 6.29 | Brazil | 4.19 | India | 9.43 |
| 7 | UK | 6.41 | Russia | 6.12 | UK | 4.19 | UK | 8.13 |
| 8 | India | 5.61 | Italy | 5.85 | Italy | 4.16 | Germany | 6.97 |
| 9 | Mexico | 5.24 | India | 4.23 | France | 3.85 | Russia | 6.46 |
| 10 | Italy | 5.09 | Taiwan | 4.18 | Germany | 3.60 | Brazil | 6.29 |
Table 3 - IPv4 Allocated addresses - Top 10 Economies
Within the Asia Pacific region China received 45 million IPv4 addresses in 2010, which represents 18% of the total IPv4 address allocations performed in 2010. This appears to point to the strong pace of internet expansion in both broadband and wireless services within China. However, the rate of growth in 2010 has fallen in China to a level that was lower than the previous two years.
Also of note is the doubling of the address allocations in the Republic of Korea, with some 26 million addresses allocated in Korea in 2010, which is more that double the address volume recorded in 2009 of 11 million addresses. A similar level of growth in demand was seen in Germany from 2009 to 2010.
Demand Drivers for Addresses
One of the more notable jumps in demand for addresses was seen in Australia in 2010. 9.63 million IP addresses were allocated into Australia in 2010, a significant jump from a total of 2.63 million addresses in 2009 and 3.05 million addresses in 2008. Australia has a population of 21.6 million and an estimated 17 million Internet users. The country is already well connected with wired services. So the obvious question is why does this country require an additional stock of IPv4 addresses in 2010 equal to some 44% of the population count? A similar question can be phrased relating to 42 million addresses allocated in the USA in 2010, and 25 million addresses allocated the Republic of Korea in 2010, a country with a total population of some 48 million people. The total address count for the Republic of Korea is now 103 million, or 2.26 addresses per capita.
The most logical reason probably sits in your pocket. The marketing of mobile internet services, headlined by technologies such as Apple's iPhone and Google's Android platforms, is now firmly in the phase of mainstream consumer marketing. Given that mobile services represent a higher potential average revenue per used over wired broadband services, the future direction of the mass market Internet will be determined by the architectural and technical choices taken by mobile services in the coming years, and the wireline broadband services will probably further diminish in value and relative importance to the overall direction of the Internet.
These new service markets appear to be complementing the existing wired Internet infrastructure, and are being lead by mobile internet services, headlined by technologies such as Apple's iPhone and Google's Android platforms. It appears that there were some 90 - 100 million mobile IP devices to be sold in 2010, representing a significant proportion of the Internet's service growth for the coming year. Given that mobile services represent a higher potential average revenue per used over wired broadband services, it may be the case that the future direction of the mass market Internet will be determined by the architectural and technical choices taken by mobile services in the coming years.
If some 100 million new mobile services were activated in 2010, what can we expect in 2011? Ever higher numbers, such as 150 million or 200 million? Or maybe not, because the other factor here is that of the looming scarcity of IPv4 addresses. I'll look at this topic in further detail a little later, but it is evident that this looming scarcity has itself been a driver for demand for addresses in 2010. 2011 will see the IANA run through its pool of IPv4 addresses, and its also probably that the first of the RIRs, APNIC, will exhaust its pool of IPv4 addresses in 2011. This has probably been a factor in motivating folk to bring forward service deployment plans into 2010 in order to do so while IPv4 addresses are still readily available.
Address Distribution
Another way to look at the address distribution is in terms of "skew". If the Internet is populated by a largely homogenous population then the distribution of address allocations would be relatively uniform, such that the group of largest allocations would not be vastly larger than the group of smallest allocations. One way to look at the level of skew is to use a cumulative distribution plot, comparing the number of allocations to the amount of address space, shown below.
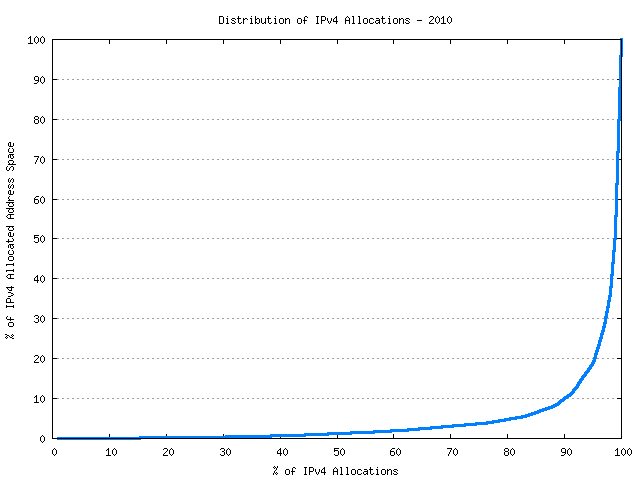
Figure 1 - IPv4 Allocation Distribution
What this distribution is showing is that of the 7,758 individual IPv4 allocations that were made in 2010, just 85 allocations accounted for 50% to the total amount of allocated address space, or 125 million IPv4 addresses. There were 1 of these large allocations made by AfriNIC in 2010, 6 by LACNIC, 15 by both the RIPE NCC and ARIN and 48 allocations by APNIC. Drilling down a little deeper on the largest allocations in this set, there was 1 allocation of 8.3 million addresses (/9), 3 allocations of 4.2 million addresses (/10), and 21 allocations of between 2 and 4 million addresses (/10 to /11). These 25 allocations in 2010 went to 18 distinct entities, as listed in Table 4. These 18 entities collectively accounted for 27% of the total address allocations in 2010.
| Rank | Economy | Organization | /32's (M) |
| 1 | USA | Comcast | 8.39 |
| 2 | Rep. Korea | Korea Telecom | 8.39 |
| 3 | Brazil | Network Information Centre, Brazil | 6.29 |
| 4 | USA | Sprint Nextel Corporation | 5.24 |
| 5 | China | China Mobile Communications Corporation | 4.19 |
| 6 | Mexico | Network Information Centre, Mexico | 4.19 |
| 7 | Australia | Telstra | 4.19 |
| 8 | Vietnam | Vietname Posts and Telecommunications | 4.19 |
| 9 | USA | Verizon Internet Services | 2.75 |
| 10 | UK | Orange | 2.10 |
| 11 | UK | T-Mobile | 2.10 |
| 12 | Uhina | China Telecom | 2.10 |
| 13 | USA | AT&T Internet Services | 2.10 |
| 14 | France | LDCOM Networks (SFR) | 2.10 |
| 15 | Rep. Korea | SK Telecom | 2.10 |
| 16 | Rep. Korea | SK Broadband | 2.10 |
| 17 | Tunisia | Agence Tunisienne Internet | 2.10 |
| 18 | China | China Unicom | 2.10 |
| Total | 66.72 |
Table 4 - IPv4 Allocated addresses - Top 18 allocations for 2010
This "heavy tail" distribution of the largest allocations has not always been the case. In looking at the distribution of IPv4 allocations over the past decade the following table shows the percentage of address space that were allocated to the 1% largest individual allocations and the lower half of the individual allocations.
| IPv4 Allocations | 2000 | 2001 | 2002 | 2003 | 2004 | 2005 | 2006 | 2007 | 2008 | 2009 | 2010 |
| Top 1% | 26% | 30% | 39% | 38% | 38% | 51% | 45% | 51% | 47% | 50% | 49% |
| Lower 50% | 7% | 5% | 5% | 4% | 3% | 1% | 2% | 1% | 1% | 1% | 1% |
Table 5 - IPv4 Allocated addresses
What appears to have happened across the period 2000 - 2005 was a marked phase of aggregation in this industry, where the economies of scale in a mass market for Internet services started to exercise significant influence over the deployment of services on the Internet. This picture has remained relatively consistent since 2005, and the largest 100 Internet enterprises across the world appear to undertake at least one half of the volume of deployment of new Internet services. To the extent that the internet on the 1990's was a poster child of a strongly competitive environment and highly diverse supply industry in the communications sector, the 2000's has seen the Internet progress into an environment which has strong components of economies of scale and marked homogeneity across the larger suppliers. A marketplace that is strongly influenced by a small number of larger enterprises is often not as agile in areas of technical and service innovation, and competitive pressures are not as strong a factor when one or two providers assume a dominant market position.
The distribution of addresses in the IPv4 Internet tends to paint a picture of an industry that has now completed a process of aggregation, and the pressures that will lead to further evolution of the Internet in the coming years will probably be different to those that drove the Internet of some years ago.
IPv4 Address Exhaustion
The Internet continues to rely very heavily, if not exclusively, on IPv4, and the consumption of a further 249 million addresses in 2010 leaves a pool of some 33 million address in the central IANA pool for further normal allocation. Assuming a continuation of the current allocation rates of an average of some 676,000 addresses per day, and allowing for a slight upward movement in that average rate over time, then IANA will allocate its last IPv4 address block in late January 2011, and the first RIR to exhaust its entire pool of unallocated IPv4 addresses, APNIC, is projected to occur in mid 2011. The RIPE NCC and ARIN are currently projected to exhaust their available supplies of IPv4 addresses in 2012.
News of impending exhaustion of addresses would conventionally motivate some form of a last minute rush for addresses. Somewhat surprisingly, this was not evident in 2009, and it could be said that the industry was acting in a somewhat calm and considered manner in terms of total address demands being placed on the dwindling pool of remaining IPv4 addresses. However, perhaps reassuringly, or perhaps not, the strong upswing of demand for IPv4 addresses in 2010 confirms a more typical reaction to impending scarcity of a resource through accelerated consumption. In the last full year of conventional address allocations, more addresses were assigned and allocated in 2010 than any year in the past, and the 2010 address allocation figures provide some evidence of a last chance rush on available stocks of addresses appears to have commenced in the last quarter of 2009 and continued throughout 2010, with address allocations rates higher than the most recent 3 year average rate in all five RIRs. This was most pronounced in the Asia Pacific region.
It is perhaps appropriate at this juncture to anticipate what is proposed as the 'solution' to the exhaustion of available stocks of IPv4 addresses, namely IPv6. Lets now look at the allocations of IPv6 addresses over 2010.
IPv6 uses a somewhat different address allocation methodology than IPv4, and it is a matter of choice for a service provider as to how large an IPv6 address prefix is assigned to each customer. The original recommendations published by the IAB and IESG in 20012 (RFC3177) envisaged the general use of a /48 as an end site prefix. Subsequent consideration saw a more flexible approach being taken with the choice of the end site prefix size being left to the service provider, and today's IPv6 environment has some providers using a /60 end site allocation unit, some use a /56, and other providers use a /48. This variation makes a comparison of the count of allocated IPv6 addresses somewhat misleading, as an ISP using /48's for end sites will require 256 times more address space to accommodate the same customer base as a provider who uses a /56 end site prefix, and 65,000 times more address space than an ISP using a /60 end site allocation.
In order to illustrate the relative levels of IPv6 activity, we need to allow for a comparison using directly comparable units. To do this, we'll use the number of allocations of IPv6 address blocks are the basis of the comparative statistics.
In the period 2009 to 2010 the number of individual allocations of IPv4 address space, as distinct from the number of allocated addresses, rose by 16% from some 6,701 individual allocations in 2009 to 7,758 in 2010. In comparison the number of IPv6 allocations rose by 92%, from 1281 in 2009 to some 2,461 in 2010. While the number of Ipv6 address allocations did not exceed the number of IPv4 allocations in 2010, its probable that we will see a crossover of these numbers in the coming year.
| Allocations | 2005 | 2006 | 2007 | 2008 | 2009 | 2010 |
| IPv6 | 245 | 243 | 492 | 886 | 1281 | 2461 |
| IPv4 | 4774 | 5646 | 6312 | 6969 | 6701 | 7758 |
Table 6 - Number of individual Address Allocations, 2005 - 2010
The level of address allocation activity in IPv6 was most evident in 2010 in the more mature internet markets of Europe, North America and Asia, showing that where there is a mature IP infrastructure in an economy, the local industry has turned its attention to the infrastructure deployment of IPv6 in 2010. This is visible in the level of IPv6 allocation activity in each RIR (Table 7), and also visible in the per-economy IPv6 allocation activity (Table 8).
| IPv6 Allocations | 2005 | 2006 | 2007 | 2008 | 2009 | 2010 |
| RipeNCC | 98 | 94 | 164 | 439 | 642 | 1048 |
| ARIN | 59 | 71 | 218 | 235 | 396 | 638 |
| APNIC | 54 | 43 | 63 | 163 | 194 | 670 |
| LACNIC | 31 | 16 | 27 | 31 | 35 | 50 |
| AfriNIC | 3 | 19 | 20 | 18 | 14 | 55 |
Table 7 - IPv6 allocations by RIR
| IPv6 Allocations by Economy 2007 - 2010 | ||||||||
| Rank | 2007 | 2008 | 2009 | 2010 | ||||
| 1 | USA | 197 | USA | 218 | USA | 366 | USA | 847 |
| 2 | UK | 29 | Germany | 70 | Germany | 90 | Australia | 166 |
| 3 | Germany | 27 | UK | 36 | UK | 67 | Germany | 146 |
| 4 | Canada | 20 | Netherlands | 35 | Netherlands | 60 | UK | 124 |
| 5 | Russia | 11 | Russia | 33 | Australia | 52 | Russia | 108 |
| 6 | South Africa | 10 | Switzerland | 33 | Russia | 48 | Netherlands | 103 |
| 7 | Netherlands | 10 | Australia | 28 | Japan | 32 | China | 90 |
| 8 | France | 8 | Japan | 28 | France | 30 | Canada | 79 |
| 9 | Australia | 8 | Italy | 22 | Czech Republic | 30 | Indonesia | 79 |
| 10 | Japan | 7 | Vietnam | 22 | Sweden | 28 | Japan | 77 |
Table 8 - IPv6 allocations by Economy
Table 9 shows the amount of IPv6 address space assigned on a per economy basis for the past 4 years (using units of millions of /48s). Japanese ISPs predominately use a /48 Ipv6 prefix as their end site allocation unit, which may explain to some extent the relatively large number of IPv6 addresses allocations in Japan in 2010. Also the address allocation policies play a role here, where an ISP is generally able to request an amount of address space commensurate with its existing IPv4 address holdings in a single transaction, rather than perform the same incremental iteration of address allocations that generally occurs with IPv4. . However, the figures in Table 90 reveal that there is now a significant increase in the level of activity in IPv6, with the 2010 address allocation numbers showing an average three-fold increase over 2009 levels.
| IPv6 addresses (/48's Millions) | ||||||||
| Rank | 2007 | 2008 | 2009 | 2010 | ||||
| 1 | Australia | 268.89 | Brazil | 4307.55 | USA | 15.28 | Japan | 165.35 |
| 2 | UK | 68.75 | USA | 948.83 | Germany | 9.44 | Germany | 39.45 |
| 3 | Japan | 67.44 | Sweden | 9.37 | UK | 4.06 | USA | 34.94 |
| 4 | USA | 8.19 | France | 5.37 | Netherlands | 3.01 | China | 22.28 |
| 5 | Germany | 5.77 | Germany | 4.52 | Australia | 2.88 | Belgium | 17.69 |
| 6 | Taiwan | 4.26 | UK | 2.36 | Russia | 2.88 | France | 11.86 |
| 7 | Poland | 1.18 | Netherlands | 2.23 | Japan | 2.22 | Australia | 6.62 |
| 8 | Uruguay | 1.05 | Russia | 2.16 | France | 1.64 | Sweden | 6.29 |
| 9 | Canada | 0.85 | Switzerland | 2.16 | Czech Republic | 1.44 | UK | 6.23 |
| 10 | Russia | 0.72 | China | 1.70 | Sweden | 1.44 | Russia | 6.23 |
Table 9 - IPv6 address allocations by Economy
The Outlook for the Internet
The past three years has shown that the Internet is now an integral part of the portfolio of conventional business activity across the world, and the deployment of internet services and the opening up of markets through deployment of Internet services is subject to the same economic opportunities and constraints as any other business activity. Those economies that were adversely impacted by the global financial situation saw a drop in the expansion of new Internet services and a drop in their demands for IP address allocations across 2009, while other economies that managed to avoid the worst impacts of a financial recession continued to see growth in new Internet markets across the year.
2010 saw a year that has been dominated by the mass marketing of mobile internet services, and the growth rates for 2010 have been the highest so far recorded. However it will not be possible to sustain this growth using IPv4. As the Internet expands in the coming years we should expect to see the transition to IPv6 take a prominent role. As the IPv4 address pool dwindles in 2011 we will see the growth trends change once more, and the transition to an IPv6 Internet will not be seamless.
At the same time we are witnessing an industry that is no longer using technical innovation, openness and diversification as its primary means of propulsion. Today's internet is serviced by a far smaller number of very large players, each of whom appear to be assuming a very strong position within their respective markets. The drivers for such larger players tend towards risk aversion, conservatism and increased levels of control across their scope of operation.
This changing makeup of the Internet industry also has quite profound implications in terms of network neutrality, the separation of functions of carriage and service provision, investment profiles and expectations of risk and returns on infrastructure investments, and on the openness of the Internet itself. 2011 promises to be a very interesting year as the stocks of IPv4 addresses are exhausted

Disclaimer
The above views do not necessarily represent the views of the Asia Pacific Network Information Centre.
About the Author
GEOFF HUSTON is the Chief Scientist at APNIC, the Regional Internet Registry serving the Asia Pacific region.