
The ISP Column
A monthly column on all things Internet
|
|
|
|
|
|
|
Other Formats:


|
|
|
|
February 2004
Geoff Huston
The question being posed is to ask just how effective are IP address allocation policies?
Scoping the Question
There are many factors that need to be examined to answer such a question, in technical, economic and social dimensions. This is of course a very broad brush, and here the approach has been from a technical perspective. The factor chosen in the presentation is to understand how well the address allocation policies match deployment considerations within the network.
One way to look at this question is to look at the differences between allocations and routing advertisements. If the allocated address blocks are too large for the network deployments, we'd expect to see these allocated blocks being broken up into smaller announcements. Its also possible that we would see some of the allocated address space not being advertised immediately, where the large address block would be broken into smaller segments and announced in a piecemeal fashion as advertised route objects.
In this study the record of address allocations, as published by APNIC and the other Regional Internet Registries, is compared to the address entries contained in a dump of the Internet's inter-domain routing table.
What we see
There is certainly ample evidence that there is a lot of more specific address fragments being announced into the inter-domain routing system. Since January 2003 there were a total of 4364 allocations made by the RIRs, and so far we've seen 3,457 of these allocations being advertised on the Internet. There are 907 allocations we've not seen advertised as yet, which is not too surprising, as there's normally a delay between a network operator receiving an address allocation and the first address announcement to the Internet. Perhaps, more surprisingly, the remaining 3,457 allocations which were announced to the Internet were announced using 10,874 routing entries. That's an average of 3.1 routing entries for each allocation.
Does that mean that we are allocating addresses in blocks that are perhaps too large a unit? A more detailed examination reveals that of these 3,457 allocations, two thirds of them, or 2,776 allocations were advertised precisely as per the address allocation. The other one third of the allocations generated 8,027 routing advertisements, or a ratio of 6.9 advertisements per address allocation. So it would appear that in most cases the allocation matches the demands of the network, but in one third of the cases we see some fragmentation of the allocation into smaller routing units.
In the majority of cases of fragmentation, the allocation was a "/20" (or 4096 addresses), and this allocation was broken down into a number of /24 advertisements (or 256 address).
That's one data point, but it leads to a second question, namely is this level of fragmentation getting better or worse when compared to older allocations. To answer this second question we need to look at the entire collection of RIR address allocations, and compare them to the routing table, and do so as a time series, looking at the data of the original allocation. If things were improving we'd see the fragmentation rates getting "better" over time, while if the mismatch between allocation units and network deployment was getting worse we'd see the fragmentation levels getting higher.
One way to display this data is to plot the number of advertised fragments as a ratio of the number of allocations on a month-by-month basis. This is shown in the presentation. Here a value of 0 is a period where no allocations are fragmented, and the higher the value the greater the degree of fragmentation of the original allocation.
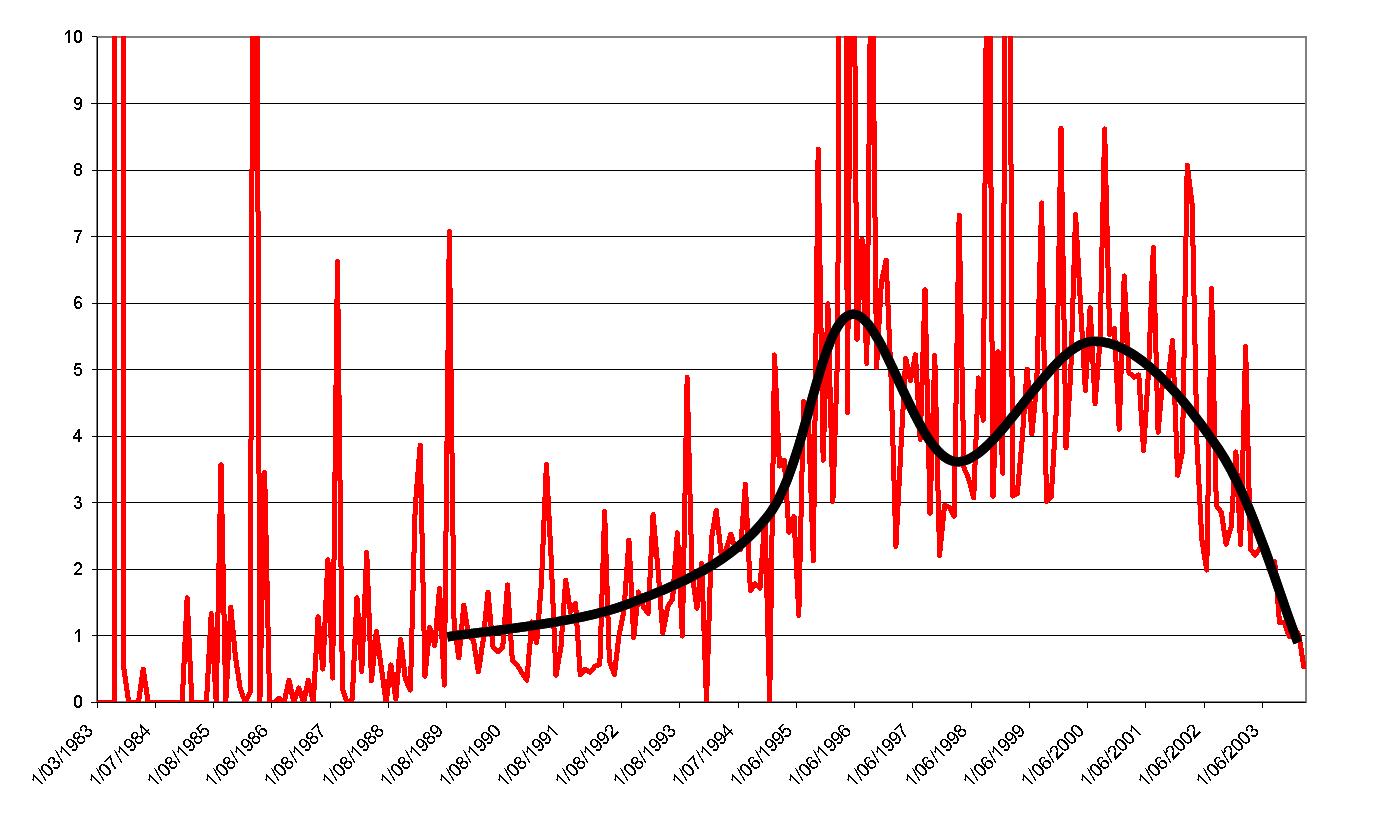
Time Series of the Ratio of Fragmentary Advertisements to Registry Allocations
The good news is that the number is declining over the past fours years, and we are seeing an increasing match between allocation and advertisements. So we can provide an indication that the RIR allocation function is getting better in terms of matching the allocation unit to the network deployment requirements. There are, relatively, fewer allocations that 'overshoot' the network deployment requirements. Obviously this is an encouraging observation.
Some Observations
Interestingly, there are two 'peaks' in this figure. The first occurred in late 1995, and the second in mid-2000. It may also be possible to make some guesses as to what is happening here. In 1995 there were still allocations being undertaken using the old class-full address structure, but the inter-domain routing system was, by then, fully capable of supporting classless address objects. This peak appears to be largely the outcome of what was the Class B "problem". Class B networks, or /16 address blocks were evidently larger than the network's general requirements, and these larger blocks were divided into small blocks which were then advertised. So the first peak appears to be evidence of a mismatch of allocation policies to network deployments in 1995. The second peak appears to match the cycle of the Internet boom and bust. By 2000 the number of individual ISPs was probably at a peak number, and many ISPs used address pools obtained from their upstream provider, and then announced these fragments directly into the inter-domain routing system in accordance with local objectives of resilience through multi- homing, together with considerations of local traffic load balancing. The post-boom gradual consolidation of this industry sector is evidently mirrored in the decreasing level of address fragmentation as observed in the routing system.
Another Perspective on Address Allocation Effectiveness
There is another dimension to measure the effectiveness of address allocation, and thats by comparing the amounts of address space allocated over time and the proportion of these allocated address that are advertised in the inter-domain routing table. The overall intent of the allocation of public address space is to provide a resource to support the deployment of the public Internet. It is possible to measure the degree to which this objective has been achieved by looking at a time series of the proportion of allocated addresses that are currently advertised in the inter-domain routing table. The figure also shows a best fit to an order 5 polynomial function. Its not surprising to see that the older allocations, performed between 1983 and 1995, show a 60% advertisement on average. However, since 1997, over 90% of the allocations are in the routing table, and its only the very recent allocations where there is an observable time lag between the allocation and advertisement.
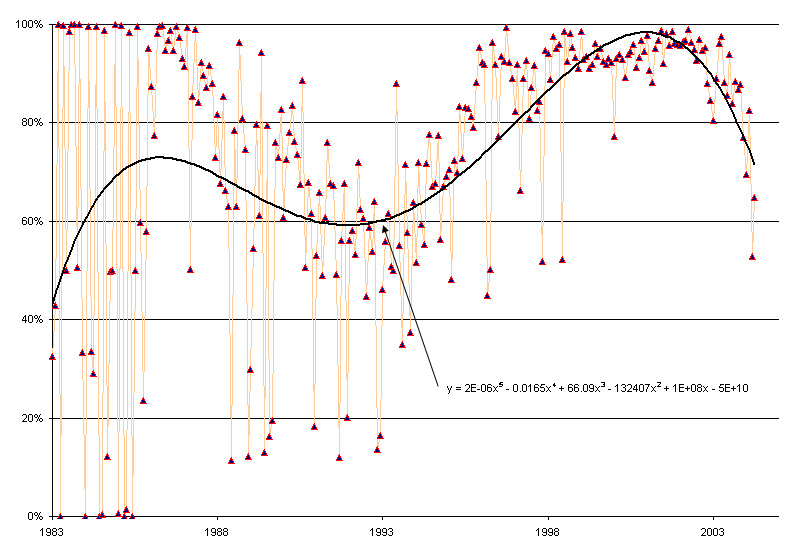
Time Series of the Ratio Advertised to Allocated Addresses
And some tentative conclusions
The current RIR address allocation policy environment dates back to around 1997 across all the RIRs, and this metric of the ratio of advertised to allocated addresses indicates that the policy objective, where public addresses are used in the context of the public Internet, is being achieved in practice.
Older address space appears to be either announced as originally allocated, or not announced at all. It appears that once an initial network address scheme is deployed the subsequent changes are relatively minor. This is not surprising, as altering the address deployment within a network involves renumbering the network, and this is a highly complex and expensive task.
Its also possible to guess that the level of fragmentation is related to the level of expansion within the ISP industry sector, although this is a relatively weak guess.
It also appears that the fit of allocation to advertisement is improving. This is not only a positive feedback message about the outcomes of the address policy process in meeting the technical requirements of the industry, but its also a positive message about the future prospects for the Internet's routing system. At least within one metric, the size of the routing table itself, we are collectively getting better at performing some good housekeeping in inter-domain routing.
So from this perspective it is possible to conclude that, in terms of the match of address allocations to the requirements of deployed networks, our address allocation policies appear to have reached a point where they are reasonably good match to the environment in which we work.
And next?
Now of course there many other aspects to the broader question of the fit of such IP address allocation policies to the scope of needs, and looking at the same question from different technical perspectives, as well as from economic and public policy perspectives, is, as they say, a matter for further study.

Disclaimer
The above views do not represent the views of the Internet Society, nor do they represent the views of the author’s employer, the Telstra Corporation. They were possibly the opinions of the author at the time of writing this article, but things always change, including the author's opinions!
About the Author
GEOFF HUSTON holds a B.Sc. and a M.Sc. from the Australian National University. He has been closely involved with the development of the Internet for the past decade, particularly within Australia, where he was responsible for the initial build of the Internet within the Australian academic and research sector. Huston is currently the Chief Scientist in the Internet area for Telstra. He is also the Executive Director of the Internet Architecture Board, and is a member of the APNIC Executive Committee. He was an inaugural Trustee of the Internet Society, and served as Secretary of the Board of Trustees from 1993 until 2001, with a term of service as chair of the Board of Trustees in 1999 ű 2000. He is author of a number of Internet-related books.