|
The ISP Column
A column on things Internet
|
|
|
Other Formats:
|
|
|
|
|
A DNS view of Lockdown
June 2020
Joao Damas,
Geoff Huston
At NANOG 79 earlier this month Craig Labowitz from Nokia Deepfield presented on the impact on the COVID-19 pandemic on Internet use. The approach to the analysis used real time streaming telemetry from Communication Service Provider (CSP) backbone and aggregation routers and the data analysis covered content provider networks in North America, Europe and parts of Asia. It is perhaps not a surprise to learn that Craig reported a major level of traffic growth in affected regions, and increased use of various video streamers and Zoom. Peak traffic volumes appear to be 30% to 50% higher in March 2020 than the previous “normal”. In March 2020, video streaming volumes rose earlier in the evening than previously (perhaps due to the lack of a lengthy commute from work for many), and peak hour weekend traffic in March was some 45% higher than pre-pandemic levels (perhaps due to the restrictions on movement). This should not be surprising, of course. Many countries enacted various social lockdown measures, schools and universities shut down their classrooms, the daily commute for many worked transformed to a trip to the keyboard, and many forms of social contact were mediated by WhatsApp, Zoom and Skype. We all shifted much of our lives online and Craig’s data reflects that major movement.
A similar story was evident using a study of DNS resolver patterns by InternetNZ's Sebastián Castro at the recent OARC 32a workshop. The lockdown in New Zealand saw increased DNS activity, and various events, such as daily broadcasts on the state of the pandemic could be mapped directly to DNS traffic activity.
Work and Home
Over the past couple of decades, we've actually constructed two quite distinct online environments. There is the enterprise network which is commonly encountered at physical workplaces, and there is the consumer network which has been deployed across residential domains. The result is that many observed characteristics of the network have patterns that reflected the differences between these work and home environments. These patterns are both reflected within each day, looking at the diurnal patterns of use, and also in the differences between weekdays and weekends. differences.
For example, Figure 1 shows the total level of capability for IPv6 in the first half of 2019 for the entire Internet, as measurement by APNIC Lab’s Internet measurement platform. There is a distinct weekly pattern in the data where weekend use shows some 2% more use of IPv6 by end systems than weekday use. It appears from this data that enterprise network environments have not embraced support IPv6 to the same extent as consumer network environments.
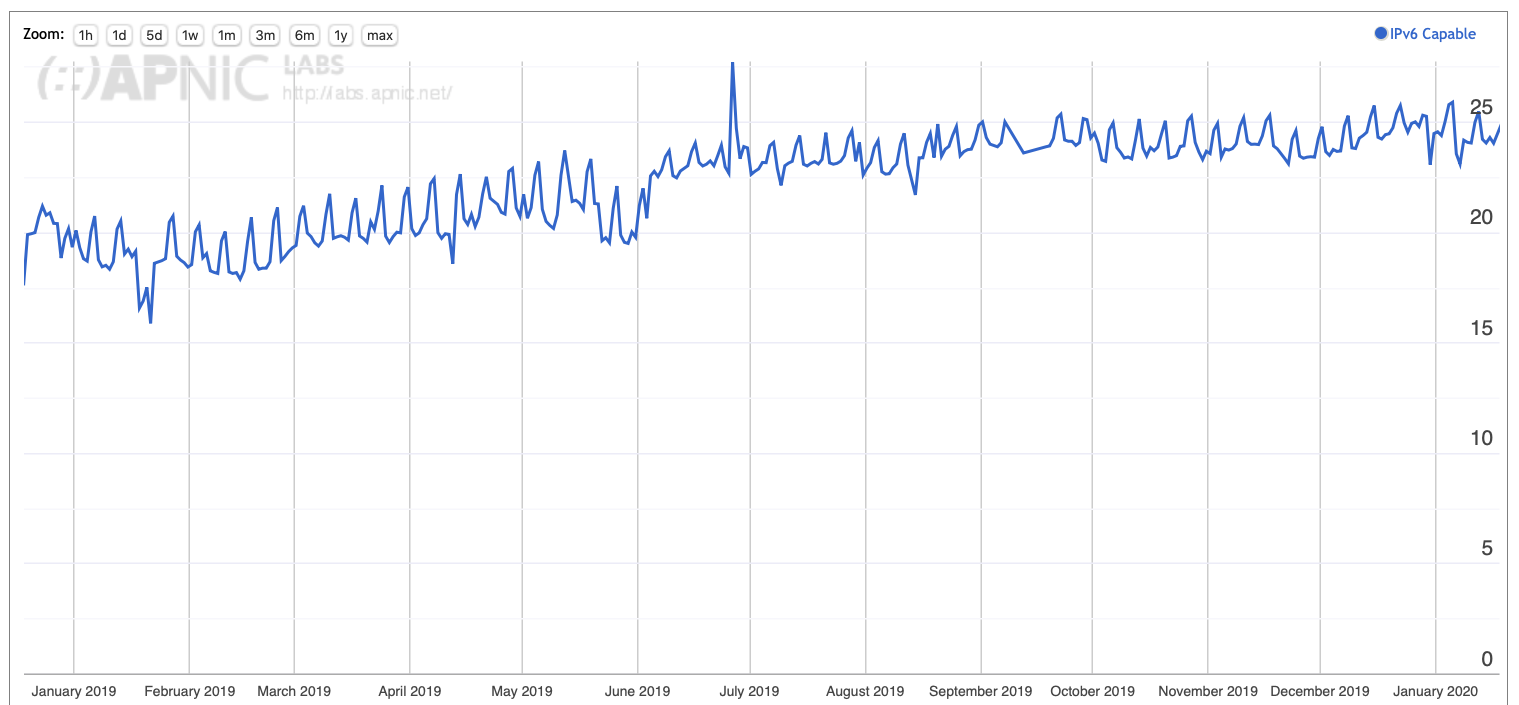
Figure 1 – Use of IPv6 in 2019
What about the DNS? Are there differences in the enterprise use of DNS resolvers that are different from consumer use? Figure 2 shows the level of use of four open DNS resolvers on a daily basis in the latter half of 2019. The record of the use of Google’s service (the red trace in Figure 2) shows a clear weekday/weekend difference. Google use is higher by 1 – 2% on weekdays over weekends. A similar pattern is evident in 114DNS (a Chinese operated open resolver, shown in green in Figure 2) and OpenDNS (shown in orange). The record for Cloudflare is not so clear at this scale (blue) but there is also evidence of a weekday / weekend use difference. It is likely that the use of Cloudflare as a trusted DoH resolver by Mozilla’s Firefox browser, starting in the second half of 2019 may have had a bearing on the weekday / weekend use profile of Cloudflare’s DNS service.
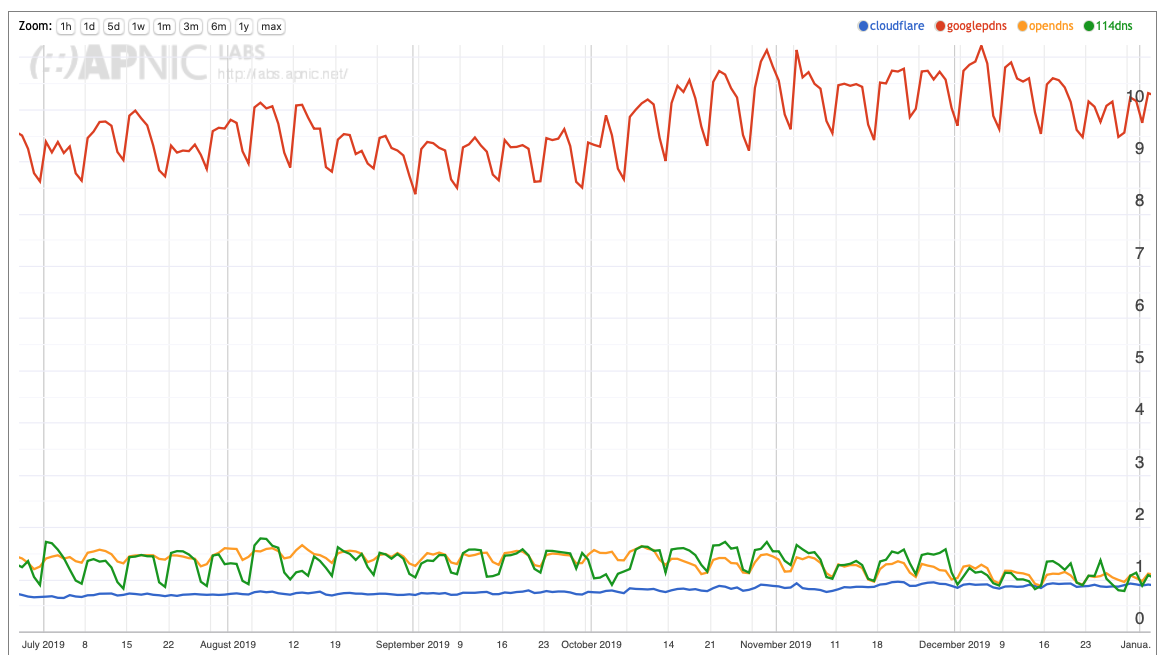
Figure 2 – Use of Open DNS Resolvers in 2019
In any case, using the weekday / weekend differences as a guide, we can see clear differences in IPv6 use and in the use of open DNS resolvers between enterprise and consumer network environments.
When the office workforce was sent home to work in the first half of 2020, did they take a VPN configuration with them that exactly replicated the at-work enterprise environment? Or were they using the consumer network services provided at home for their work? It’s likely that the answer is mixed. Some enterprise configurations include strict security requirements that replicate the enterprise environment in the home configuration and they probably rely on VPN tools to completely isolate the end device from the home environment. But other enterprises networks may not have such requirements and working from home may well include use of the services from the home provider network. In addition to this factor, there is the migration of mobile devices always going where the owner goes, which in the home tend to latch on to local WIFI whereas in the work environment might use either the enterprise network or the cellular data network.
To illustrate this, let’s look at the profile of use of DNS resolvers in one of the larger retail consumer ISPs in the United States, Comcast. Figure 3 shows the use of DNS resolvers by users of Comcast’s network, AS 7922 from December 2019 until early June 2020. The blue trace shows that on weekends some 82% of Comcast uses use Comcast’s own DNS resolvers, but this drops to 77% on weekdays. Much of this DNS query load is reflected in the use of Google’s public DNS service, where use of Google’s service is 3 – 4% higher on weekdays as compared to weekends.
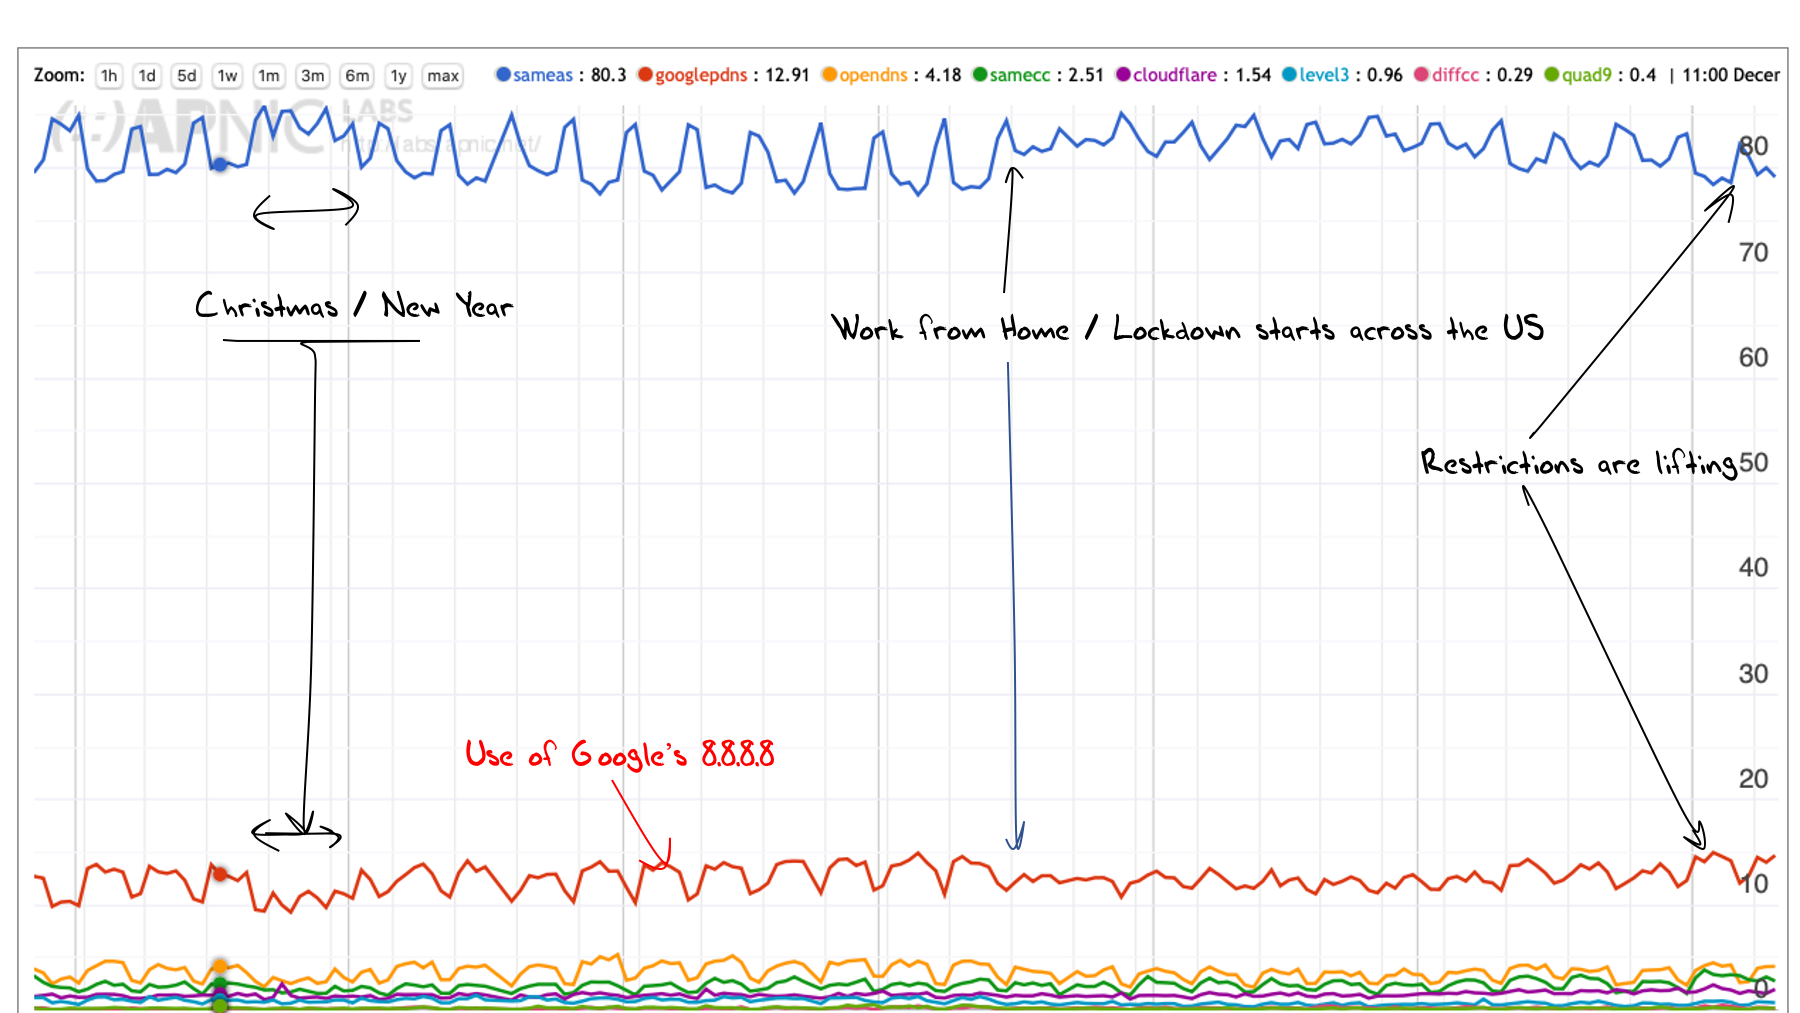
Figure 3 – Comcast User’s DNS resolvers
The second half of December shows a change in the weekly pattern associated with the holiday period. It’s also clear that the pattern of use of the DNS changed on Monday 16th March for Comcast’s users. The relative use of Google’s service dropped, and flattened across the week, and the use of Comcast’s own DNS services similarly flattened across each week for the last two weeks in March and through April. Signs of the US workforce heading back to the office are evident in May and in the first week of June the weekday use profile is much closer to that of before the pandemic.
Working from Home around the World
Using this approach, we can look at a number of national profiles of DNS use and see the effects of the pandemic lockdown and working from home.
Let’s start with China (Figure 4). We can clearly see a very drastic change in mid-late January. Chinese New Year fell on January 25th, 2020, and that was followed by a progressive lockdown in the country. The pre-pandemic use profile largely reappeared in April 2020, although the profile is slightly different to that of December 2019, so it may be that there is still some component of working from home in China. It is interesting to note the increasing use of Google’s DNS service from Chinese users across the first quarter of 2020 to a level that has been sustained across May and June 2020.
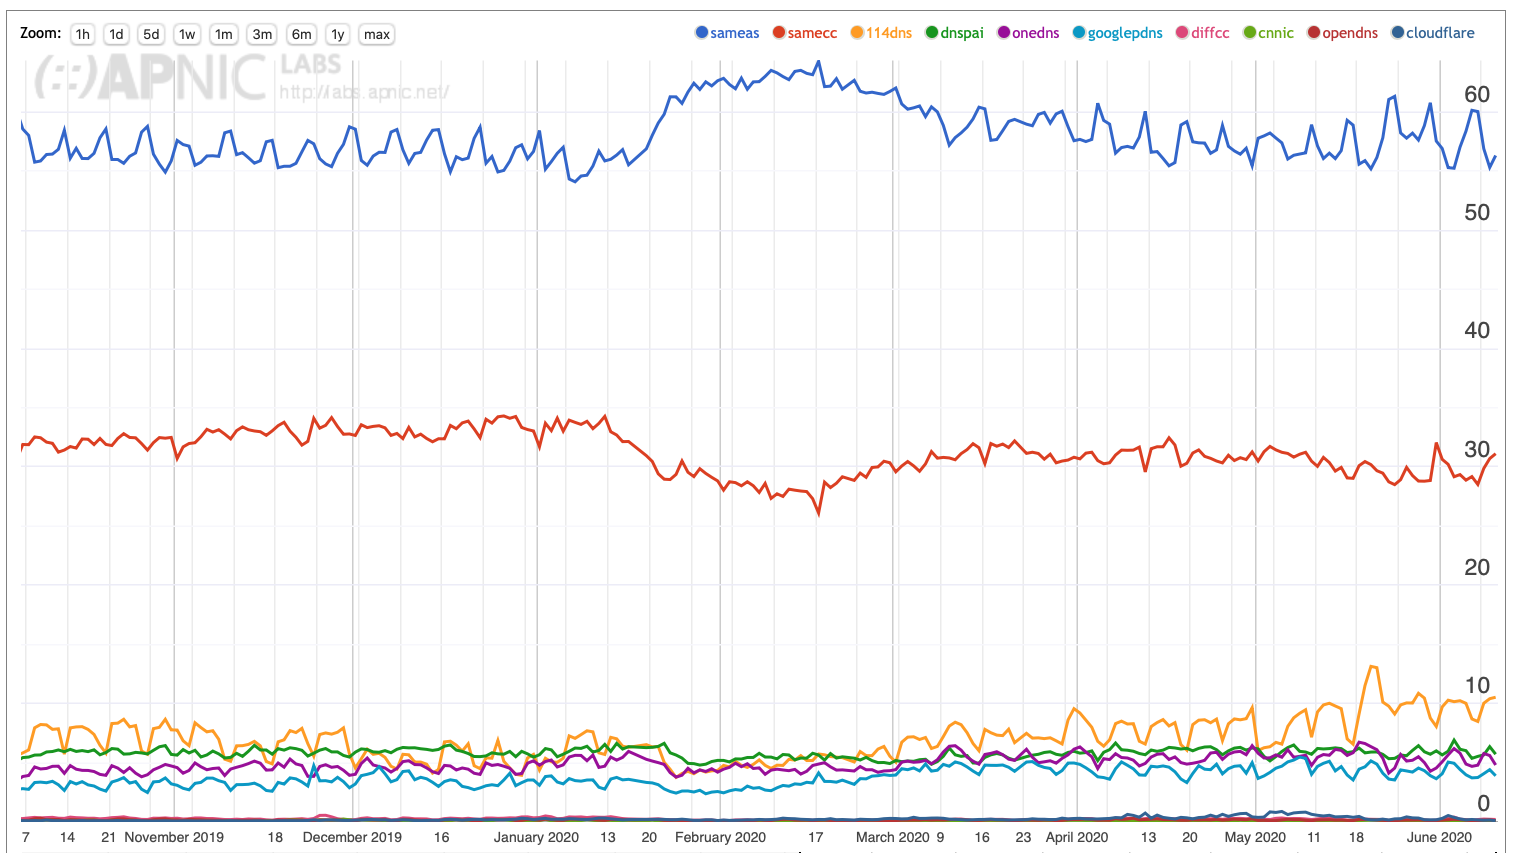
Figure 4 Use of DNS resolvers in China
In Europe, different countries have seen very different levels of intensity in the disease outbreak, but most had similar reactions, with the implementation of various levels of lockdown and working from home.
In Germany the change in behaviour is noticeable starting in mid-March, with an increase in use of in-network resolvers with a loss of traffic to public DNS resolvers, of which google is the biggest. It is also quite apparent how re-opening started in the first half of May. Observed behaviour shows that a significant amount of Google public DNS traffic originates in business networks.
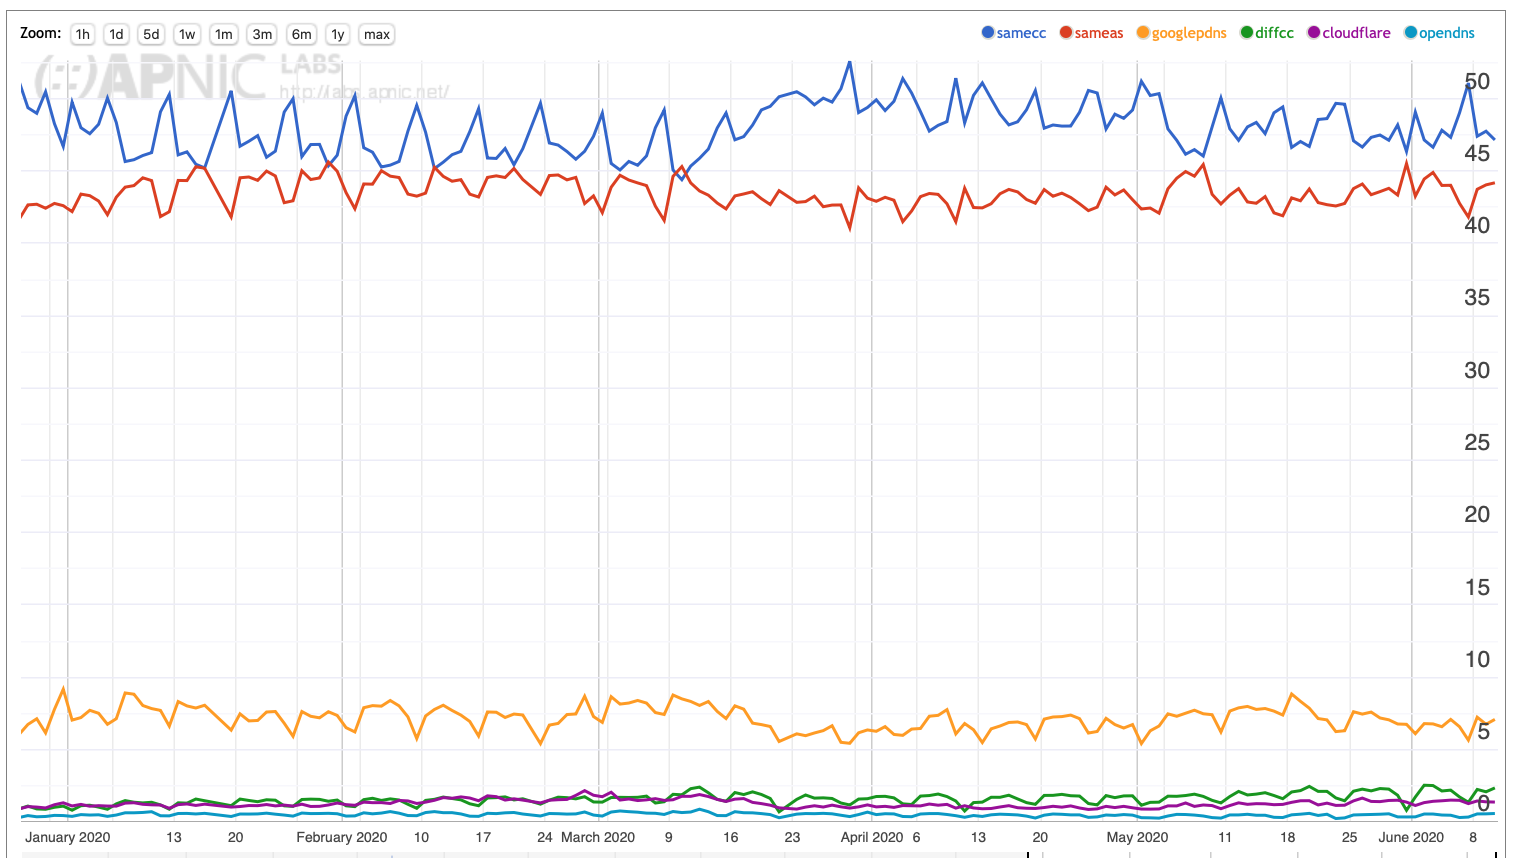
Figure 5 – DNS Resolver profile for Germany
France shows an even more marked effect (disregard the 3 spikes which are due to measurement artefacts) and an almost complete return to normality by June. Again the use of Google’s 8.8.8.8 service has increased by a couple of percentage points in France when comparing the current use of DNS resolvers with the situation at the start of 2020.
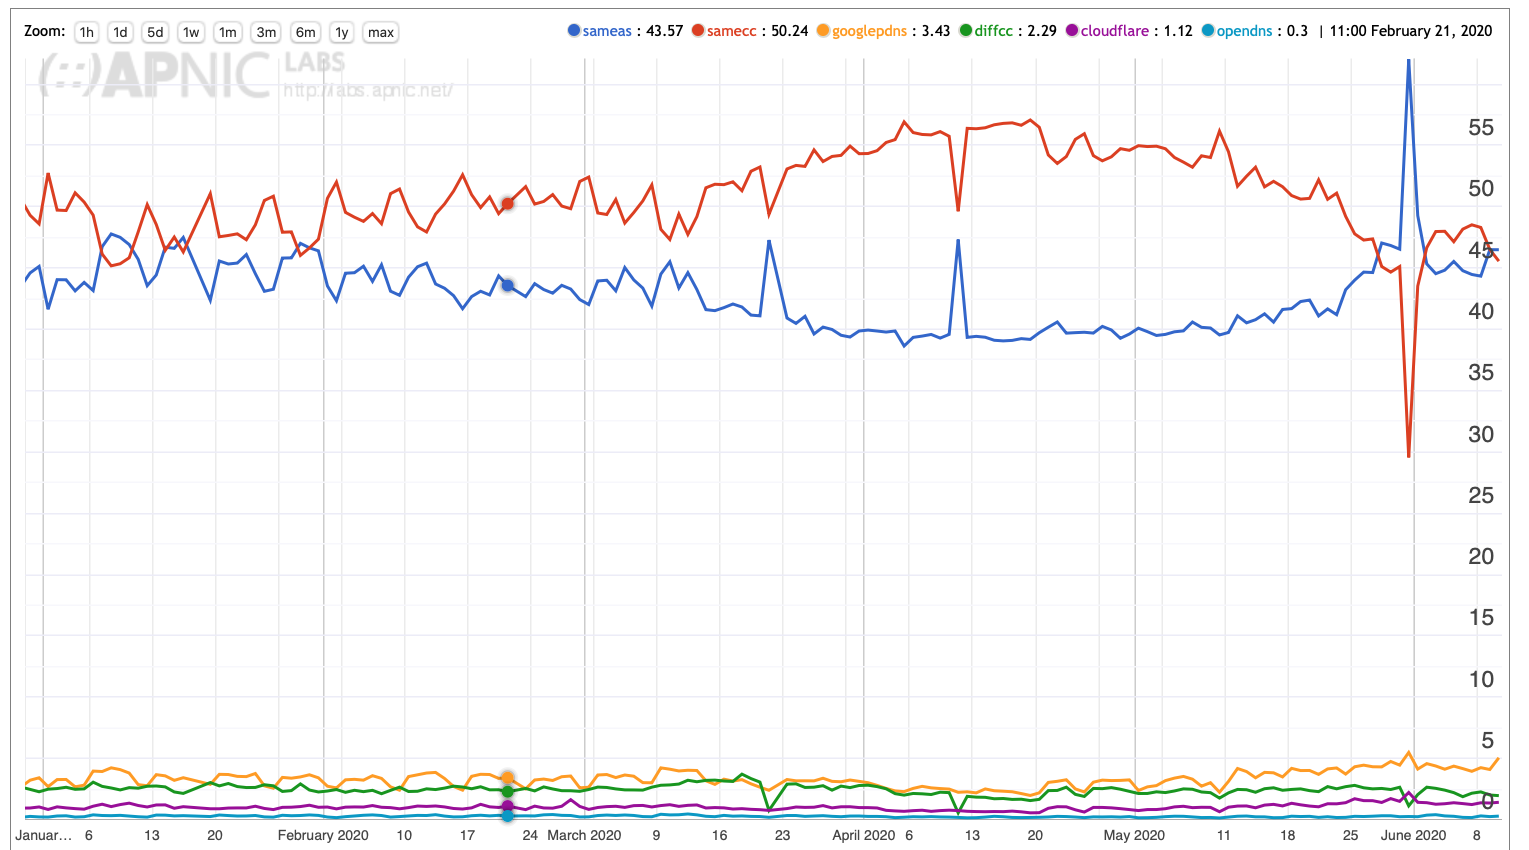
Figure 6 – DNS Resolver profile for France
In the UK the effects are seen a bit later than in other European countries and the observed changes have mostly to do with the disappearance of the normal weekly pattern in all DNS traffic at the end of March. This remains the case until early June.
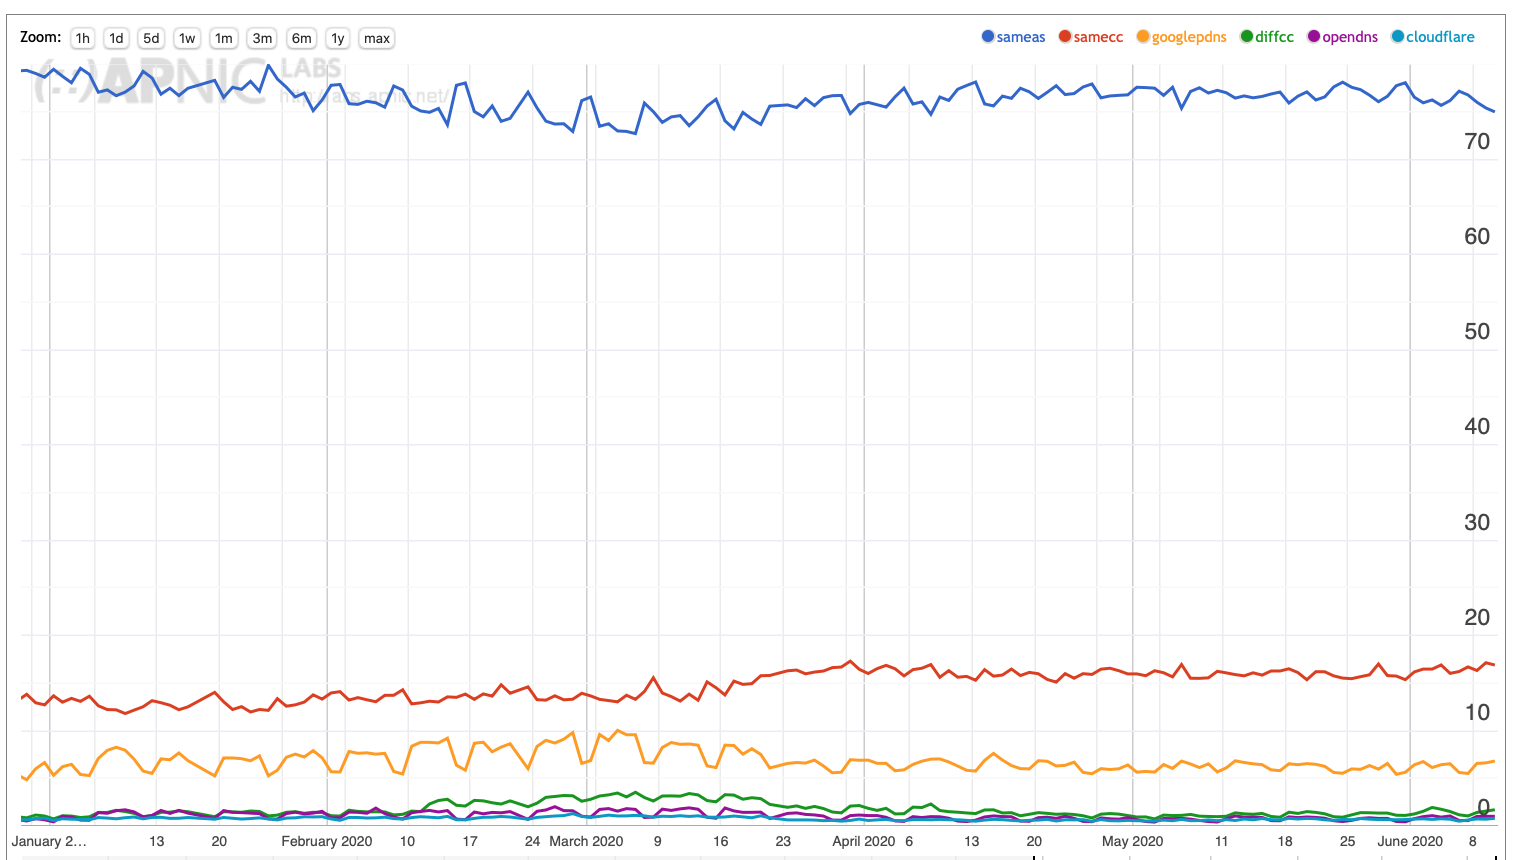
Figure 7 – UK DNS Profile
A similar behaviour is observed in Italy but with a migration of Google Public traffic to other in-country resolvers.
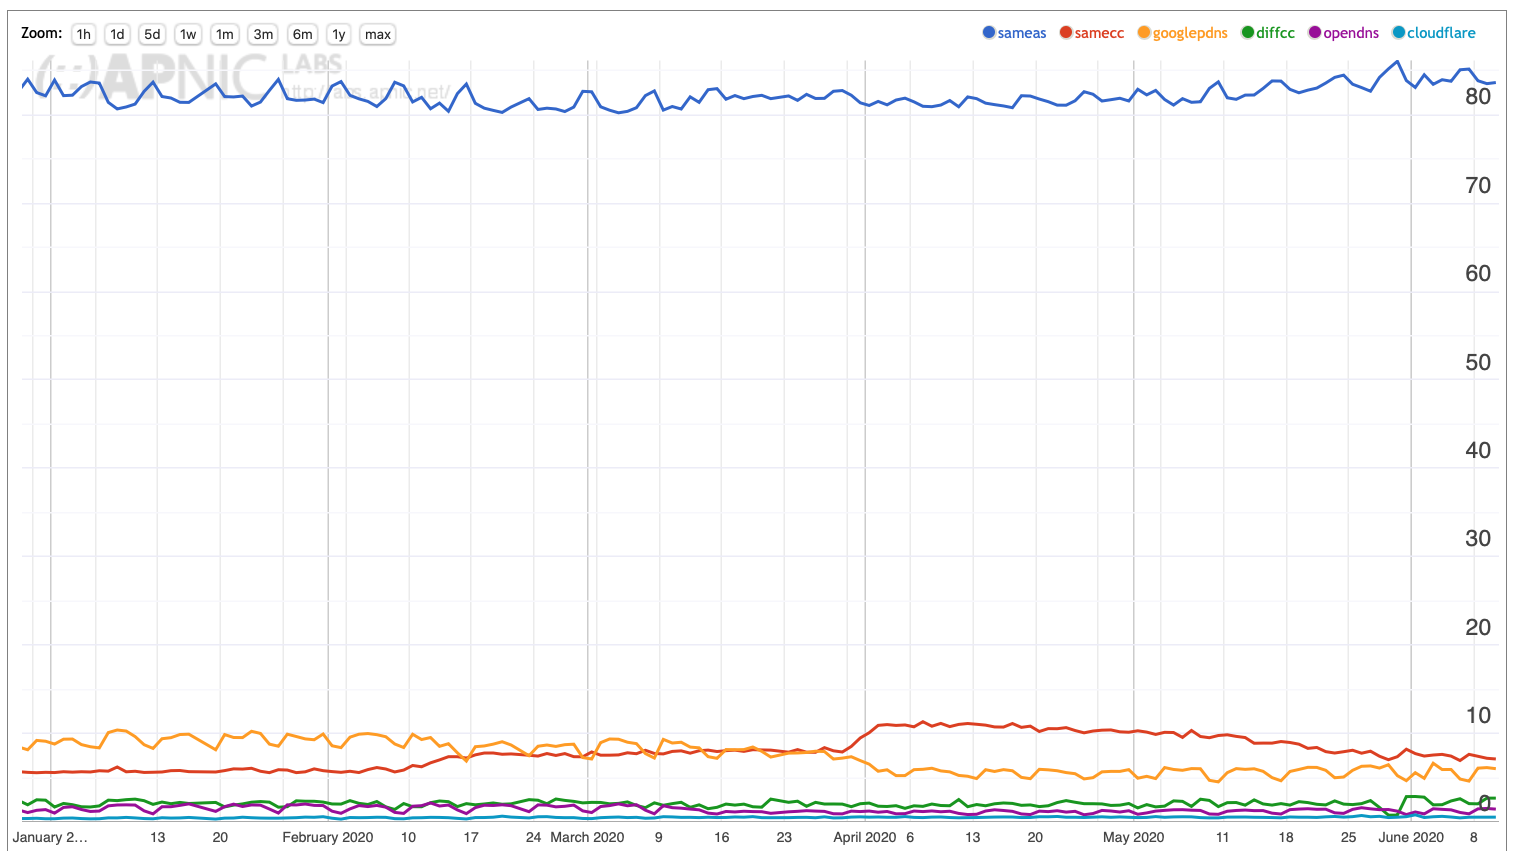
Figure 8 – Italy DNS Profile
Some countries did not, for their own reasons, implement lockdowns. Let’s look at Sweden, Brazil and Russia. These three countries show similar weekly use patterns throughout the whole of 2020 so far, with little evidence of a weekly use pattern that has been disrupted by the pandemic.
Sweden shows a massive shift in DNS resolver location in late February, unrelated to any lockdown activity (Telia, a major ISP in Sweden, moved blocks of DNS IPv4 addresses from their ISP network to their corporate network’s Autonomous System, but left their IPv6 DNS addresses in the consumer-side network’s Autonomous System, splitting the traffic roughly equally between their two networks.)
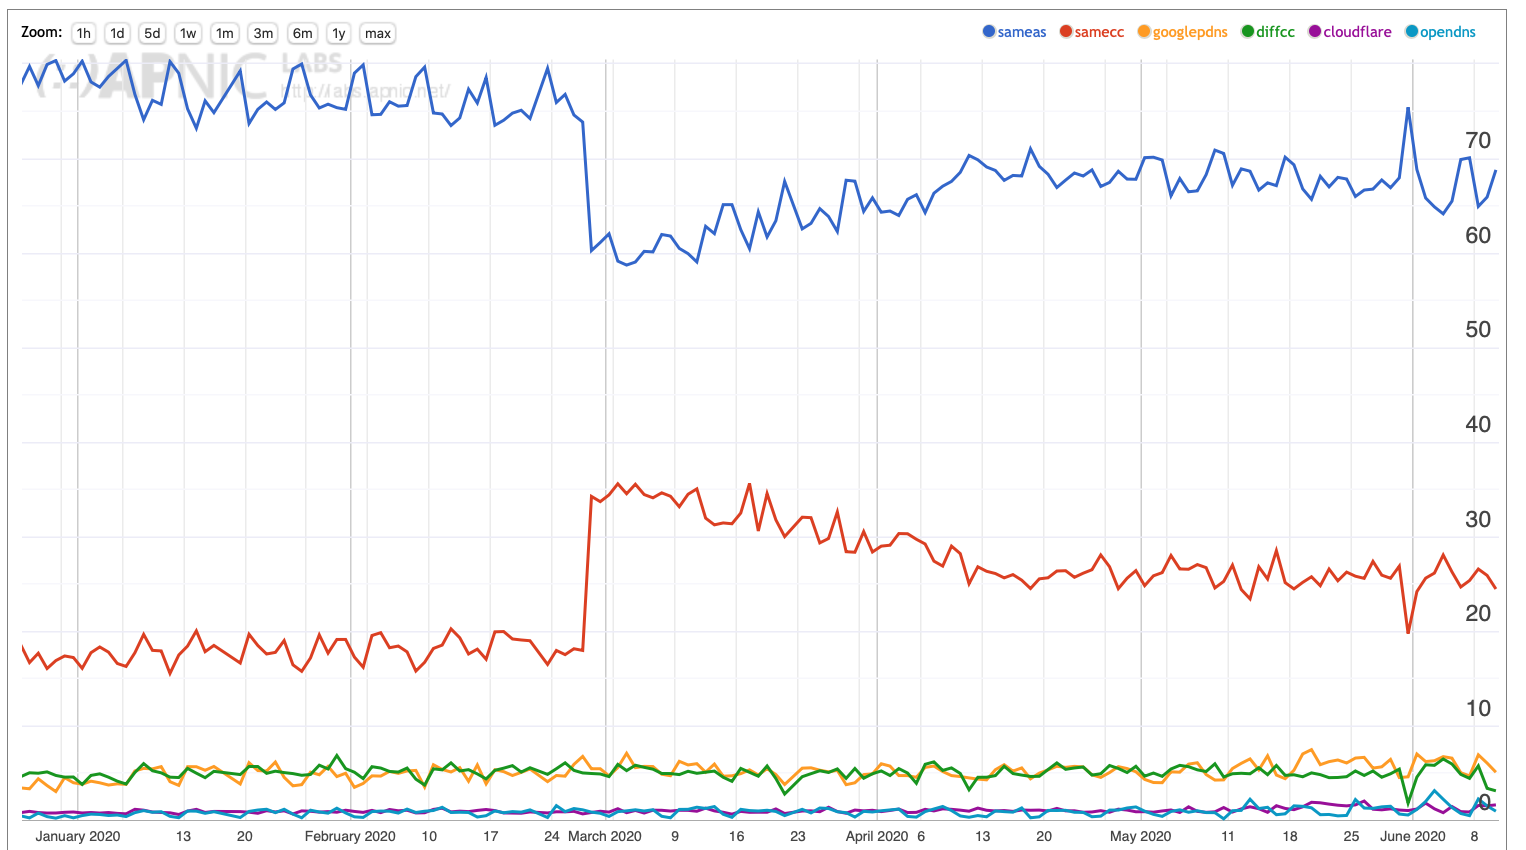
Figure 9 – Sweden DNS profile
The profile for Brazil (Figure 10) did not have a strong weekday and weekend signature, and there has been no change to this situation. The profile shows a steady increase of use of Google’s and Cloudflare’s open DNS services over 2020.
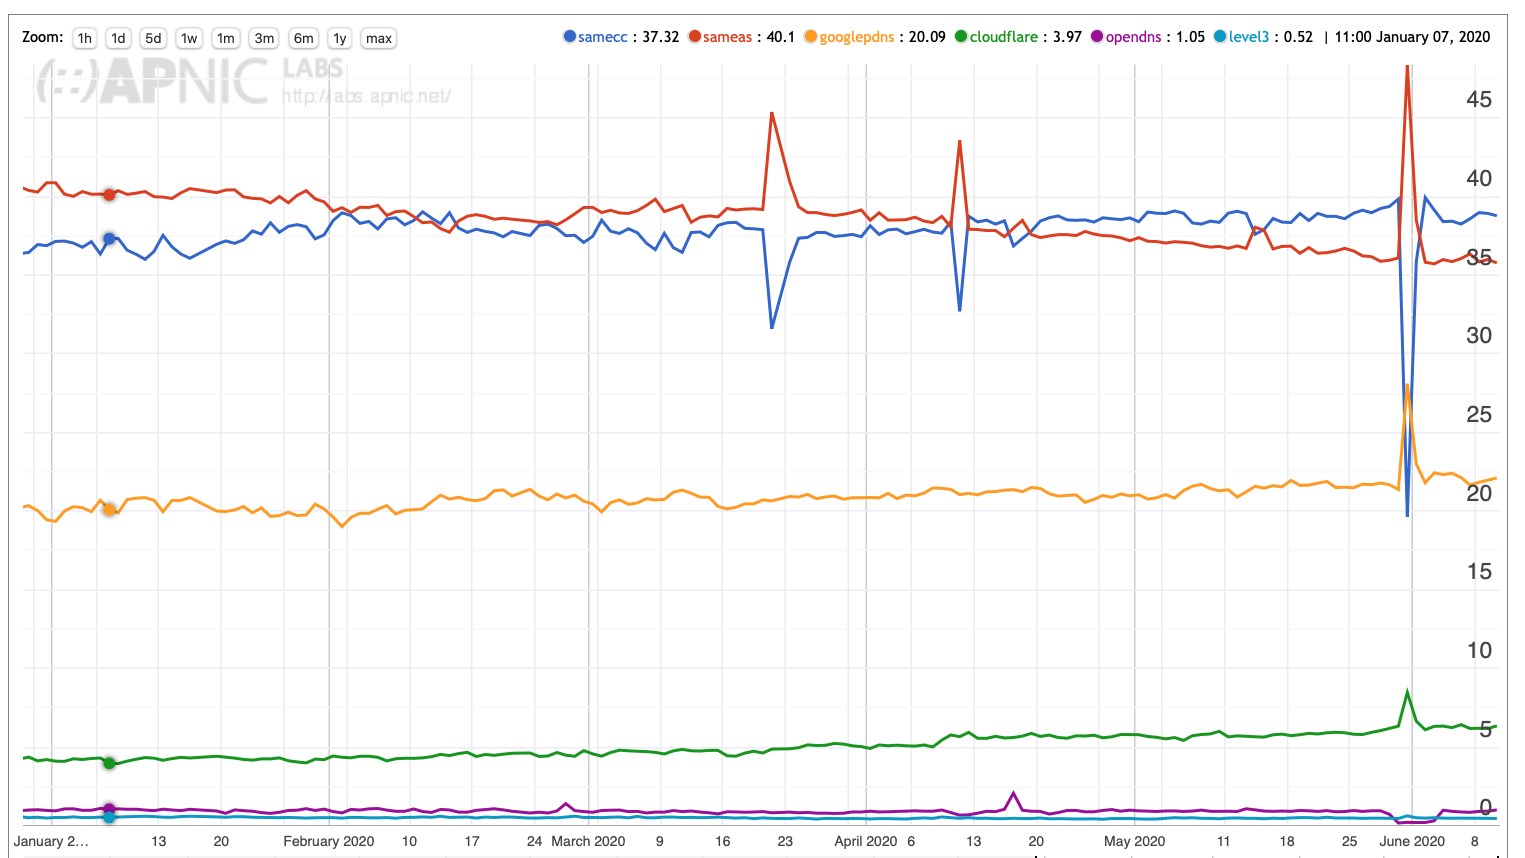
Figure 10 Brazil DNS profile.
In Russia (Figure 11) it the it use of Google’s DNS service that had a marked weekday and weekend profile of use, which weekday levels higher than weekend. This difference disappeared in early April 2020, and remains the case until early June. It points to some level of shift in enterprise activity in Russia, potentially involving working from home for some part of the workforce.
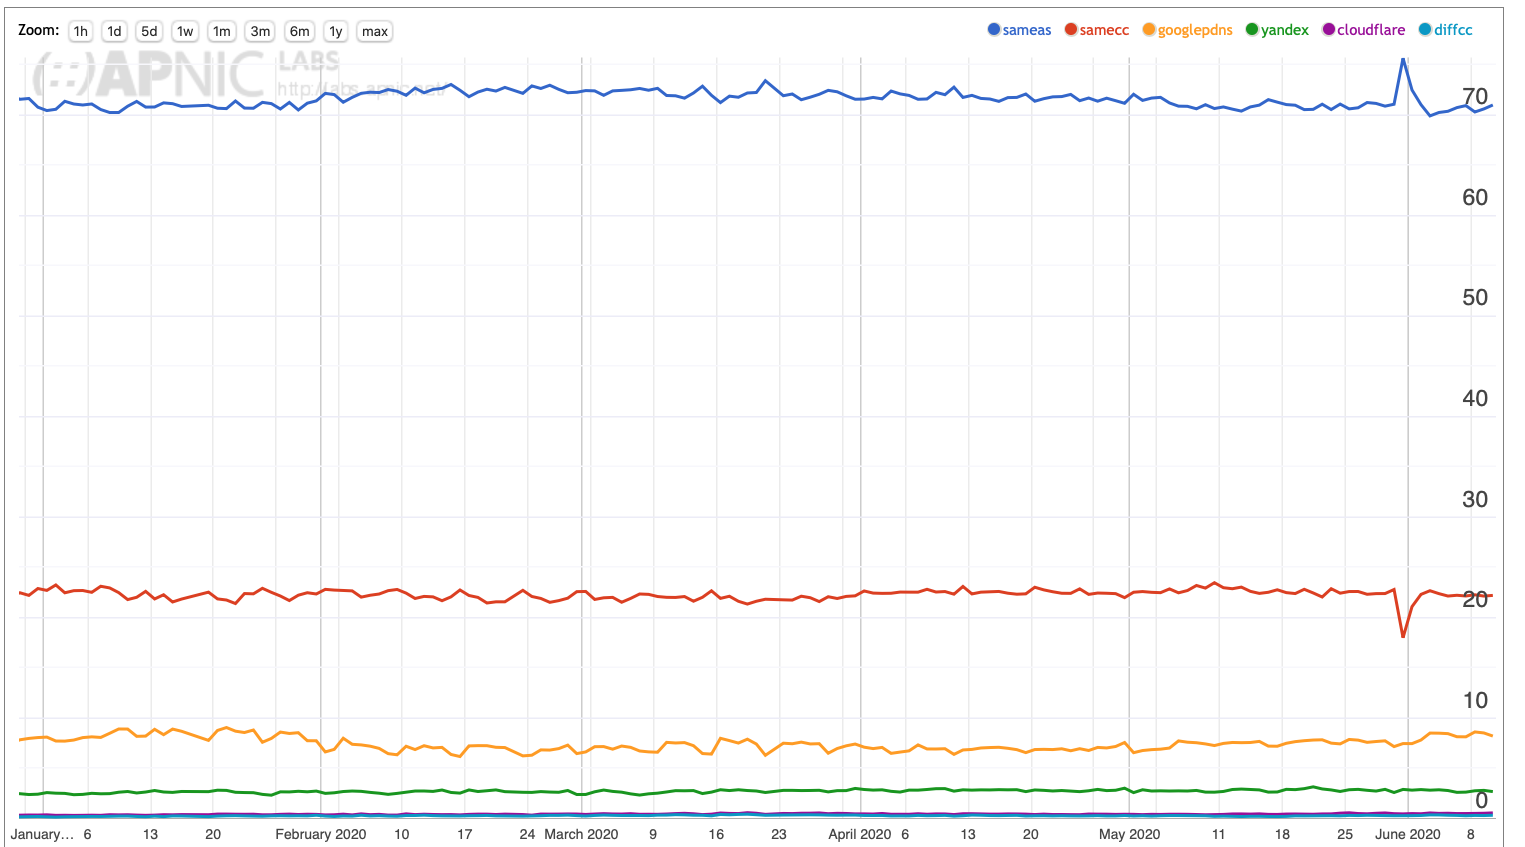
Figure 11 – Russia DNS profile
And finally, let’s look at New Zealand (Figure 12). Work from home started on the 23rd March but changes in behaviour become apparent in mid-February and the weekly distribution of the use of resolvers altered, notably in a rapid decline in the use of Google’s DNS service. At the same time use of non-local New Zealand resolvers increased. By the start of June 2020 it appears that use patterns have largely been restored and large scale work from home is over.
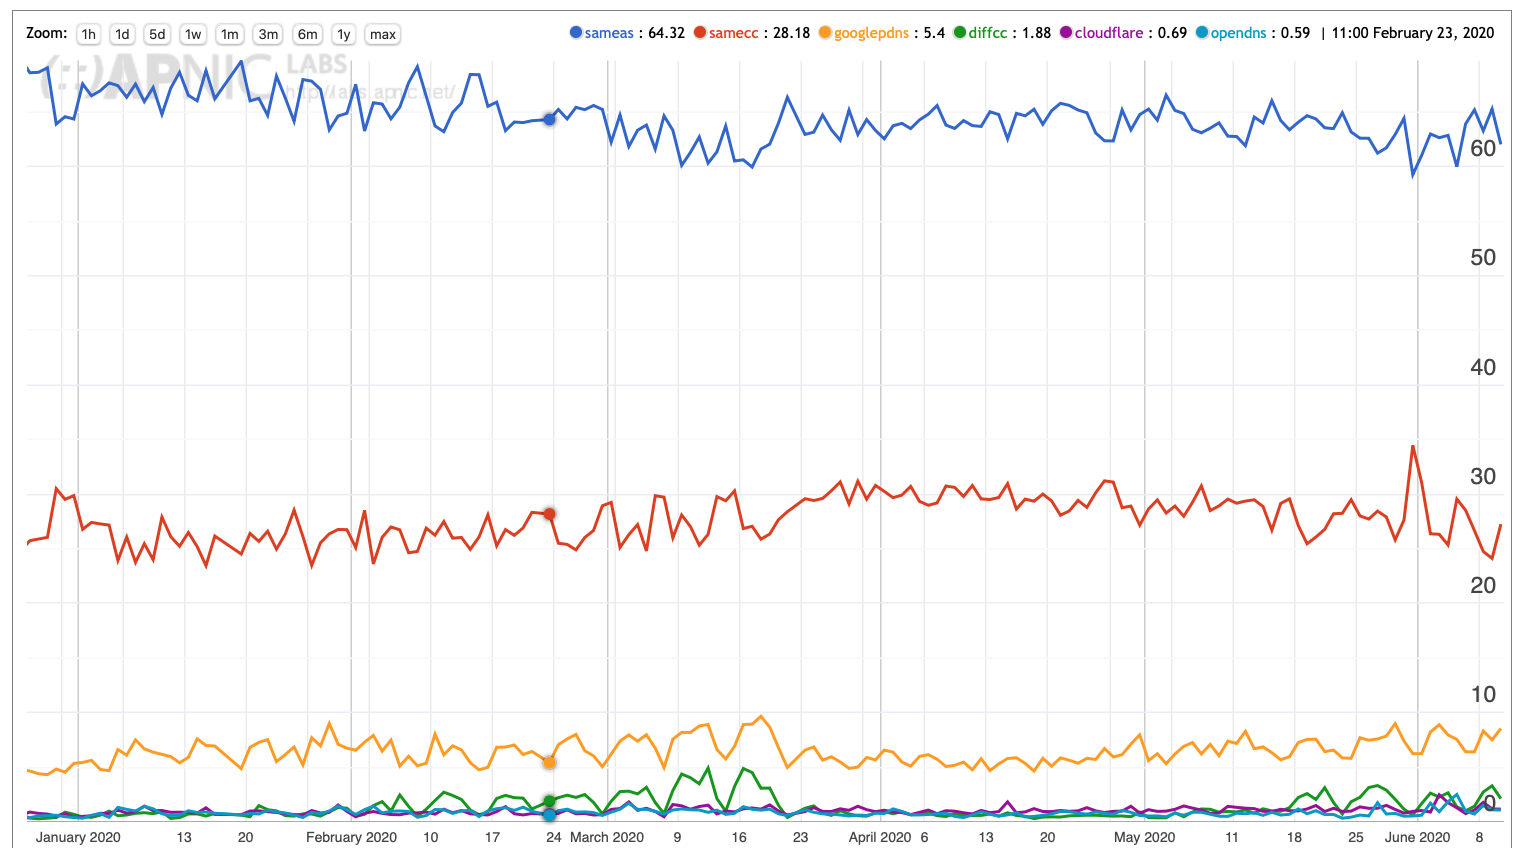
Figure 12 – New Zealand DNS Profile
Pausing Deployment in Lockdown
What about IPv6? One evident casualty of the pandemic is the continued deployment of IPv6. We ended 2019 with a 24% (weekday) – 26% (weekend) IPv6 use profile, which was an increase of 5% over the 12 months of 2019. By June the numbers are just 1% higher than the figures at the start of the year (Figure 13).
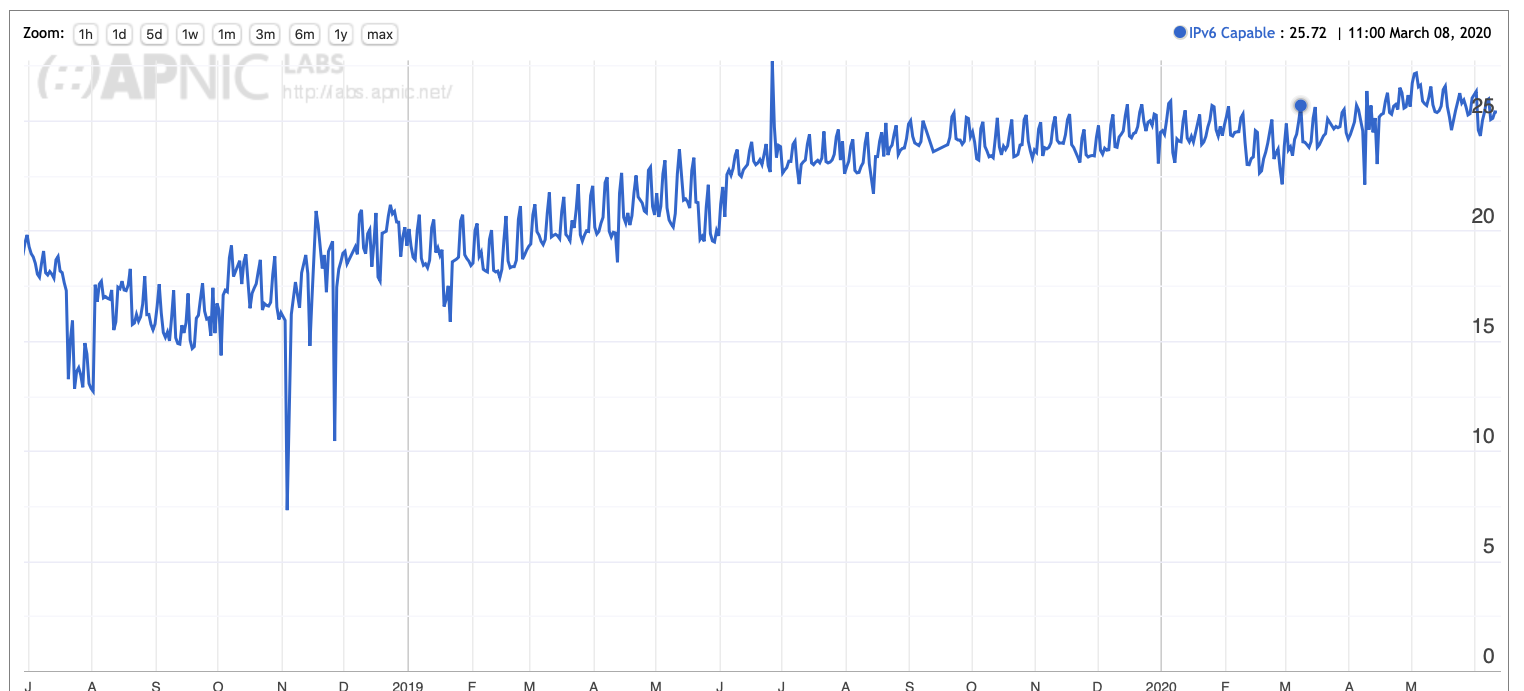
Figure 13 – IPv6 Use in the Internet 2019 - 2020
A similar picture of a temporary pause in expansion of deployment also appears to apply to DNSSEC validation (Figure 14).
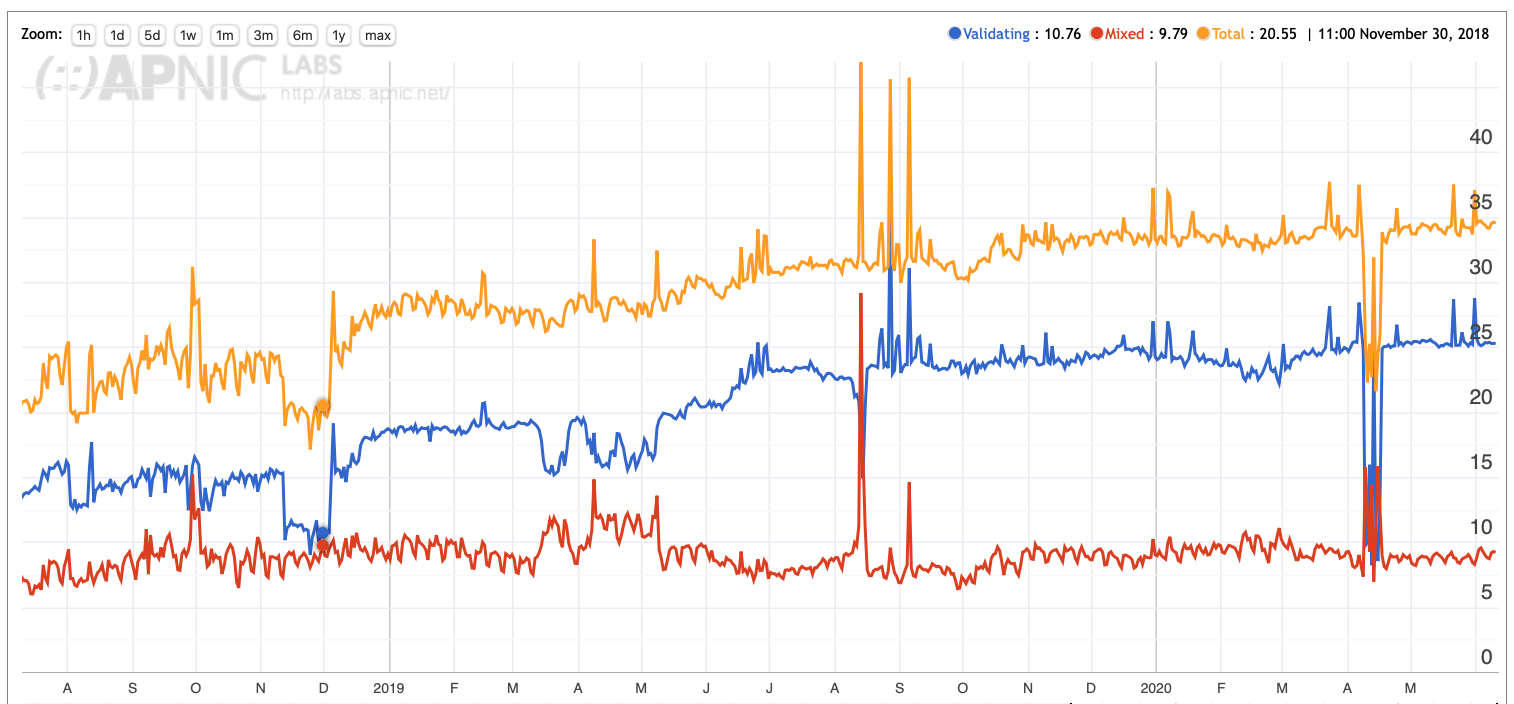
Figure 14 – DNSSEC validation deployment
Post Lockdown
The COVID-19 pandemic may not be over, and we may yet experience further waves of infection in the coming months, but it certainly appears that lockdown, and working from home, is largely over for most parts of the world. We seem to be back to the customary weekly profiles of network use and re-establishing the differences between what happens at work in enterprise networks and what happens at home in the consumer market.
What is perhaps the most amazing part of this rather unique set of circumstances is that the Internet has managed to cope with this major change in usage patterns relatively seamlessly. Yes, a number of streamers dropped the picture quality to reduce the streaming load on access network, but that’s been about all. We have not seen any widespread congestion collapse. We have not had to make emergency changes to the network in respond to the rapid changes that were created in a lockdown. The real story here is that the Internet has just kept on working!
![]()
Disclaimer
The above views do not necessarily represent the views of the Asia Pacific Network Information Centre.
![]()
About the Author
GEOFF HUSTON AM, B.Sc., M.Sc., is the Chief Scientist at APNIC, the Regional Internet Registry serving the Asia Pacific region.