|
The ISP Column
A column on things Internet
|
|
|
Other Formats:
|
|
|
|
|
Addressing 2018
January 2019
Geoff Huston
Time for another annual roundup from the world of IP addresses. Let’s see what has changed in the past 12 months in addressing the Internet and look at how IP address allocation information can inform us of the changing nature of the network itself.
Back in around 1992 the IETF gazed into the crystal ball and tried to understand how the internet was going to evolve and what demands that would place on the addressing system as part of the “IP Next Generation” study. The staggeringly large numbers of connected devices that we see today were certainly within the range predicted by that exercise. Looking further out, it is doubtless that these numbers will continue to grow. We continue to increase silicon production volumes and at the same time continue to refine the production process to decrease the unit costs of these chips. But, at that time, we also predicted that the only way we could make the Internet work across such a massive pool of connected devices was to deploy a new IP protocol that came with a massively larger address space. It was from that reasoning that IPv6 was designed. This world of abundant silicon was the issue that IPv6 was primarily intended to solve. The copious volumes of address space were intended to allow us to uniquely assign a public IPv6 address to every such device, no matter how small, or in what volume they might be deployed.
But while the Internet has grown at such amazing rates, the deployment of IPv6 continues at a more measured pace. There is no common sense of urgency about the deployment of this protocol, and still there is no hard evidence that the continued reliance on IPv4 is failing us at this moment. Much of the reason for this apparent contradiction between the designed- size of the IPv4 network and the actual size, which is of course many times larger, is that the Internet is now a client/server network. Clients can initiate network transactions with servers but are incapable of initiating transactions with other clients. Network Address Translators (NATs) are a natural fit to this client/server model, where pools of clients share a smaller pool of public addresses, and only required the use of an address while they have an active session with a remote server. NATs are the reason why in excess of 20 billion connected devices can be squeezed into some 2 billion active IPv4 addresses. Applications that cannot work behind NATs are no longer useful and no longer used.
However, the pressures of this inexorable growth in the number of deployed devices in the Internet means that the even NATs cannot withstand these growth pressures forever. Inevitably, either we will see the fragmenting of the IPv4 Internet into a number of disconnected parts, so that the entire concept of a globally unique and coherent address pool will be foregone, or we will see these growth pressures motivate the further deployment of IPv6, and the emergence of IPv6-only elements of the Internet as it tries to maintain a cohesive and connected whole. There are commercial pressures pulling the network in both of these directions, so it’s entirely unclear what path the Internet will follow in the coming years.
Can address allocation data help us to shed some light on what is happening in the larger Internet? Let’s look at what happened in 2018.
IPv4 in 2018
It appears that the process of exhausting the remaining pools of unallocated IPv4 addresses is proving to be as protracted as the process of the transition to IPv6.
The allocation of 14.5 million addresses in 2018 on top of a base of 3.65 billion addresses that are already allocated at the start of the year represents a growth rate of 0.5% for the year for the total allocated IPv4 public address pool. This is less that one tenth of the growth rate in 2010 (the last full year before the onset of IPv4 address exhaustion).
| 2008 | 2009 | 2010 | 2011 | 2012 | 2013 | 2014 | 2015 | 2016 | 2017 | 2018 | |
| Allocated Addresses (Millions) | 203.3 | 189.4 | 248.8 | 201.0 | 114.9 | 65.1 | 63.9 | 34.8 | 22.2 | 15.6 | 14.5 |
| Cumulative Total Volume (Billions) | 2.52 | 2.72 | 2.90 | 3.14 | 3.34 | 3.43 | 3.50 | 3.59 | 3.62 | 3.65 | 3.67 |
| Relative Growth | 7.9% | 6.6% | 8.3% | 6.4% | 2.7% | 2.0% | 2.6% | 0.8% | 0.8% | 0.5% |
Table 1 - IPv4 Allocated addresses by year
The record of address allocations per RIR over the past 10 years is shown in Table 2.
| RIR | 2008 | 2009 | 2010 | 2011 | 2012 | 2013 | 2014 | 2015 | 2016 | 2017 | 2018 |
| APNIC | 87.8 | 86.9 | 120.2 | 105.2 | 1.0 | 1.3 | 3.7 | 4.1 | 3.8 | 1.8 | 1.8 |
| RIPE NCC | 44.0 | 43.4 | 56.0 | 43.1 | 40.0 | 2.0 | 2.5 | 3.3 | 3.4 | 3.6 | 4.7 |
| ARIN | 57.1 | 41.1 | 45.2 | 23.5 | 45.0 | 26.5 | 26.0 | 8.6 | 1.6 | 0.8 | 0.6 |
| LACNIC | 12.0 | 10.5 | 13.0 | 24.4 | 21.0 | 28.5 | 19.1 | 1.8 | 1.6 | 1.7 | 1.3 |
| AFRINIC | 1.6 | 5.9 | 8.5 | 9.2 | 7.9 | 6.8 | 12.5 | 16.9 | 11.8 | 7.8 | 6.1 |
Table 2 - IPv4 Allocated addresses (millions) - Distribution by RIR
In terms of the IPv4 Internet there is a considerable diversity in the situation in each region. As of the end of 2018, AFRINIC was the last remaining Regional Internet Registry (RIR) with remaining IPv4 addresses available for general allocation, with some 6.7 million addresses left in its available address pool. APNIC and the RIPE NCC have both adopted “Last /8” policies, where each applicant can receive just a single allocation of up to 1,024 addresses from their respective last /8 address pools. APNIC has 3.9 million addresses left in this pool, and the RIPE NCC has some 6.0 million addresses. LACNIC has a pool of 1.5 million available addresses, while ARIN has none at all.
We can use the address allocation data from 2018 and perform a forward extrapolation on this to predict when the available address pools of each RIR will be exhausted. This linear projection model is shown in Figure 1.
The address consumption rate for APNIC has been relatively steady in 2017 and 2018, and at this stage the pool will last for a further 30 months at this allocation rate (July 2021). The RIPE NCC uses a similar address management policy for its remaining pool of addresses, but the consumption rate is slightly higher than that of APNIC, and it increased in 2018 as compared to previous years, so this pool will last for a further 18 months at its current rate of consumption (July 2020). LACNIC’s remaining address pool will last for a further 12 months, which is similar to the situation in AFRINIC (according to this projection both RIRs will running out of addresses at the end of 2019). ARIN has completely exhausted its available pool.
The forecast of likely exhaustion dates for each RIR is shown in Table 3.
| RIR | Projected Exhaustion |
| ARIN | exhausted |
| AFRINIC | late-2019 |
| LACNIC | late-2019 |
| RIPE NCC | mid-2020 |
| APNIC | mid-2021 |
Table 3 - IPv4 Address Pool Depletion Projections by RIR
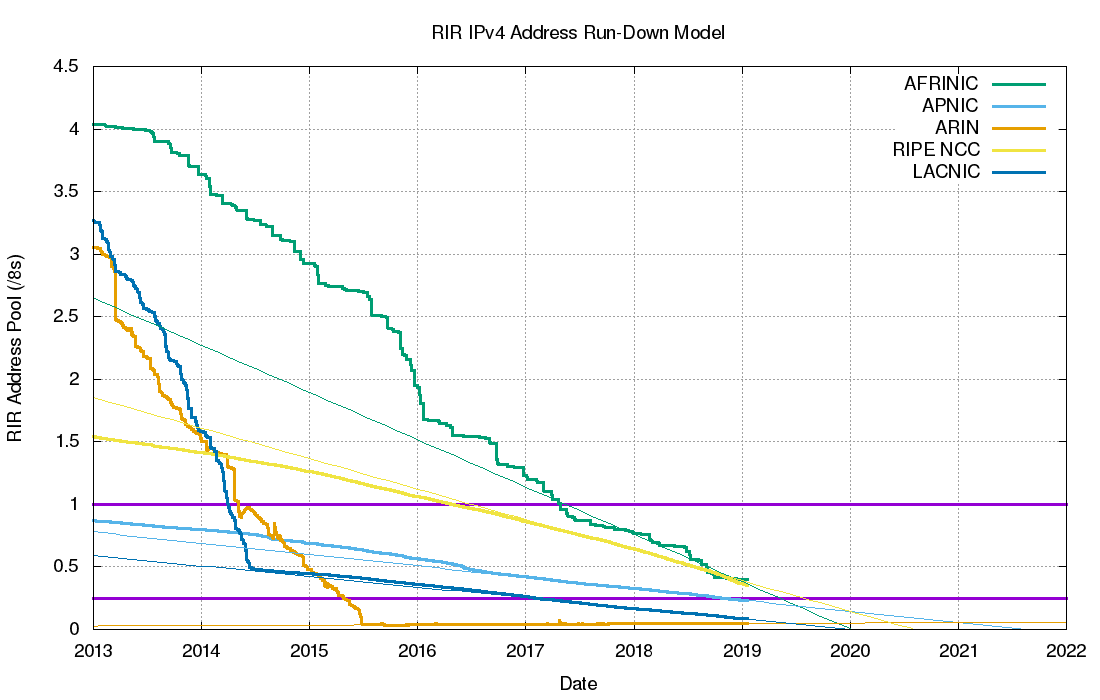
Figure 1 – IPv4 RIR pool runout scenarios
This analysis of the remaining address pools is not quite the complete picture, as each of the RIRs also have reserved some addresses, in accordance with their local policies. There are a variety of reasons for this reservation, including non-contactability of the original address holder, or addresses undergoing a period of ‘quarantine’ following a forced recovery, or a reservation as prescribed by a local policy. As of the start of 2019, ARIN has 5.9 million reserved IPv4 addresses, APNIC has 4.4 million, AFRINIC 2.0 million, the RIPE NCC has 780 thousand, and LACNIC 1.2 million. The total pool of reserved IPv4 addresses is some 14.2 million addresses in size, or the equivalent of slightly less than one /8 address block Finally, the IANA is holding 3,3288 addresses in its recovered address pool in 13 discrete /24 address blocks.
The RIR IPv4 address allocation volumes by year are shown in Figure 2.
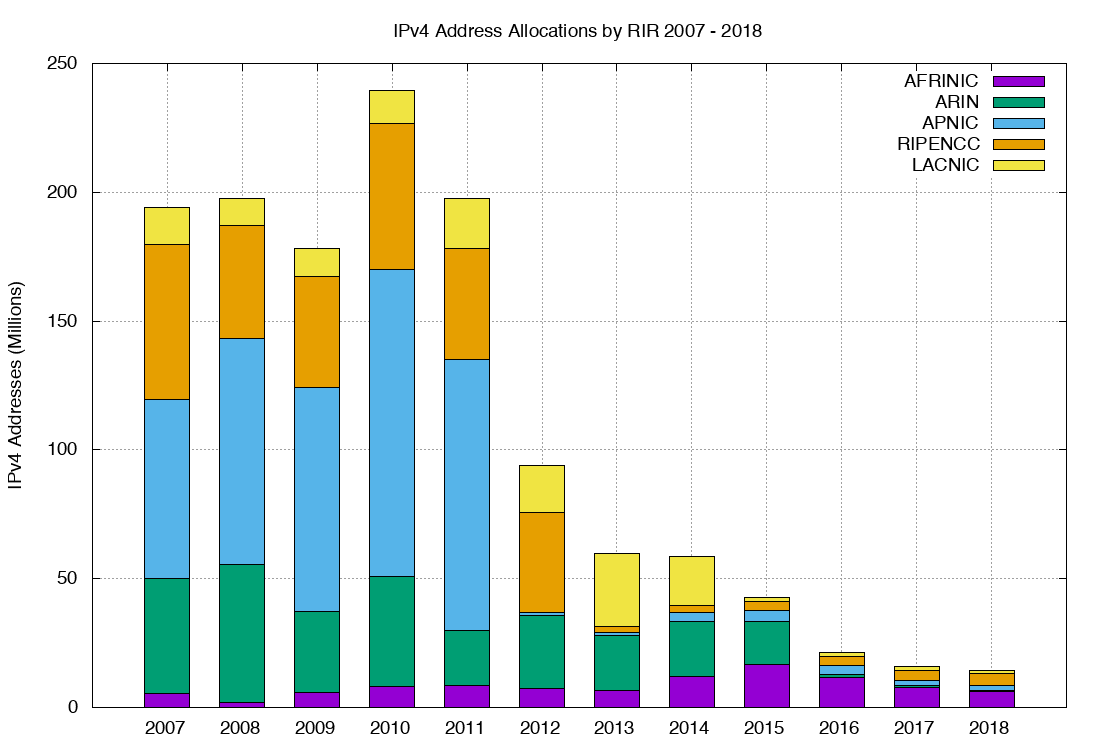
Figure 2 – IPv4 Allocations by RIR by year
IPv4 Address Transfers
In recent years the RIRs have included the registration of IPv4 transfers between address holders, as a means of allowing secondary re-distribution of addresses as an alternative to returning unused addresses to the registry. This has been in response to the issues raised by IPv4 address exhaustion, where the underlying motivation as to encourage the reuse of otherwise idle or inefficiently used address blocks through the incentives provided by a market for addresses, and to ensure that such address movement is publically recorded in the registry system.
The numbers of registered transfers in the past six years is shown in Table 4.
| Receiving RIR | 2012 | 2013 | 2014 | 2015 | 2016 | 2017 | 2018 |
| ARIN | 27 | 30 | 58 | 627 | 1,900 | 3,041 | 4,540 |
| APNIC | 168 | 198 | 418 | 471 | 589 | 479 | 507 |
| RIPE NCC | 10 | 171 | 1,054 | 2,837 | 2,426 | 2,649 | 4,131 |
| LACNIC | 0 | 0 | 0 | 0 | 5 | 13 | 25 |
| AFRINIC | 0 | 0 | 0 | 0 | 0 | 0 | 17 |
| Total | 205 | 399 | 1,530 | 3,935 | 4,920 | 6,182 | 9,220 |
Table 4 - IPv4 Address Transfers per year
A slightly different view is that of the volume of addresses transferred per year (Table 5).
| Receiving RIR | 2012 | 2013 | 2014 | 2015 | 2016 | 2017 | 2018 |
| ARIN | 4,862,208 | 5,128,448 | 4,744960 | 44,702,464 | 111,520,512 | 37,942,528 | 258,358,528 |
| APNIC | 1,822,464 | 2,151,680 | 4,807,040 | 96,743,808 | 8,244,736 | 4,409,344 | 10,457,344 |
| RIPENCC | 65,536 | 1,977,344 | 9,644,544 | 11,604,224 | 9,572,096 | 25,021,568 | 21,005,568 |
| LACNIC | 0 | 0 | 0 | 0 | 59,932 | 99,328 | 83,968 |
| AFRINIC | 0 | 0 | 0 | 0 | 0 | 0 | 174,336 |
| Total | 6,750,208 | 9,257,472 | 19,196,544 | 153,050,496 | 129,397,276 | 67,472,768 | 290,003,968 |
Table 5 – Volume of Transferred IPv4 Addresses per year
A plot of these numbers is shown in Figures 3 and 4.
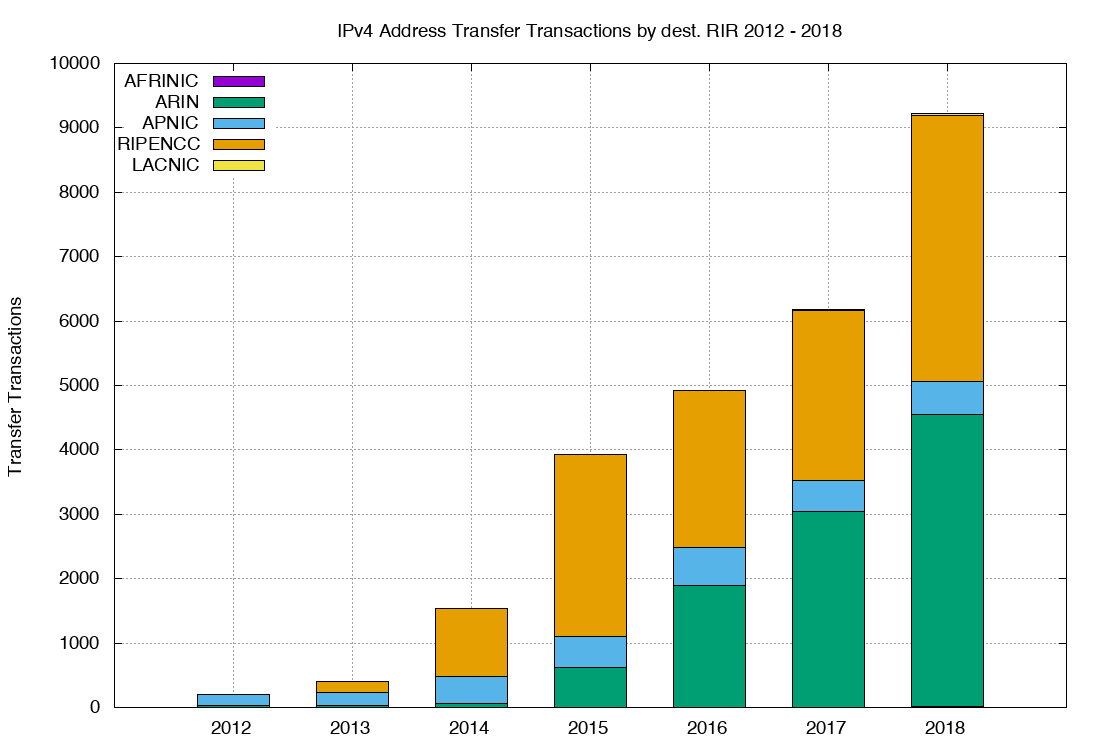
Figure 3 – Number of Transfers: 2012 - 2018
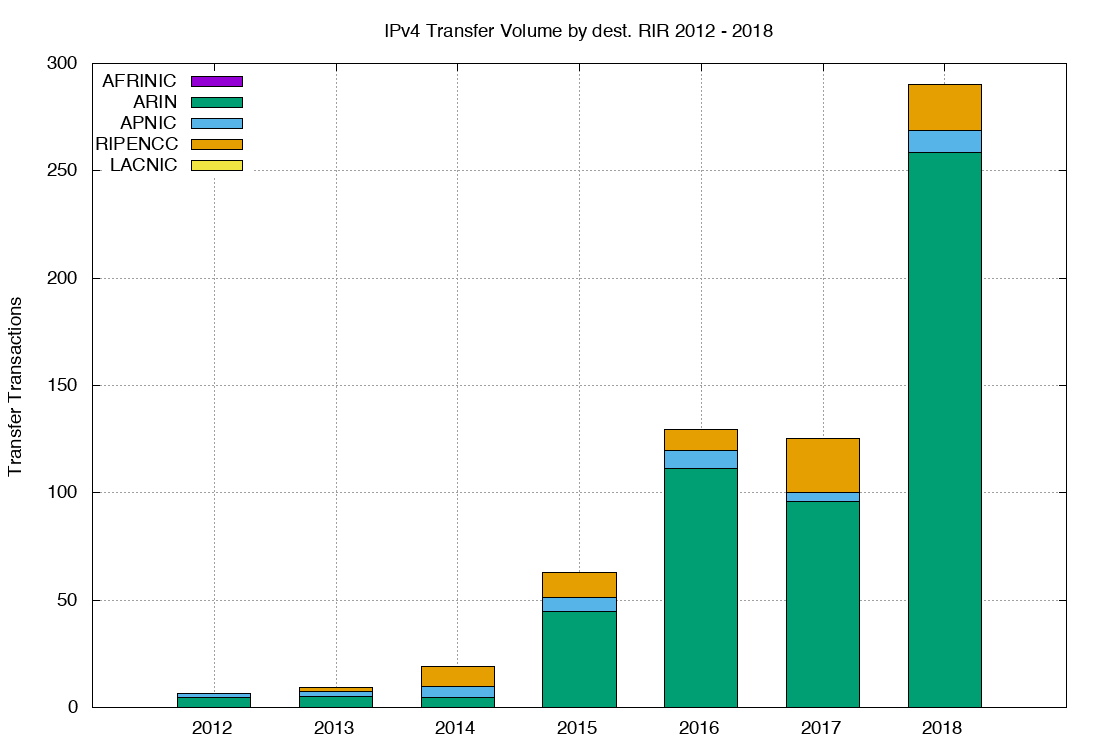
Figure 4 – Volume of Transferred Addresses: 2012 - 2018
The total volume of addresses transferred in this way is twenty times the volume of allocated addresses across 2018. The aggregate total of addresses in the transfer logs since 2012 is some 675 million addresses, or the equivalent of 40 /8s, which is some 18% of the total delegated IPv4 address space.
This data raises some questions about the nature of transfers.
The first question is whether address transfers have managed to be effective in dredging the pool of allocated but unadvertised public IPv4 addresses.
It was thought that by being able to monetize these addresses, holders of such addresses may have been motivated to convert their networks to use private addresses and resell their holding of public addresses. In other words, the opening of a market in addresses would provide incentive for otherwise unproductive address assets to be placed on the market. Providers who had a need for addresses would compete with other providers who had a similar need in bidding to purchase these addresses. In conventional market theory the most efficient user of addresses (here “most efficient” is based on the ability to use addresses to generate the greatest revenue) would be able to set the market price. Otherwise unused addresses would be put to productive use, and as long as demand outstrips supply the most efficient use of addresses is promoted by the actions of the market. In theory.
However, the practical experience is not so clear. The data relating to address re-use is inconclusive, in that between 2011 and late 2017 the pool of unadvertised addresses sat between some 43 and 44 /8s. This pool of addresses rose in 2018 and by the end of 2018 was sitting at some 49 /8s. Rather than reducing the pool of unused (unadvertised) addresses, this pool appears to be expanding in size over 2018.
In relative terms, expressed as a proportion of the total pool of allocated IP addresses, the unadvertised address pool dropped from 23% of the total allocated address pool in 2011 to a low of some 21% at the start of 2016, and subsequently risen to 22% by the end of 2018. The address transfer activity has not made a substantial change in the overall picture of address utilisation efficiency in the past 12 months.
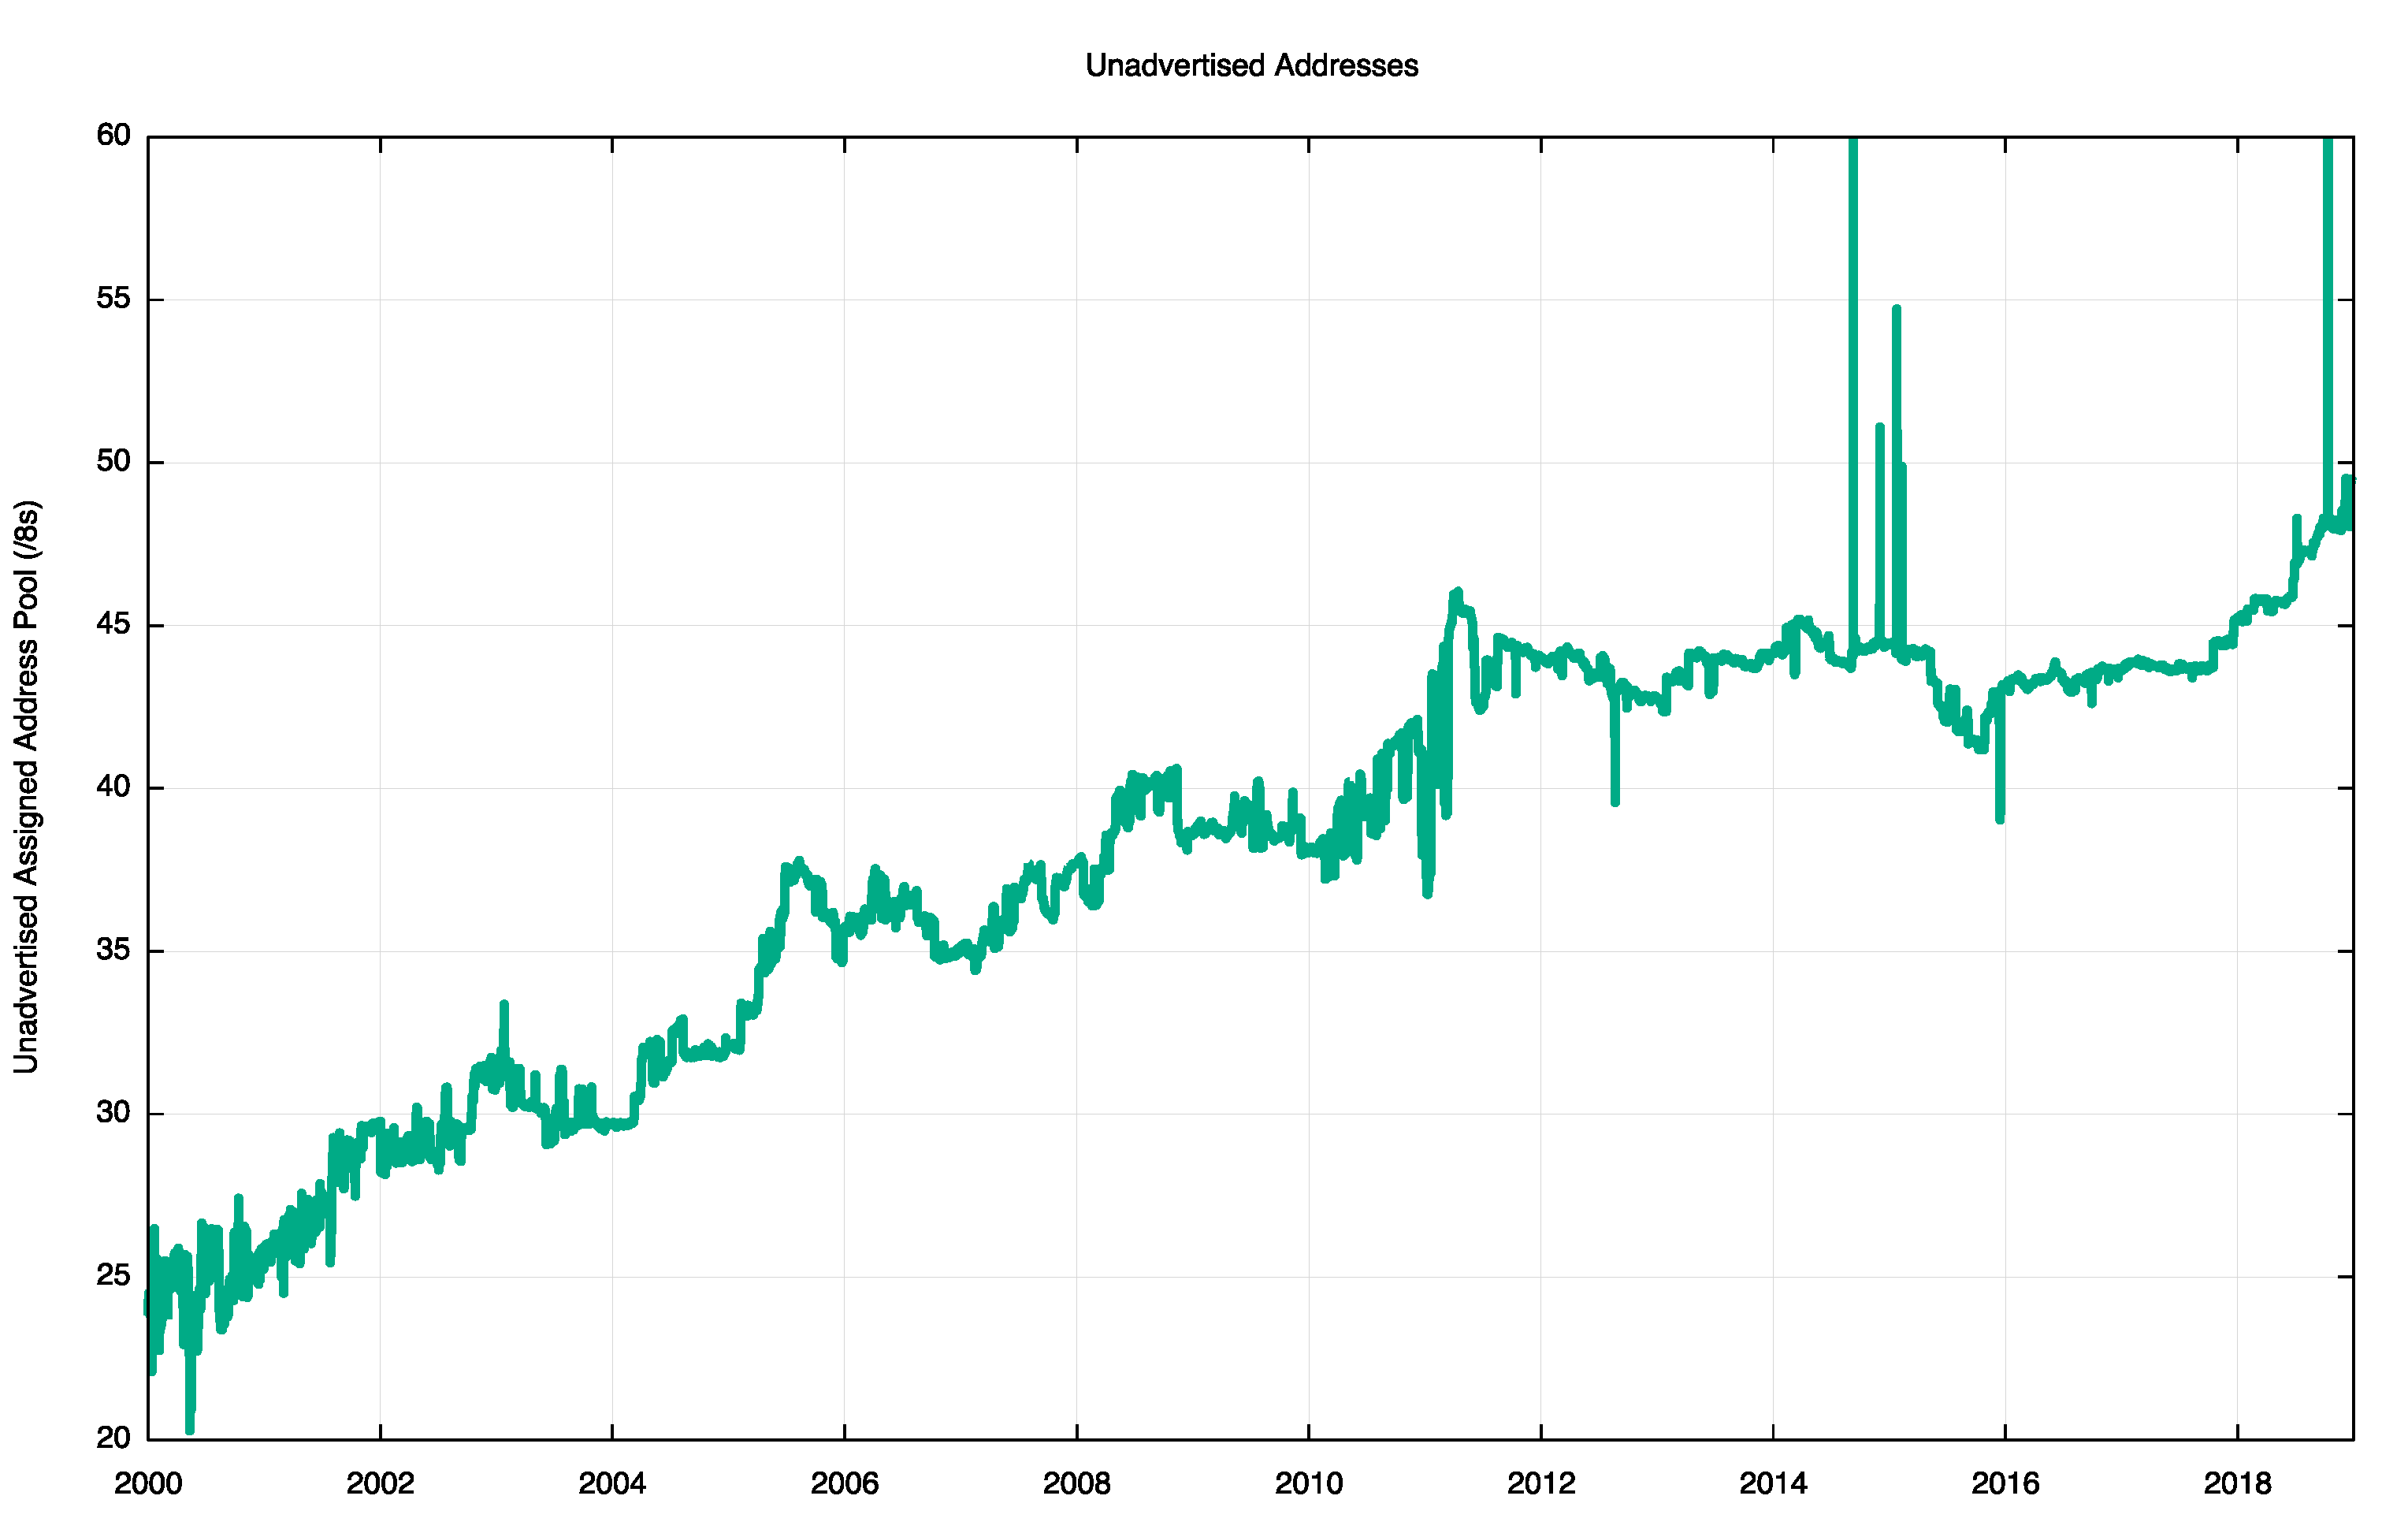
Figure 5 – IPv4 Unadvertised Address Pool Size
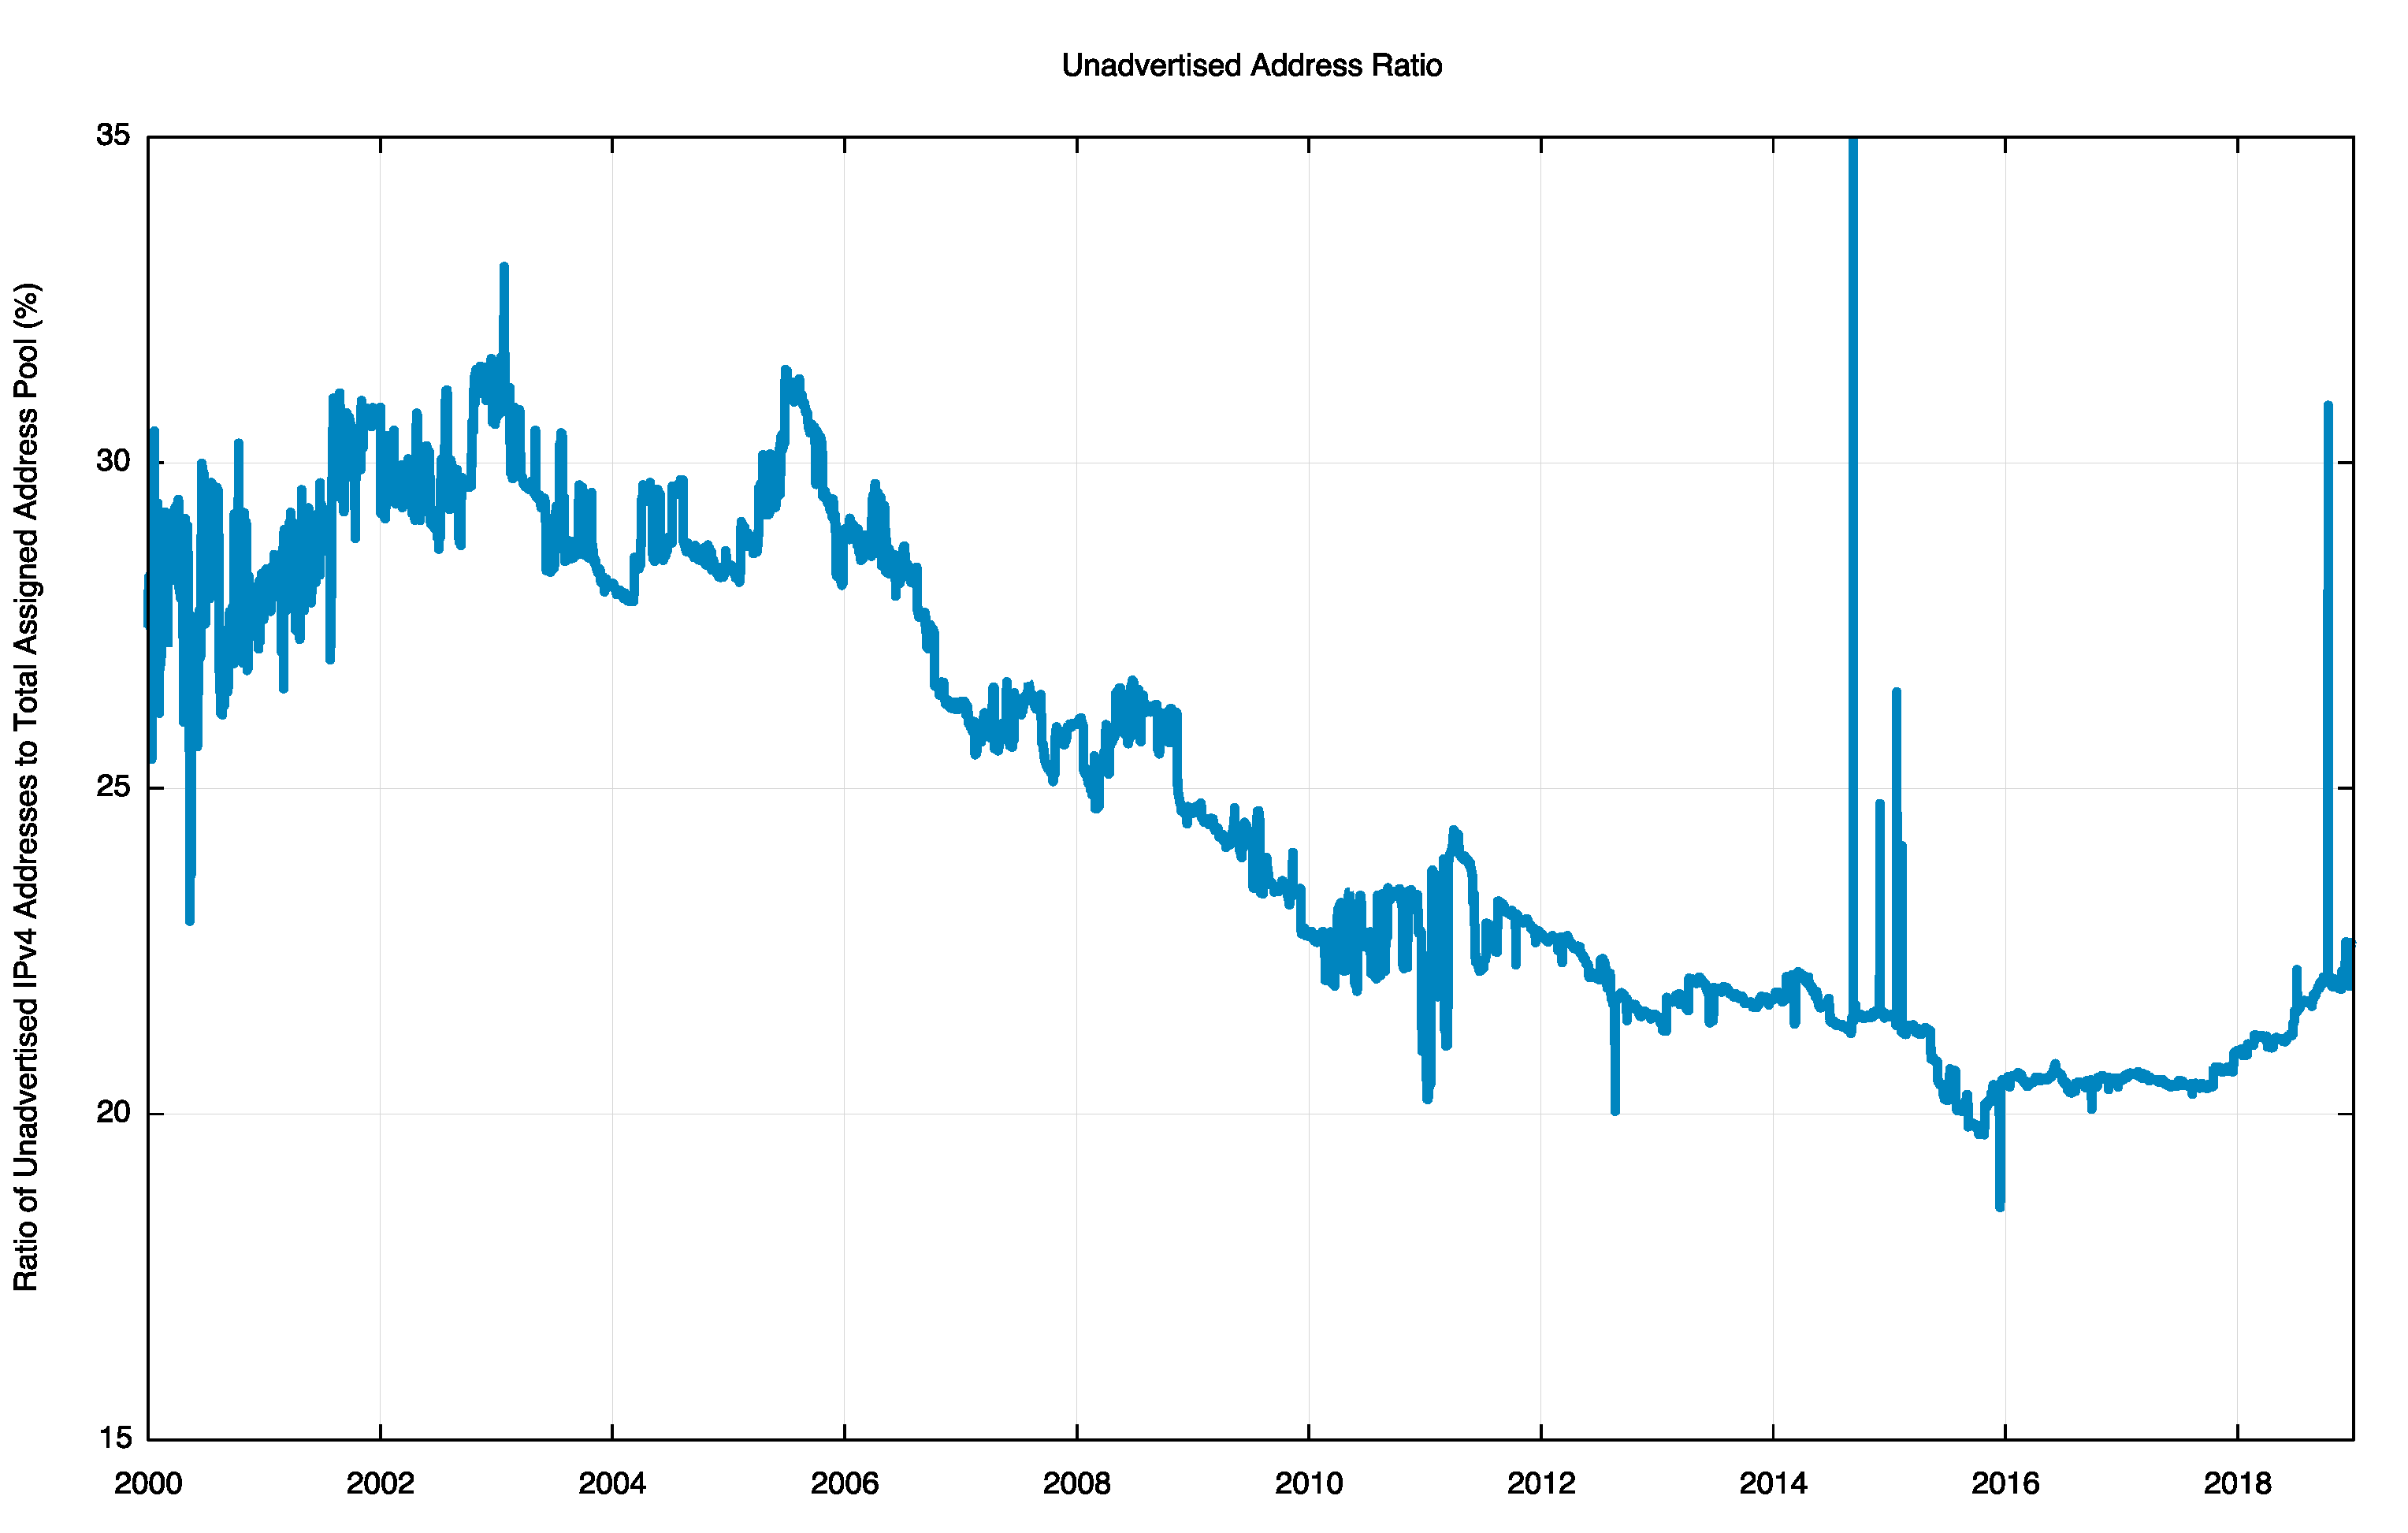
Figure 6 – Ratio of Unadvertised Pool to Total Pool
There is a slightly different aspect to this question, concerning whether the transferred addresses are predominately recently allocated addresses, or longer held address addresses where the holder is wanting to realise otherwise unused assets. The basic question concerns the “age” distribution of transferred addresses where the “age” of an address reflects the period since it was first allocated or assigned by the RIR system.
The cumulative age distribution of transferred addresses is shown on a year-by-year basis in Figure 7. In 2012 some 20% of the transferred address blocks were originally assigned or allocated by an RIR within the previous 5 years. In 2018 the trend had reversed, and some 95% of all transferred addresses were less than 10 years old, and 25% of the transferred addresses were more than 25 years old.
The high volumes of transfer activity associated with legacy addresses has been higher in 2018 than in all previous years.
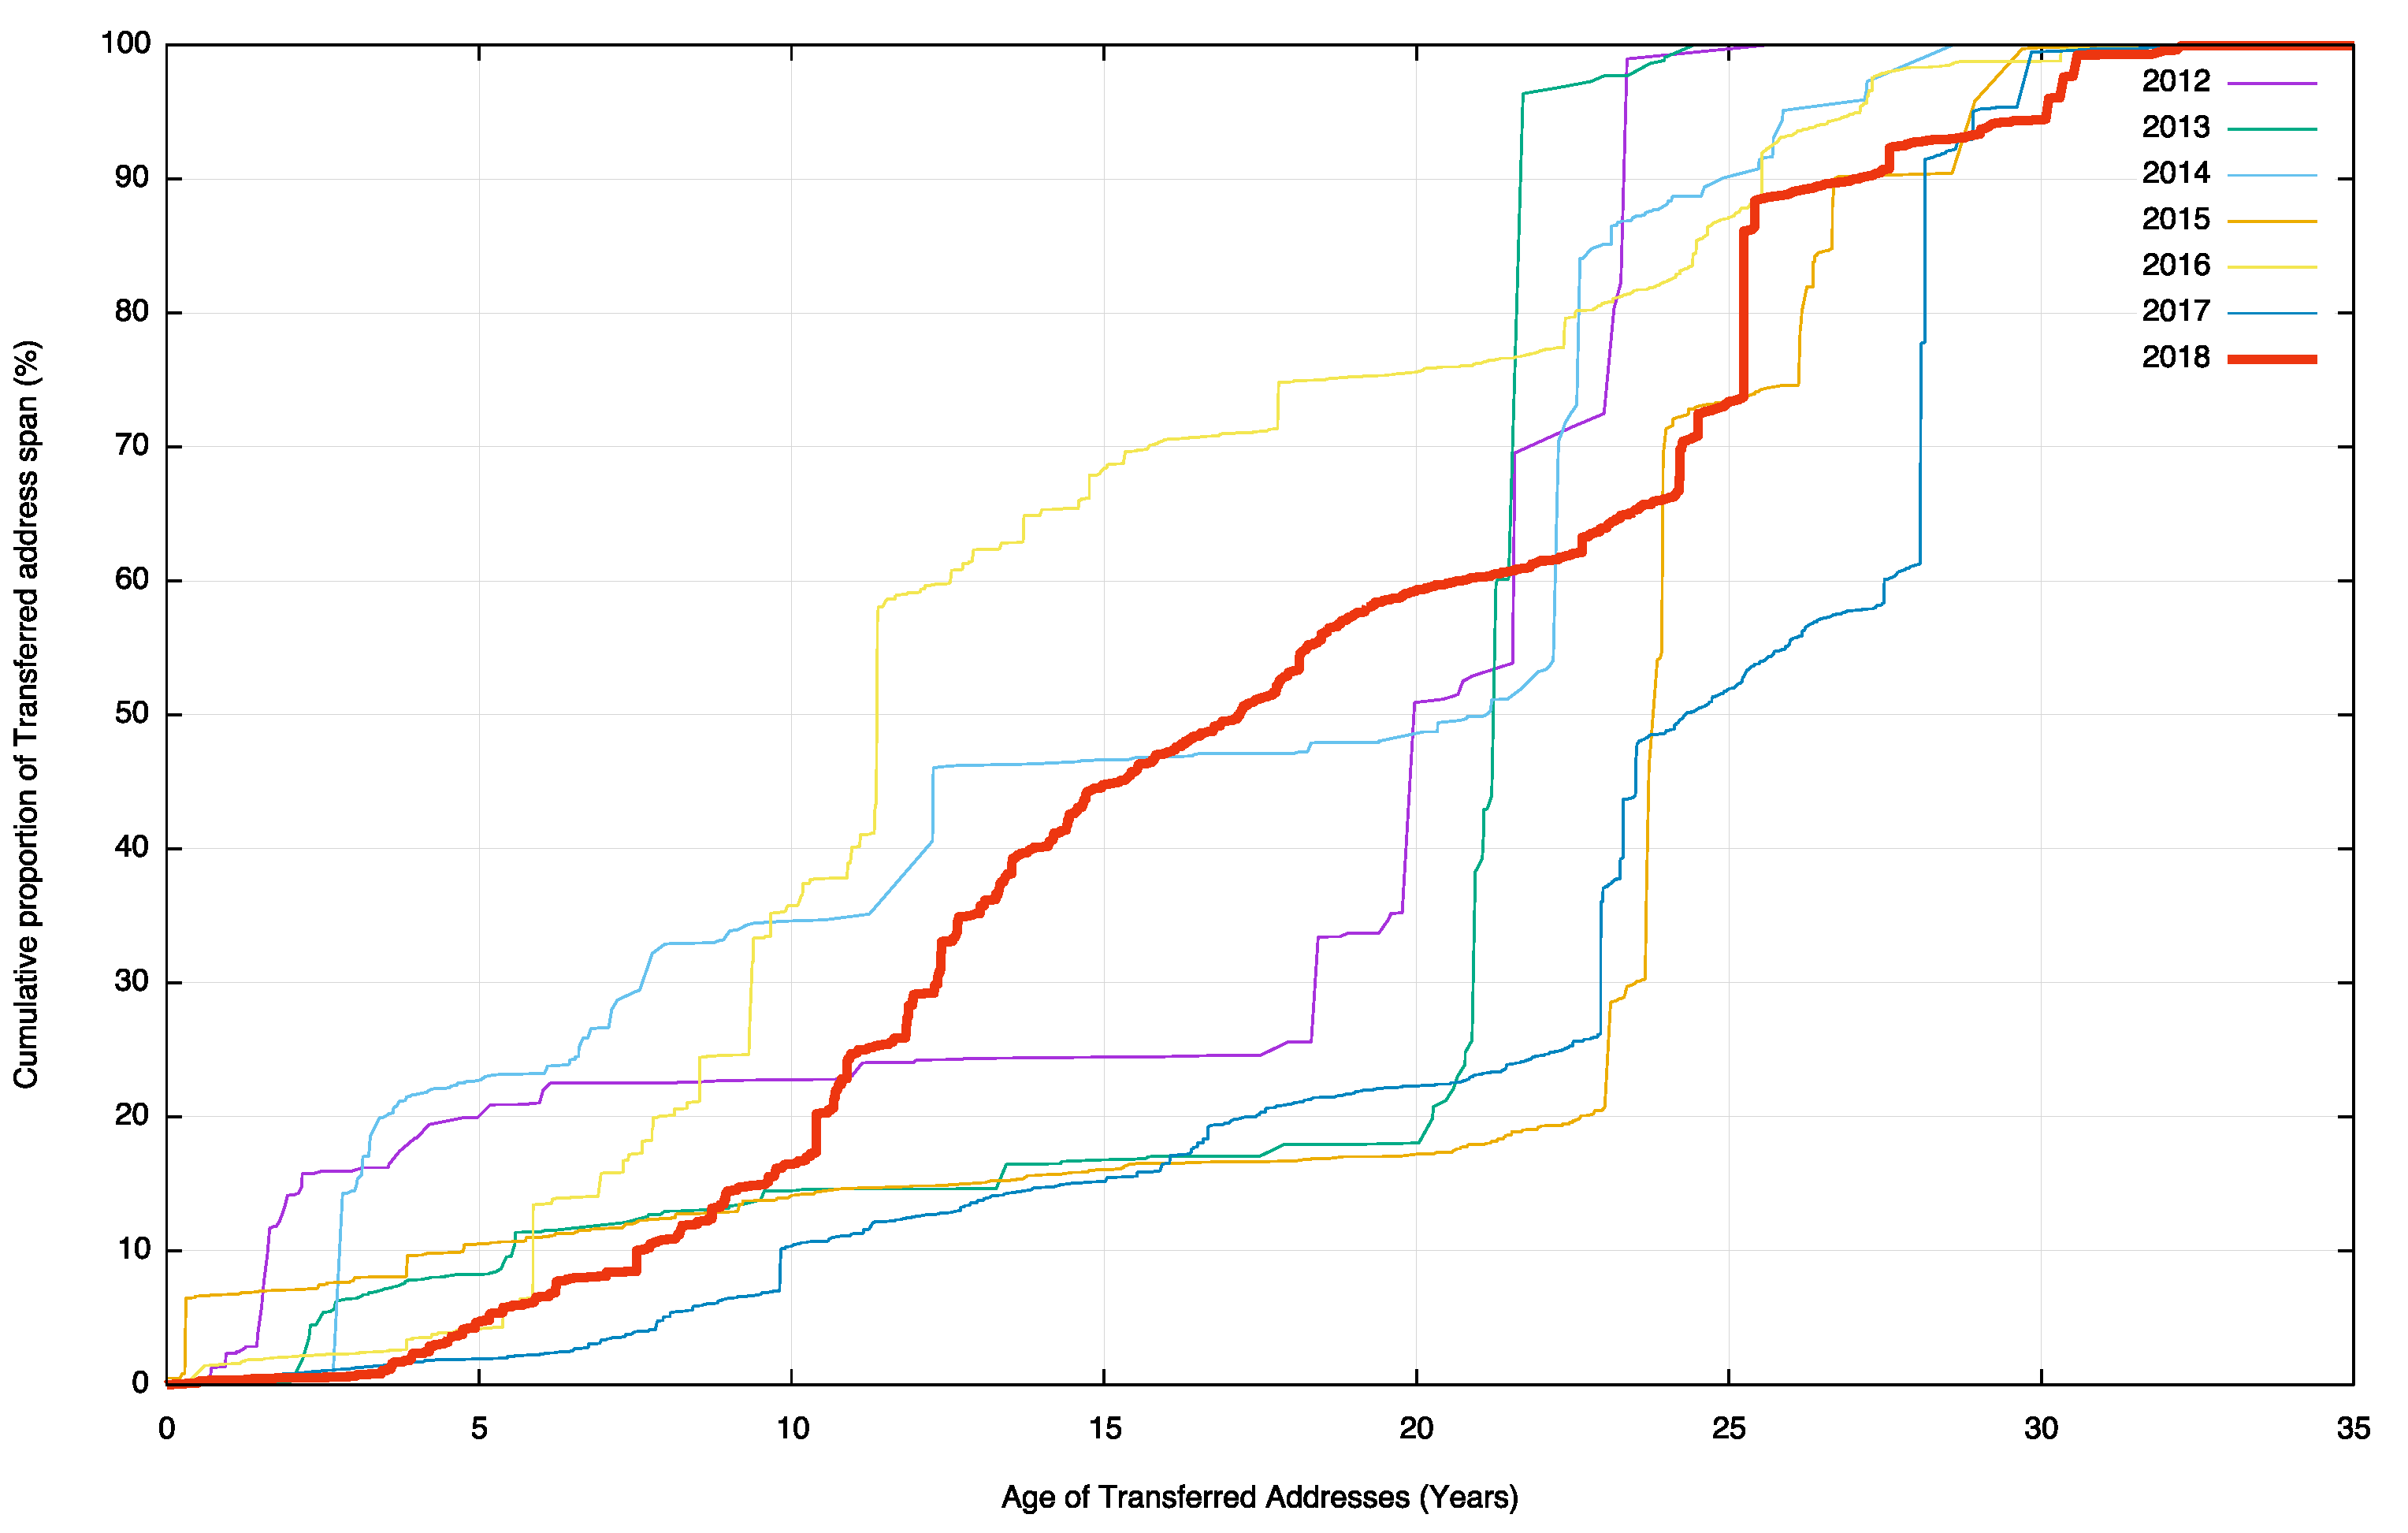
Figure 7 – Age distribution of transferred addresses
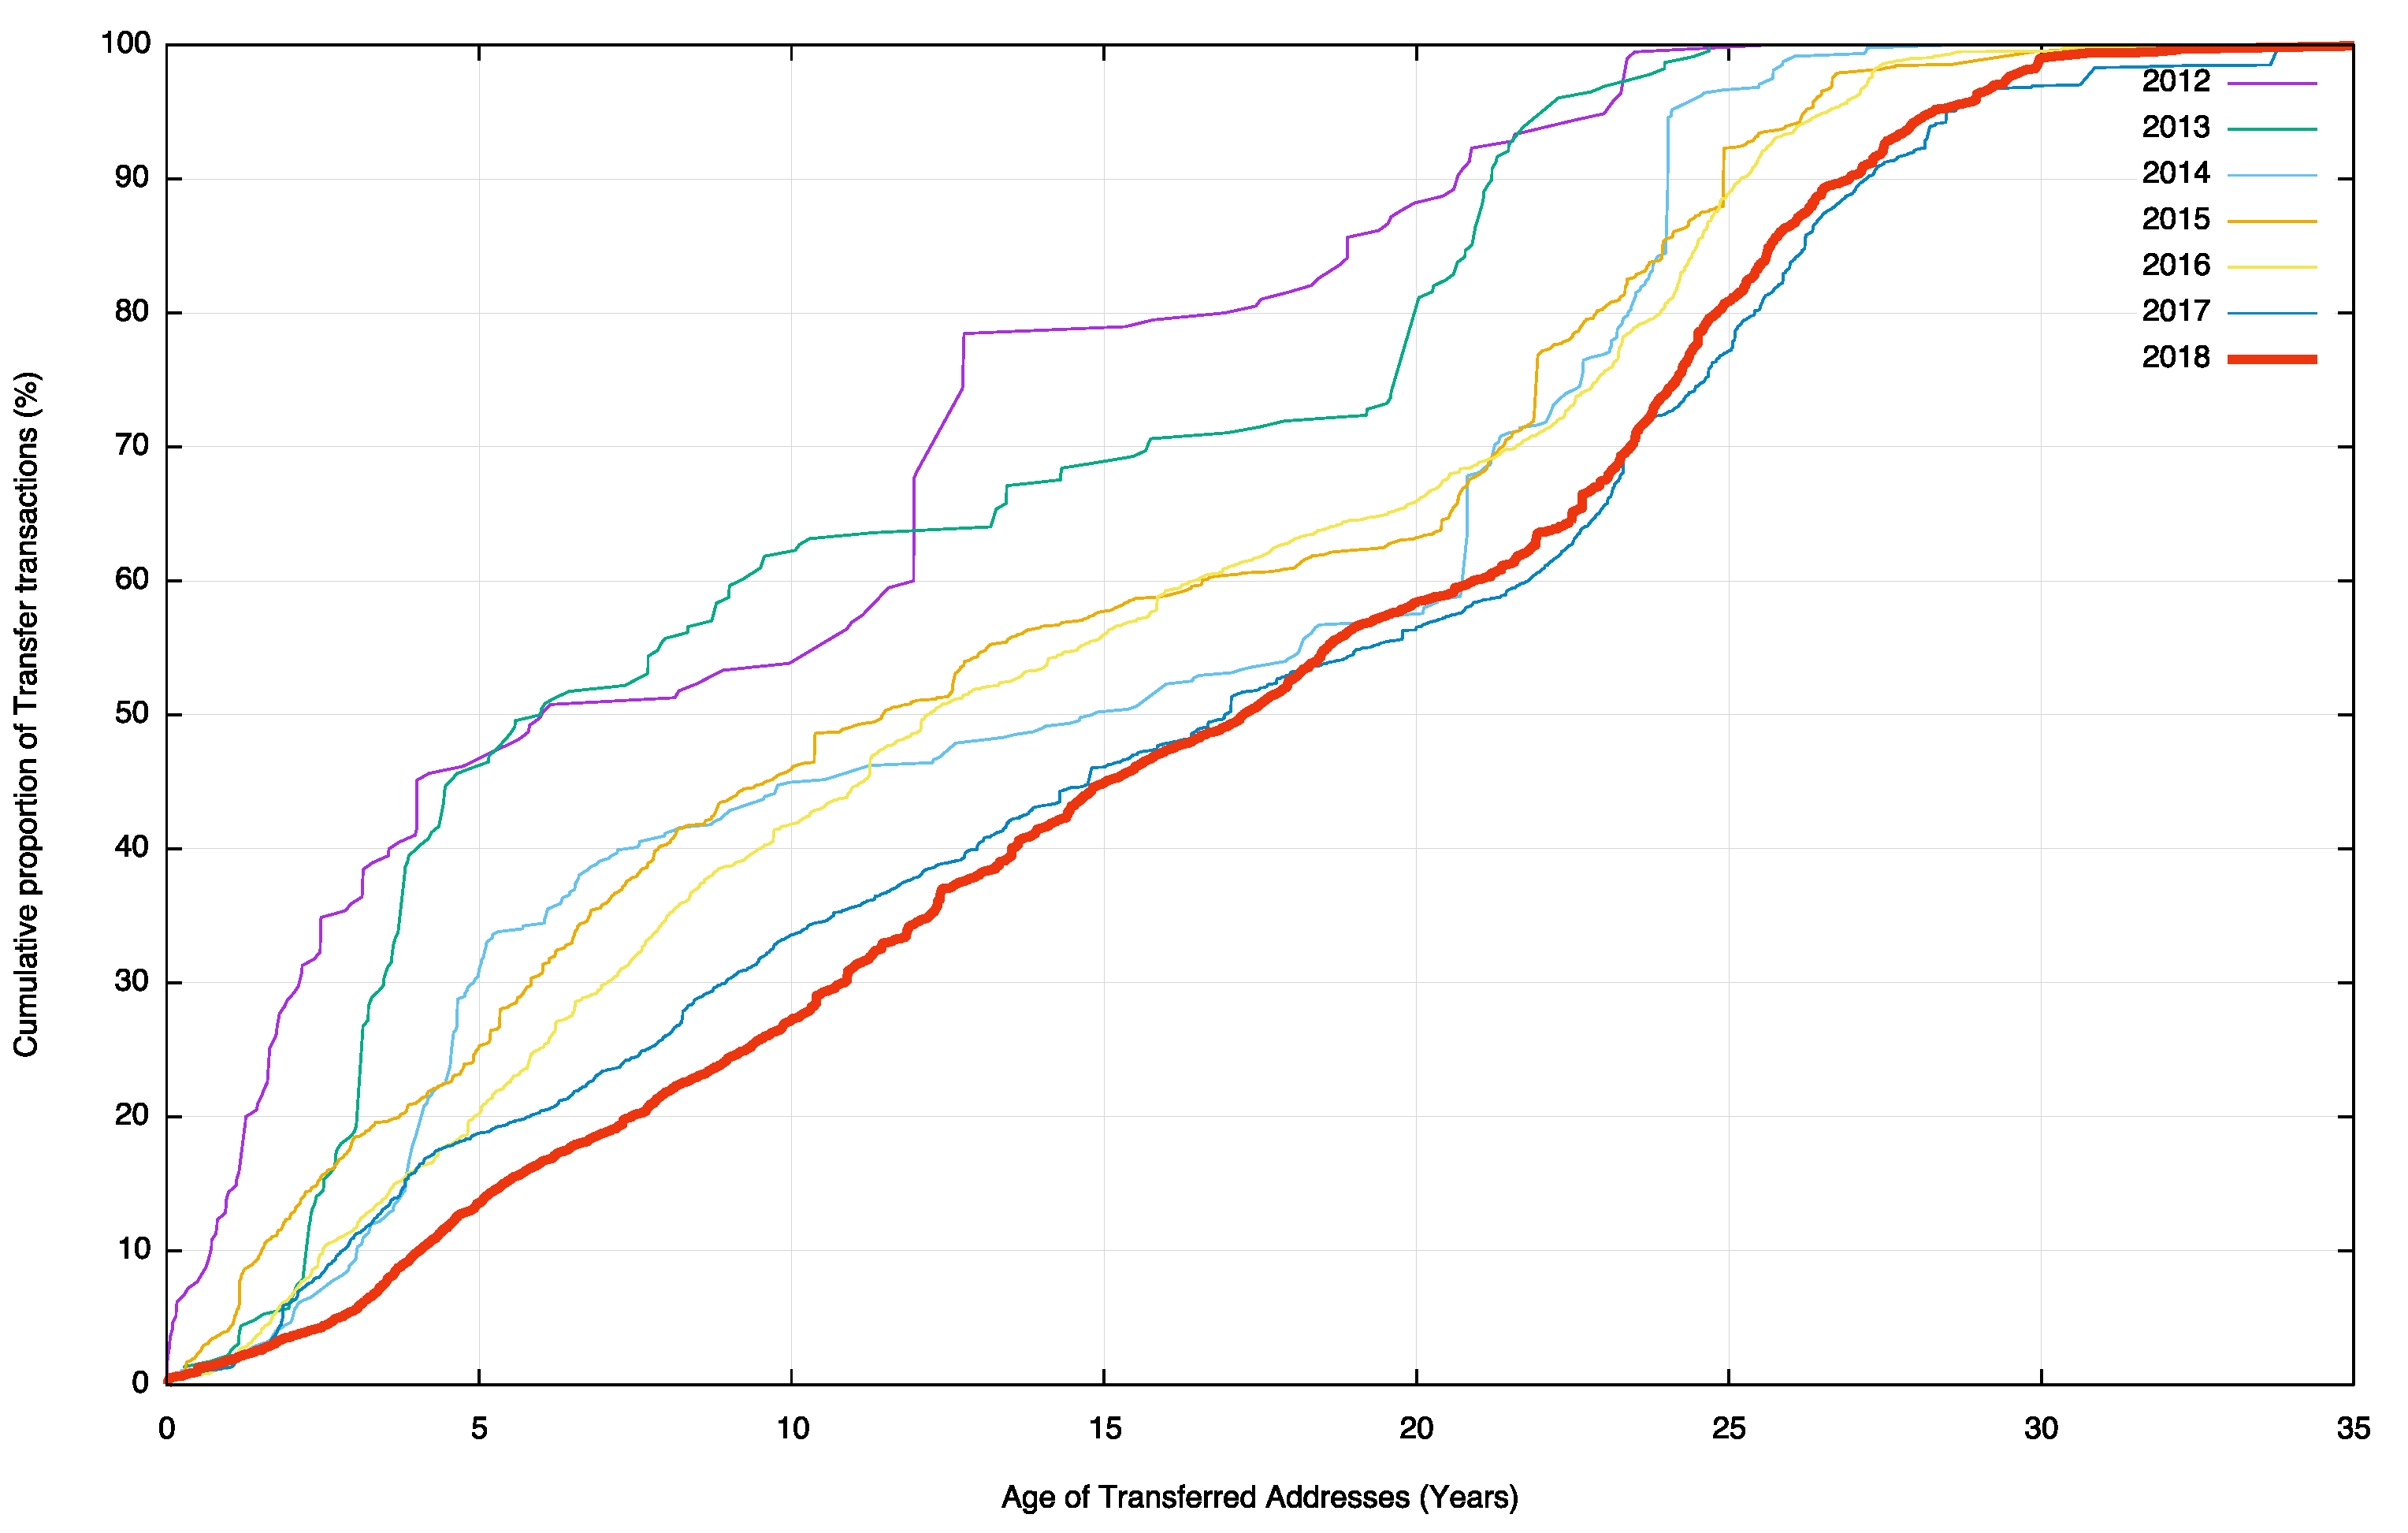
Figure 8 – Age distribution of transfer transactions
If we look at transfer transactions irrespective of the size of each transfer, we get a slightly different picture (Figure 8). In 2018 it appears that transfer transactions are uniformly distributed according to age of the addresses. Previous years have seen a high volume of transactions in recently allocated addresses, but this trading of recently allocated addresses has tapered off in 2017 and 2018. The comparison of Figures 7 and 8 also leads to the observation that the transfers of older address blocks have far larger address spans, which corresponds to the very early IPv4 address allocations of /8 and /16 prefixes.
The second question is whether the transfer process is further fragmenting the address space by splitting up larger address blocks into successively smaller address blocks. There are 27,426 transactions described in the RIRs’ transfer registries up to the end of 2018, and of these 9,809 entries list transferred address blocks that are the same size as the original allocated block. The remaining 17,607 entries are fragments of the originally allocated address blocks.
These 17,607 transfer entries that have fragmented the original allocation are drawn from 2,247 such original allocations. On average the original allocation is split into 8 smaller address blocks. This data implies that the answer to the second question is that address blocks are being fragmented as a result of address transfers, but in absolute terms this is not a major issue. There are some 193,946 distinct address allocations from the RIRs to end entities as of the end of 2018, and the fragmentation reflected in 17,607 of these address blocks is around 9% of the total pool of allocated address prefixes.
The third question concerns the inter-country flow of transferred addresses. Let’s look at the ten countries that sourced the greatest volume of transferred addresses, irrespective of their destination (i.e. including ‘domestic’ transfers within the same country) (Table 6), and the ten largest recipients of transfers (Table 7), and the ten largest country-to-country address transfers (Table 8). We will use the RIR-published transfer data for 2018.
| Rank | CC | Addresses | Country Name |
| 1 | US | 264,240,128 | USA |
| 2 | CA | 2,341,632 | Canada |
| 3 | IN | 1,608,960 | India |
| 4 | CN | 1,249,280 | China |
| 5 | NL | 400,128 | Netherlands |
| 6 | JP | 267,520 | Japan |
| 7 | GB | 205,824 | UK |
| 8 | ZA | 170,240 | South Africa |
| 9 | PR | 134,656 | Puerto Rico |
| 10 | AU | 81,664 | Australia |
Table 6 – Top 10 Countries Sourcing Transferred IPv4 addresses in 2018
| Rank | CC | Addresses | Country Name |
| 1 | US | 262,997,248 | USA |
| 2 | CA | 2,095,872 | Canada |
| 3 | CN | 1,687,552 | China |
| 4 | IN | 1,592,576 | India |
| 5 | NL | 603,136 | Netherlands |
| 6 | JP | 392,192 | Japan |
| 7 | GB | 231,936 | UK |
| 8 | HK | 186,112 | Hong Kong SAR |
| 9 | ZA | 170,240 | South Africa |
| 10 | RO | 148,224 | Romania |
Table 7 – Top 10 Countries Receiving Transferred IPv4 addresses in 2018
| Rank | From | To | Addresses | From | To |
| 1 | US | US | 262,610,688 | USA | USA |
| 2 | CA | CA | 2,000,896 | Canada | Canada |
| 3 | IN | IN | 1,592,576 | India | India |
| 4 | CN | CN | 1,212,416 | China | China |
| 5 | US | CN | 475,136 | USA | China |
| 6 | NL | NL | 396,288 | Netherlands | Netherlands |
| 7 | CA | US | 333,568 | Canada | USA |
| 8 | JP | JP | 253,952 | Japan | Japan |
| 9 | GB | GB | 205,824 | UK | UK |
| 10 | US | NL | 205,824 | USA | Netherlands |
| 11 | ZA | ZA | 170,240 | South Africa | South Africa |
| 12 | US | RO | 147,456 | USA | Romania |
| 13 | US | DE | 141,312 | USA | Germany |
| 14 | US | JP | 135,168 | USA | Japan |
| 15 | PR | PR | 134,656 | Puerto Rico | Puerto Rico |
| 16 | US | CA | 94,976 | USA | Canada |
| 17 | US | HK | 86,016 | USA | Hong Kong SAR |
| 18 | NZ | NZ | 69,632 | New Zealand | New Zealand |
| 19 | BD | BD | 68,096 | Bangladesh | Bangladesh |
| 20 | AU | AU | 66,048 | Australia | Australia |
Table 8 – Top 20 Country-to-Country IPv4 address transfers in 2018
The 2018 transfer logs contain 4,961 domestic address transfers, with a total of 269,090,560 addresses (of which 4,322 are US domestic transfers that encompass 262,610,688 addresses and just 639 are domestic transfers in other countries) while 254 transfers appear to result in a movement of addresses between countries, involving a total of 2,158,336 addresses. It appears that the bulk of the US domestic activity relates to corporate mergers and acquisitions in access networks, although there appear to be a small number of large address blocks that are moving to virtual hosting provider infrastructure.
The total volume of transactions that are recorded in the RIRs’ transfer logs have 13,707 transactions over the 8-year period from the start of 2011, with 576 million IPv4 addresses changing hands in this manner. This eight-year total represents far less activity than the underlying pre-exhaustion address demand levels that allocated some 600 million addresses in the three years leading to the 2011 IPv4 exhaustion point.
It appears that the IPv4 address supply hiatus has motivated most Internet service providers to use address sharing technologies, and, in particular, Carrier Grade NAT (CGN), on the access side and name-based server pooling on the content side as a means of increasing the level of sharing of addresses. This has been accompanied by a universal shift of the architecture of the Internet to a client/server model. The result is that the pressure of the IPv4 address space has been relieved to a considerable extent, and the sense of urgency to migrate to an all-IPv6 network has been largely, but not completely, mitigated over this period.
The outstanding question about this transfer data is whether all address transfers that have occurred have been duly recorded in the registry system. This question is raised because registered transfers require conformance to various registry policies, and it may be the case that only a subset of transfers are being recorded in the registry as a result. This can be somewhat challenging to detect, particularly if such a transfer is expressed as a lease or other form of temporary arrangement, and if the parties agree to keep the details of the transfer confidential.
It might be possible to place an upper bound on the volume of address movements that have occurred in any period is to look at the Internet’s routing system. One way to shed some further light on what this upper bound on transfers might be is through a simple examination of the routing system, looking at addresses that were announced in 2018 by comparing the routing stable state at the start of the year with the table state at the end of the year (Table 9).
| Jan-18 | Jan-19 | Delta | Unchanged | Re-Home | Removed | Added | ||
| Announcements | 698,681 | 759,736 | 61,055 | 604,874 | 19,866 | 72,373 | 133,629 | |
| Root Prefixes: | 332,488 | 356,159 | 23,671 | 293,771 | 11,663 | 24,579 | 46,974 | |
| Address Span (/8s) | 160.87 | 162.06 | 1.20 | 152.91 | 2.21 | 1.79 | -0.90 | |
| More Specifics: | 366,193 | 403,777 | 37,584 | 311,103 | 8,203 | 47,794 | 83,865 | |
| Address Span (/8s) | 57.37 | 60.52 | 3.14 | 51.55 | 1.20 | 4.17 | 7.69 |
Table 9 – IPv4 BGP changes over 2018
While the routing table grew by 61,055 entries over the year, the nature of the change is slightly more involved. Some 72,373 prefixes that were announced at the start of the year were removed from the routing system through the year, and 133,629 prefixes were announced by the end of the year that were not announced at the start of the year. (Within the scope of this study I have not tracked the progress of announcements through the year, and it is likely that many more prefixes were announced and removed on a transient basis through the course of the year.) A further 19,866 prefixes had changed their originating Autonomous System number, indicating some form of change in the prefix’s network location in some manner (Table 9).
We can compare these changed prefixes against the transfer logs for the two-year period 2017 and 2018. Table 10 shows the comparison of these routing numbers against the set of transfers that were logged in these two years.
| Type | Listed as Transferred | Unlisted | Ratio |
| Re-Homed | |||
| All | 4,350 | 15,516 | 21.90% |
| Root Prefixes | 3111 | 8404 | 27.02% |
| Removed | |||
| All | 11,832 | 60,541 | 16.35% |
| Root Prefixes | 5,307 | 19,272 | 21.59% |
| Added | All | 17,819 | 115,810 | 13.33% | Root Prefixes | 9,546 | 40,218 | 19.18% |
Table 10 – Routing changes across 2018 compared to the Transfer Logs
These figures show that some 13-27% of changes in advertised addresses are reflected as changes as recorded in the RIRs’ transfer logs. This should not imply that the remaining changes in advertised prefixes reflect unrecorded address transfers. There are many reasons for changes in the advertisement of an address prefix and a change in the administrative controller of the address is only one potential cause. However, it does establish some notional upper ceiling on the number of movements of addresses in 2017, some of which relate to transfer of operational control of an address block, that have not been captured in the transfer logs.
Finally, we can perform an age profile of the addresses that were added, removed and re-homed during 2018, and compare it to the overall age profile of IPv4 addresses in the routing table. This is shown in Figure 9. In terms of addresses that were added in 2017, they differ from the average profile due to a skew in favour of “recent” addresses, and 20% of all announced addresses were allocated or assigned in the past 18 months. In terms of addresses that were removed from the routing system, there is a disproportionate volume of removed addresses that are between 2 and 10 years old. 20% of removed addresses are more than 20 years old, where almost 70% of all advertised addresses are more than 20 years old. Addresses that re-home appear to be disproportionally represented in the age bracket of between 7 to 15 years old.
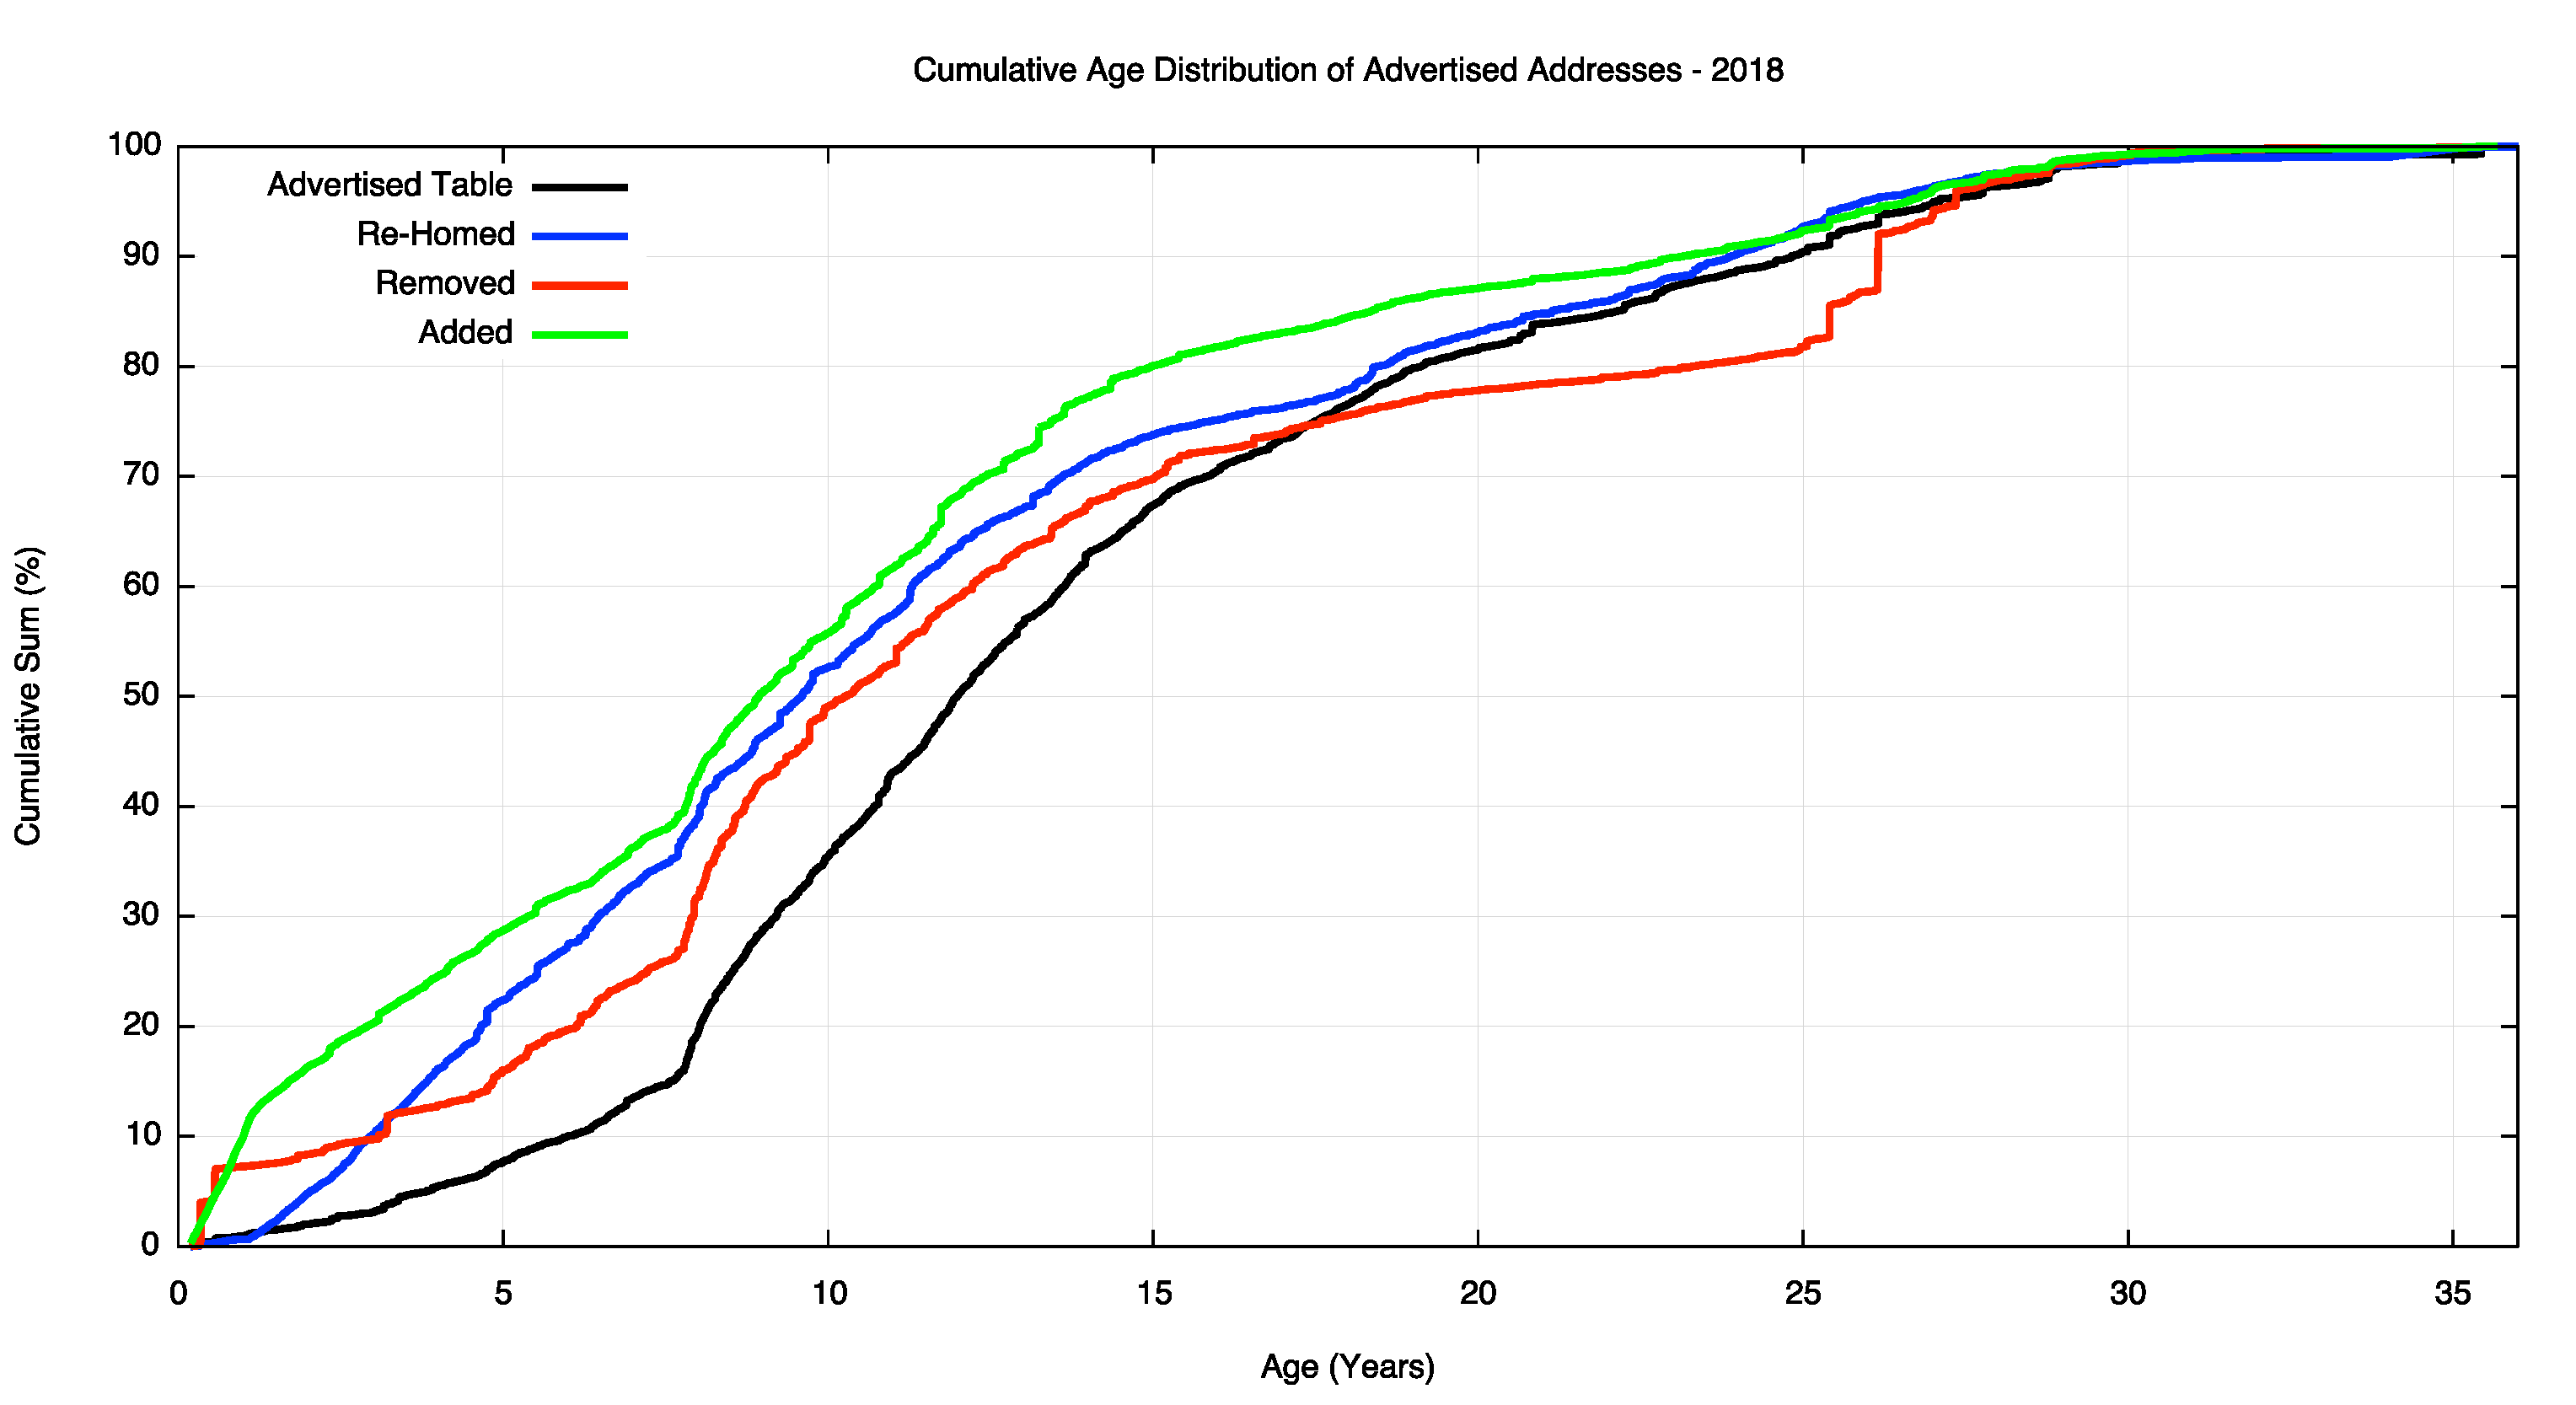
Figure 9 – Change in the size of the BGP routing table across 2018
However, as IPv4 moves into its final stages we are perhaps now in a position to take stock of the overall distribution of IPv4 addresses and look at where the addresses landed up. Table 11 shows the ten countries that have the largest pools of allocated IPv4 addresses.
| Rank | CC | IPv4 Pool | % of Total | Per-Capita | Economy |
| 1 | US | 1,605,172,480 | 43.73 | 4.87 | USA |
| 2 | CN | 340,413,440 | 9.27 | 0.24 | China |
| 3 | JP | 204,215,552 | 5.56 | 1.61 | Japan |
| 4 | DE | 122,540,160 | 3.33 | 1.48 | Germany |
| 5 | GB | 122,408,472 | 3.33 | 1.82 | UK |
| 6 | KR | 112,459,264 | 3.06 | 2.19 | Rep. Korea |
| 7 | BR | 85,144,064 | 2.31 | 0.40 | Brazil |
| 8 | FR | 82,833,712 | 2.25 | 1.26 | France |
| 9 | CA | 70,349,824 | 1.91 | 1.88 | Canada |
| 10 | IT | 54,974,528 | 1.49 | 0.92 | Italy |
Table 11 – IPv4 Allocated Address Pools per National Economy
If we divide this address pool by the current population of each national entity, then we can derive an address per capita index. For the curious, the value of just under 5 addresses per capita for the United States is not quite the highest value, as the numbers for the Seychelles and the Holy See are far higher! But they are high by virtue of their relatively small population rather than vast address holdings. The global total of 3.67 billion allocated addresses with an estimated global population of 7.7 billion people gives an overall value of 0.47 IPv4 addresses per capita. It appears that early adopter communities tend to have high than average per capita values, while later adopters tend to fall below the global average. The full table of IPv4 allocations per national economy can be found here.
IPv6 in 2018
Obviously, the story of IPv4 address allocations is only half of the story, and to complete the picture it’s necessary to look at how IPv6 has fared over 2018.
IPv6 uses a somewhat different address allocation methodology than IPv4, and it is a matter of choice for a service provider as to how large an IPv6 address prefix is assigned to each customer. The original recommendations published by the IAB and IESG in 2001, documented in RFC3177, envisaged the general use of a /48 as an end site prefix. Subsequent consideration of long term address conservation saw a more flexible approach being taken with the choice of the end site prefix size being left to the service provider. Today's IPv6 environment has some providers using a /60 end site allocation unit, many use a /56, and other providers use a /48. This variation makes a comparison of the count of allocated IPv6 addresses somewhat misleading, as an ISP using /48's for end sites will require 256 times more address space to accommodate a similarly sized same customer base as a provider who uses a /56 end site prefix, and 4,096 times more address space than an ISP using a /60 end site allocation!
For IPv6 let's use both the number of discrete IPv6 allocations and the total amount of space that was allocated to see how IPv6 fared in 2017.
Comparing 2017 to 2018 the number of individual allocations of IPv6 address space has risen, as has IPv4 activity (Table 12).
| Allocations | 2008 | 2009 | 2010 | 2011 | 2012 | 2013 | 2014 | 2015 | 2016 | 2017 | 2018 |
| IPv6 | 841 | 1,243 | 2,477 | 3,700 | 3,403 | 3,840 | 4,407 | 4,733 | 5,594 | 5,765 | 6,309 |
| IPv4 | 6,969 | 6,701 | 7,758 | 10,061 | 8,619 | 7,110 | 10,853 | 11,732 | 9,787 | 9,440 | 10,199 |
Table 12 - Number of individual Address Allocations, 2007 - 2018
The amount of IPv6 address space distributed in 2018 is double that of 2017 and is the highest seen so far (Table 13).
| Addresses | 2008 | 2009 | 2010 | 2011 | 2012 | 2013 | 2014 | 2015 | 2016 | 2017 | 2018 |
| IPv6 (/32s) | 15,634 | 1,555 | 4,754 | 20,009 | 18,136 | 23,935 | 17,513 | 20,225 | 25,301 | 19,986 | 39,256 |
| IPv4 (/32s)(M) | 203.3 | 189.4 | 248.8 | 201.0 | 114.9 | 65.1 | 63.9 | 34.8 | 22.2 | 51.9 | 50.7 |
Table 13 – Volume of Address Allocations, 2007 - 2018
Regionally, each of the RIRs saw IPv6 allocation activity in 2018 that was on a par with those seen in the previous year, with the exception of the RIPE NCC, which saw a 30% increase in allocations (Table 14).
| Allocations | 2008 | 2009 | 2010 | 2011 | 2012 | 2013 | 2014 | 2015 | 2016 | 2017 | 2018 |
| RIPE NCC | 413 | 595 | 1,012 | 1,565 | 1,661 | 2,057 | 2,143 | 2,206 | 2,141 | 2,051 | 2,617 |
| ARIN | 213 | 357 | 567 | 959 | 545 | 523 | 505 | 602 | 646 | 684 | 658 |
| APNIC | 158 | 185 | 637 | 610 | 561 | 505 | 503 | 778 | 1,681 | 1,369 | 1,474 |
| LACNIC | 43 | 93 | 212 | 447 | 560 | 683 | 1,196 | 1,061 | 1,010 | 1,549 | 1,450 |
| AFRINIC | 14 | 13 | 49 | 119 | 76 | 72 | 60 | 86 | 116 | 112 | 110 |
| Total | 841 | 1,243 | 2,477 | 3,700 | 3,403 | 3,840 | 4,407 | 4,733 | 5,594 | 5,765 | 6,309 |
Table 14 - IPv6 allocations by RIR
The address assignment data tells a slightly different story. Table 15 shows the number of allocated IPv6 /32's per year. APNIC allocated a larger total in 2018, as a consequence of four large allocations: a /19, 2 /20’s and a /22 into China, and a /22 into Singapore.
| IPv6 (/32s) | 2008 | 2009 | 2010 | 2011 | 2012 | 2013 | 2014 | 2015 | 2016 | 2017 | 2018 |
| RIPE NCC | 964 | 1,052 | 2,406 | 3,174 | 3,892 | 6,286 | 8,217 | 12,031 | 21,707 | 12,844 | 17,311 |
| ARIN | 14,486 | 236 | 780 | 6,344 | 1,660 | 12,558 | 5,241 | 641 | 1,088 | 1,372 | 845 |
| APNIC | 139 | 170 | 1,335 | 9,486 | 3,783 | 4,442 | 2,644 | 2,109 | 1,236 | 4,228 | 19,690 |
| LACNIC | 35 | 87 | 197 | 948 | 4,605 | 597 | 1,359 | 974 | 1,182 | 1,429 | 1,338 |
| AFRINIC | 10 | 9 | 36 | 147 | 4,196 | 51 | 51 | 4,471 | 78 | 113 | 72 |
| Total | 15,634 | 1,555 | 4,754 | 20,099 | 18,136 | 23,935 | 17,513 | 20,225 | 25,301 | 19,986 | 39,256 |
Table 15 - IPv6 address allocation volumes by RIR
Dividing addresses by allocations gives the average IPv6 allocation size in each region (Table 16). APNIC average allocations increase in size due to the large allocations already noted. Overall, the average IPv6 allocation size remains around a /30.
| Average Allocation | 2008 | 2009 | 2010 | 2011 | 2012 | 2013 | 2014 | 2015 | 2016 | 2017 | 2018 |
| RIPE NCC | /30.8 | /31.2 | /30.8 | /31.0 | /30.8 | /30.4 | /30.1 | /29.6 | /28.7 | /29.4 | /29.3 |
| ARIN | /25.9 | /32.6 | /31.5 | /29.3 | /30.4 | /27.4 | /28.6 | /31.9 | /31.2 | /31.0 | /31.6 |
| APNIC | /32.2 | /32.1 | /30.9 | /28.0 | /29.2 | /28.9 | /29.6 | /30.6 | /32.4 | /30.4 | /28.2 |
| LACNIC | /32.3 | /32.1 | /32.1 | /30.9 | /29.0 | /32.2 | /31.8 | /32.1 | /31.8 | /32.1 | /32.1 |
| AFRINIC | /32.5 | /32.5 | /32.4 | /31.7 | /26.2 | /32.5 | /32.2 | /26.3 | /32.6 | /32.0 | /32.6 |
| All | /27.8 | /31.7 | /31.1 | /29.6 | /29.6 | /29.4 | /30.0 | /29.9 | /29.8 | /30.2 | /29.3 |
Table 16 – Average IPv6 address allocation size by RIR
The number and volume of IPv6 allocations per RIR per year is shown in Figures 10 and 11.
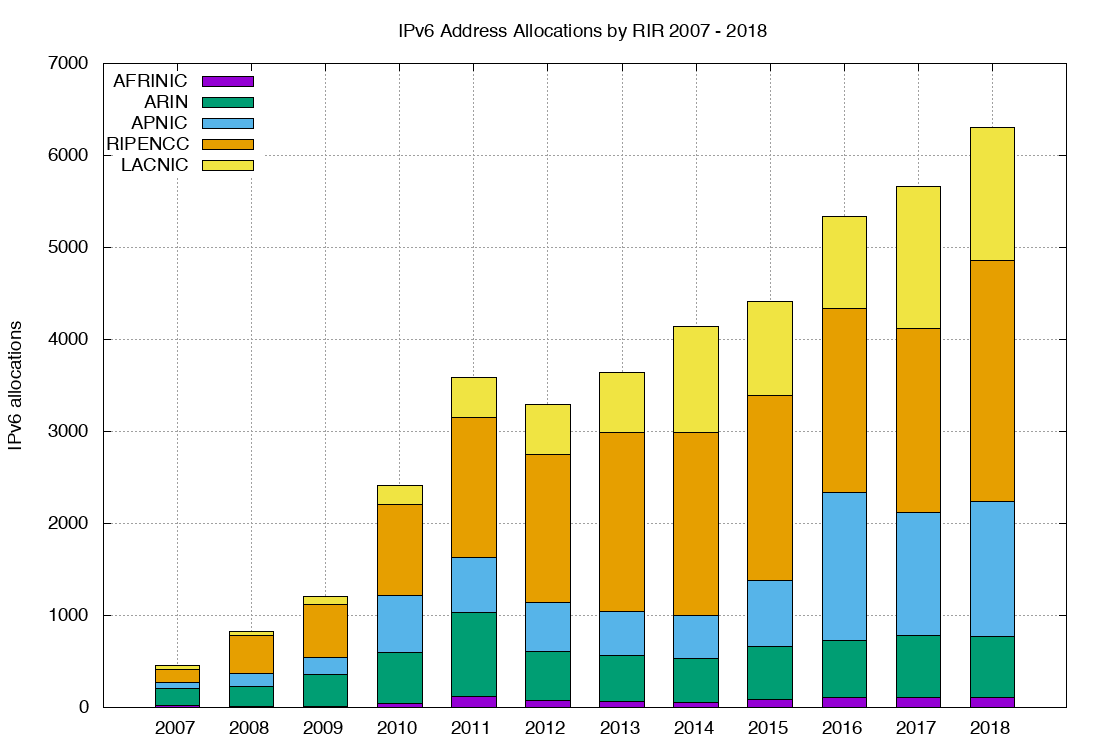
Figure 10 – Number of IPv6 Allocations per year
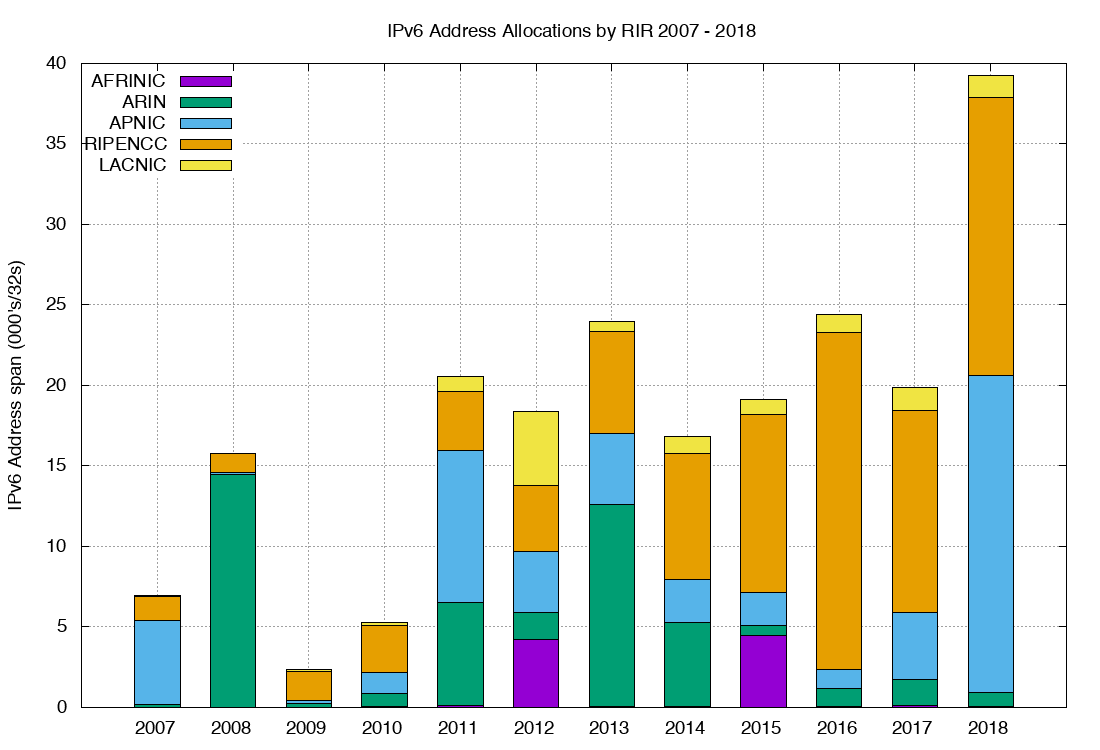
Figure 11 – Volume of IPv6 Allocations per year
| Rank | 2014 | 2015 | 2016 | 2017 | 2018 | |||||
| 1 | Brazil | 946 | Brazil | 815 | Brazil | 774 | Brazil | 1,114 | Brazil | 1,049 |
| 2 | USA | 457 | USA | 540 | USA | 603 | USA | 635 | Russia | 635 |
| 3 | UK | 239 | China | 267 | China | 509 | Germany | 270 | USA | 594 |
| 4 | Germany | 215 | Germany | 249 | Germany | 266 | Russia | 220 | Germany | 308 |
| 5 | Russia | 201 | UK | 216 | Australia | 219 | Australia | 211 | China | 253 |
| 6 | Netherlands | 181 | Russia | 183 | UK | 211 | China | 208 | Indonesia | 213 |
| 7 | France | 122 | Netherlands | 170 | Netherlands | 198 | Netherlands | 194 | UK | 184 |
| 8 | Switzerland | 103 | Australia | 123 | Russia | 173 | UK | 190 | Bangladesh | 183 |
| 9 | Italy | 103 | Spain | 119 | India | 161 | Indonesia | 187 | India | 168 |
| 10 | Australia | 101 | France | 116 | Indonesia | 159 | Argentina | 178 | Netherlands | 162 |
Table 17 - IPv6 allocations by Economy
Table 17 shows the countries who received the largest number of IPv6 allocations, while Table 18 shows the amount of IPv6 address space assigned on a per economy basis for the past 5 years (using units of /32s).
| Rank | 2014 | 2015 | 2016 | 2017 | 2018 | |||||
| 1 | USA | 4,930 | South Africa | 4,440 | UK | 9,571 | China | 2,245 | China | 17,647 |
| 2 | China | 2,127 | China | 1,797 | Germany | 1,525 | USA | 1,498 | Russia | 4,651 |
| 3 | UK | 1,090 | UK | 1,297 | Netherlands | 1,312 | Germany | 1,364 | Germany | 1,932 |
| 4 | Brazil | 863 | Germany | 1,269 | USA | 1,137 | Russia | 1,358 | UK | 1,209 |
| 5 | Germany | 749 | Netherlands | 1,010 | Russia | 1,005 | Netherlands | 1,296 | Singapore | 1,055 |
| 6 | Netherlands | 719 | Russia | 864 | France | 926 | Spain | 1,170 | Netherlands | 1,025 |
| 7 | Russia | 716 | Brazil | 755 | Brazil | 727 | India | 1,087 | Brazil | 1,007 |
| 8 | France | 436 | Spain | 708 | Spain | 702 | UK | 1,072 | USA | 874 |
| 9 | Italy | 410 | Italy | 707 | Italy | 679 | Brazil | 1,049 | Spain | 851 |
| 10 | Switzerland | 369 | USA | 662 | China | 596 | France | 714 | France | 722 |
Table 18 - IPv6 Address Allocation Volumes by Economy (/32s)
Two of the countries in Table 18 listed as having received the highest volumes of allocated addresses in 2018, namely Russia and Spain, have IPv6 deployments that are under 5% of their total user population. To what extent are allocated IPv6 addresses visible as advertised prefixes in the Internet’s routing table?
Figure 12 shows the overall counts of advertised, unadvertised and total allocated address volume for IPv6 since 2010, while Figure 13 shows the advertised address span as a percentage of the total span of allocated and assigned IPv6 addresses.
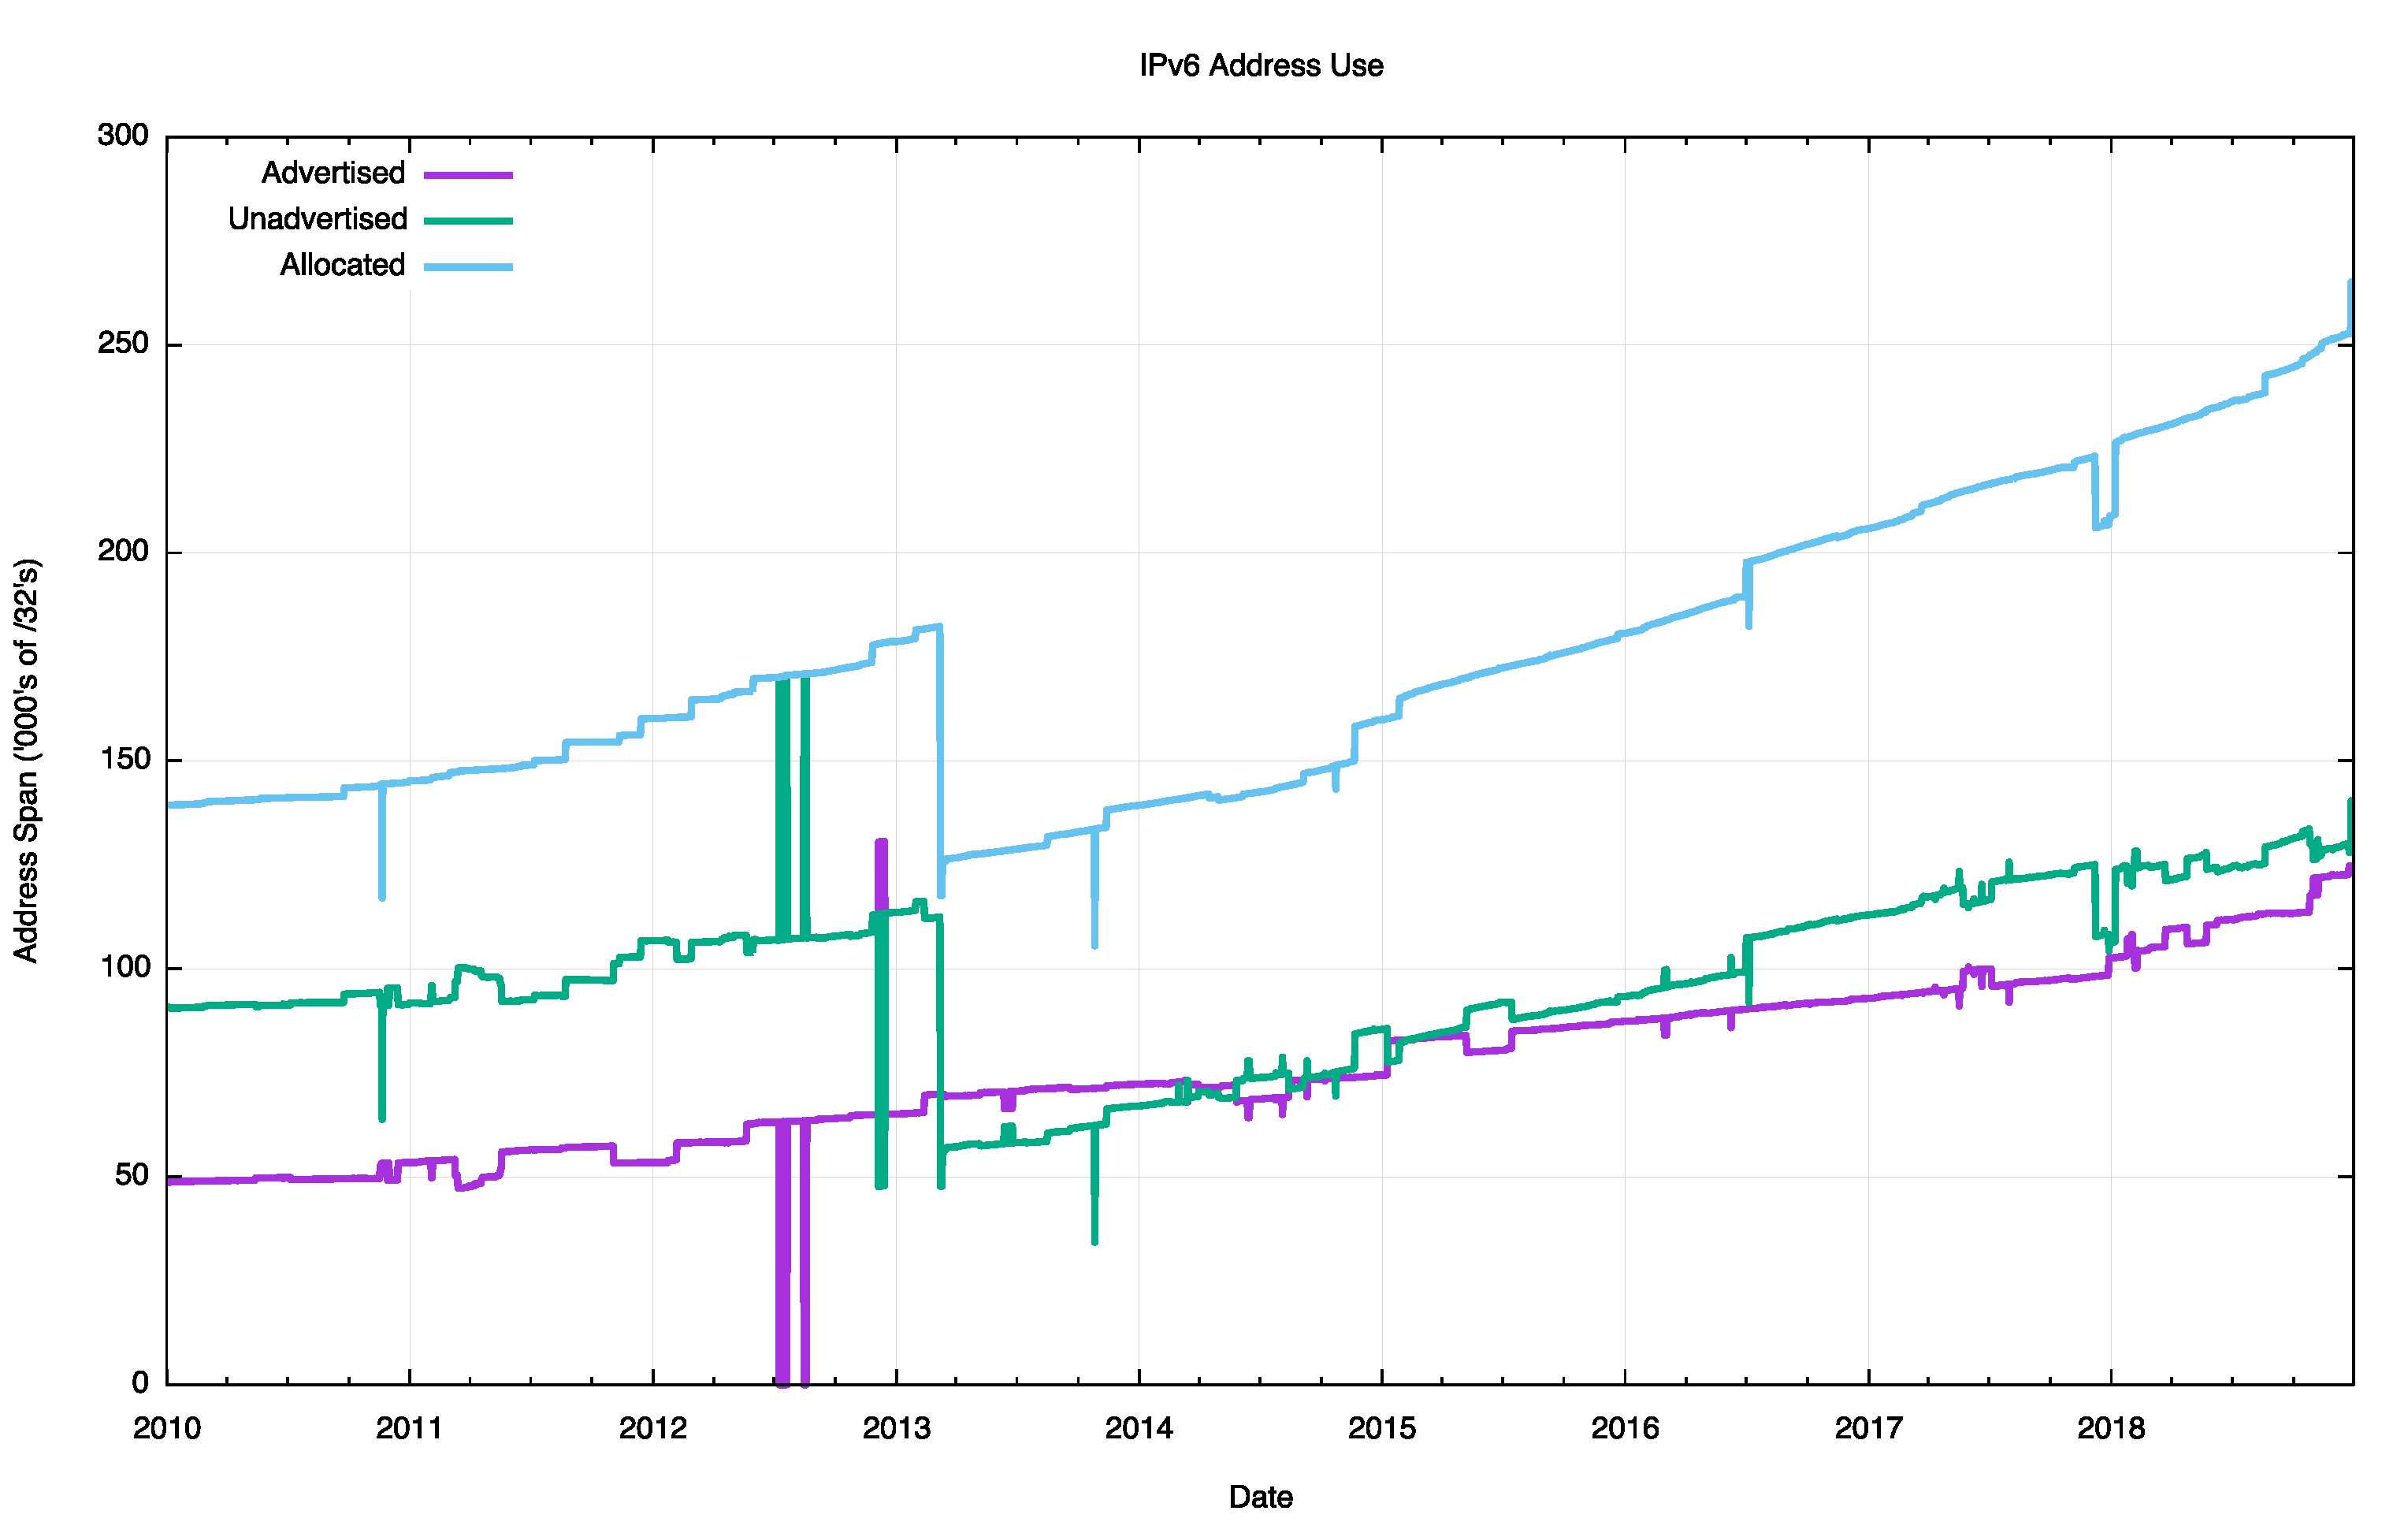
Figure 12 – Allocated, Unadvertised and Advertised IPv6 addresses
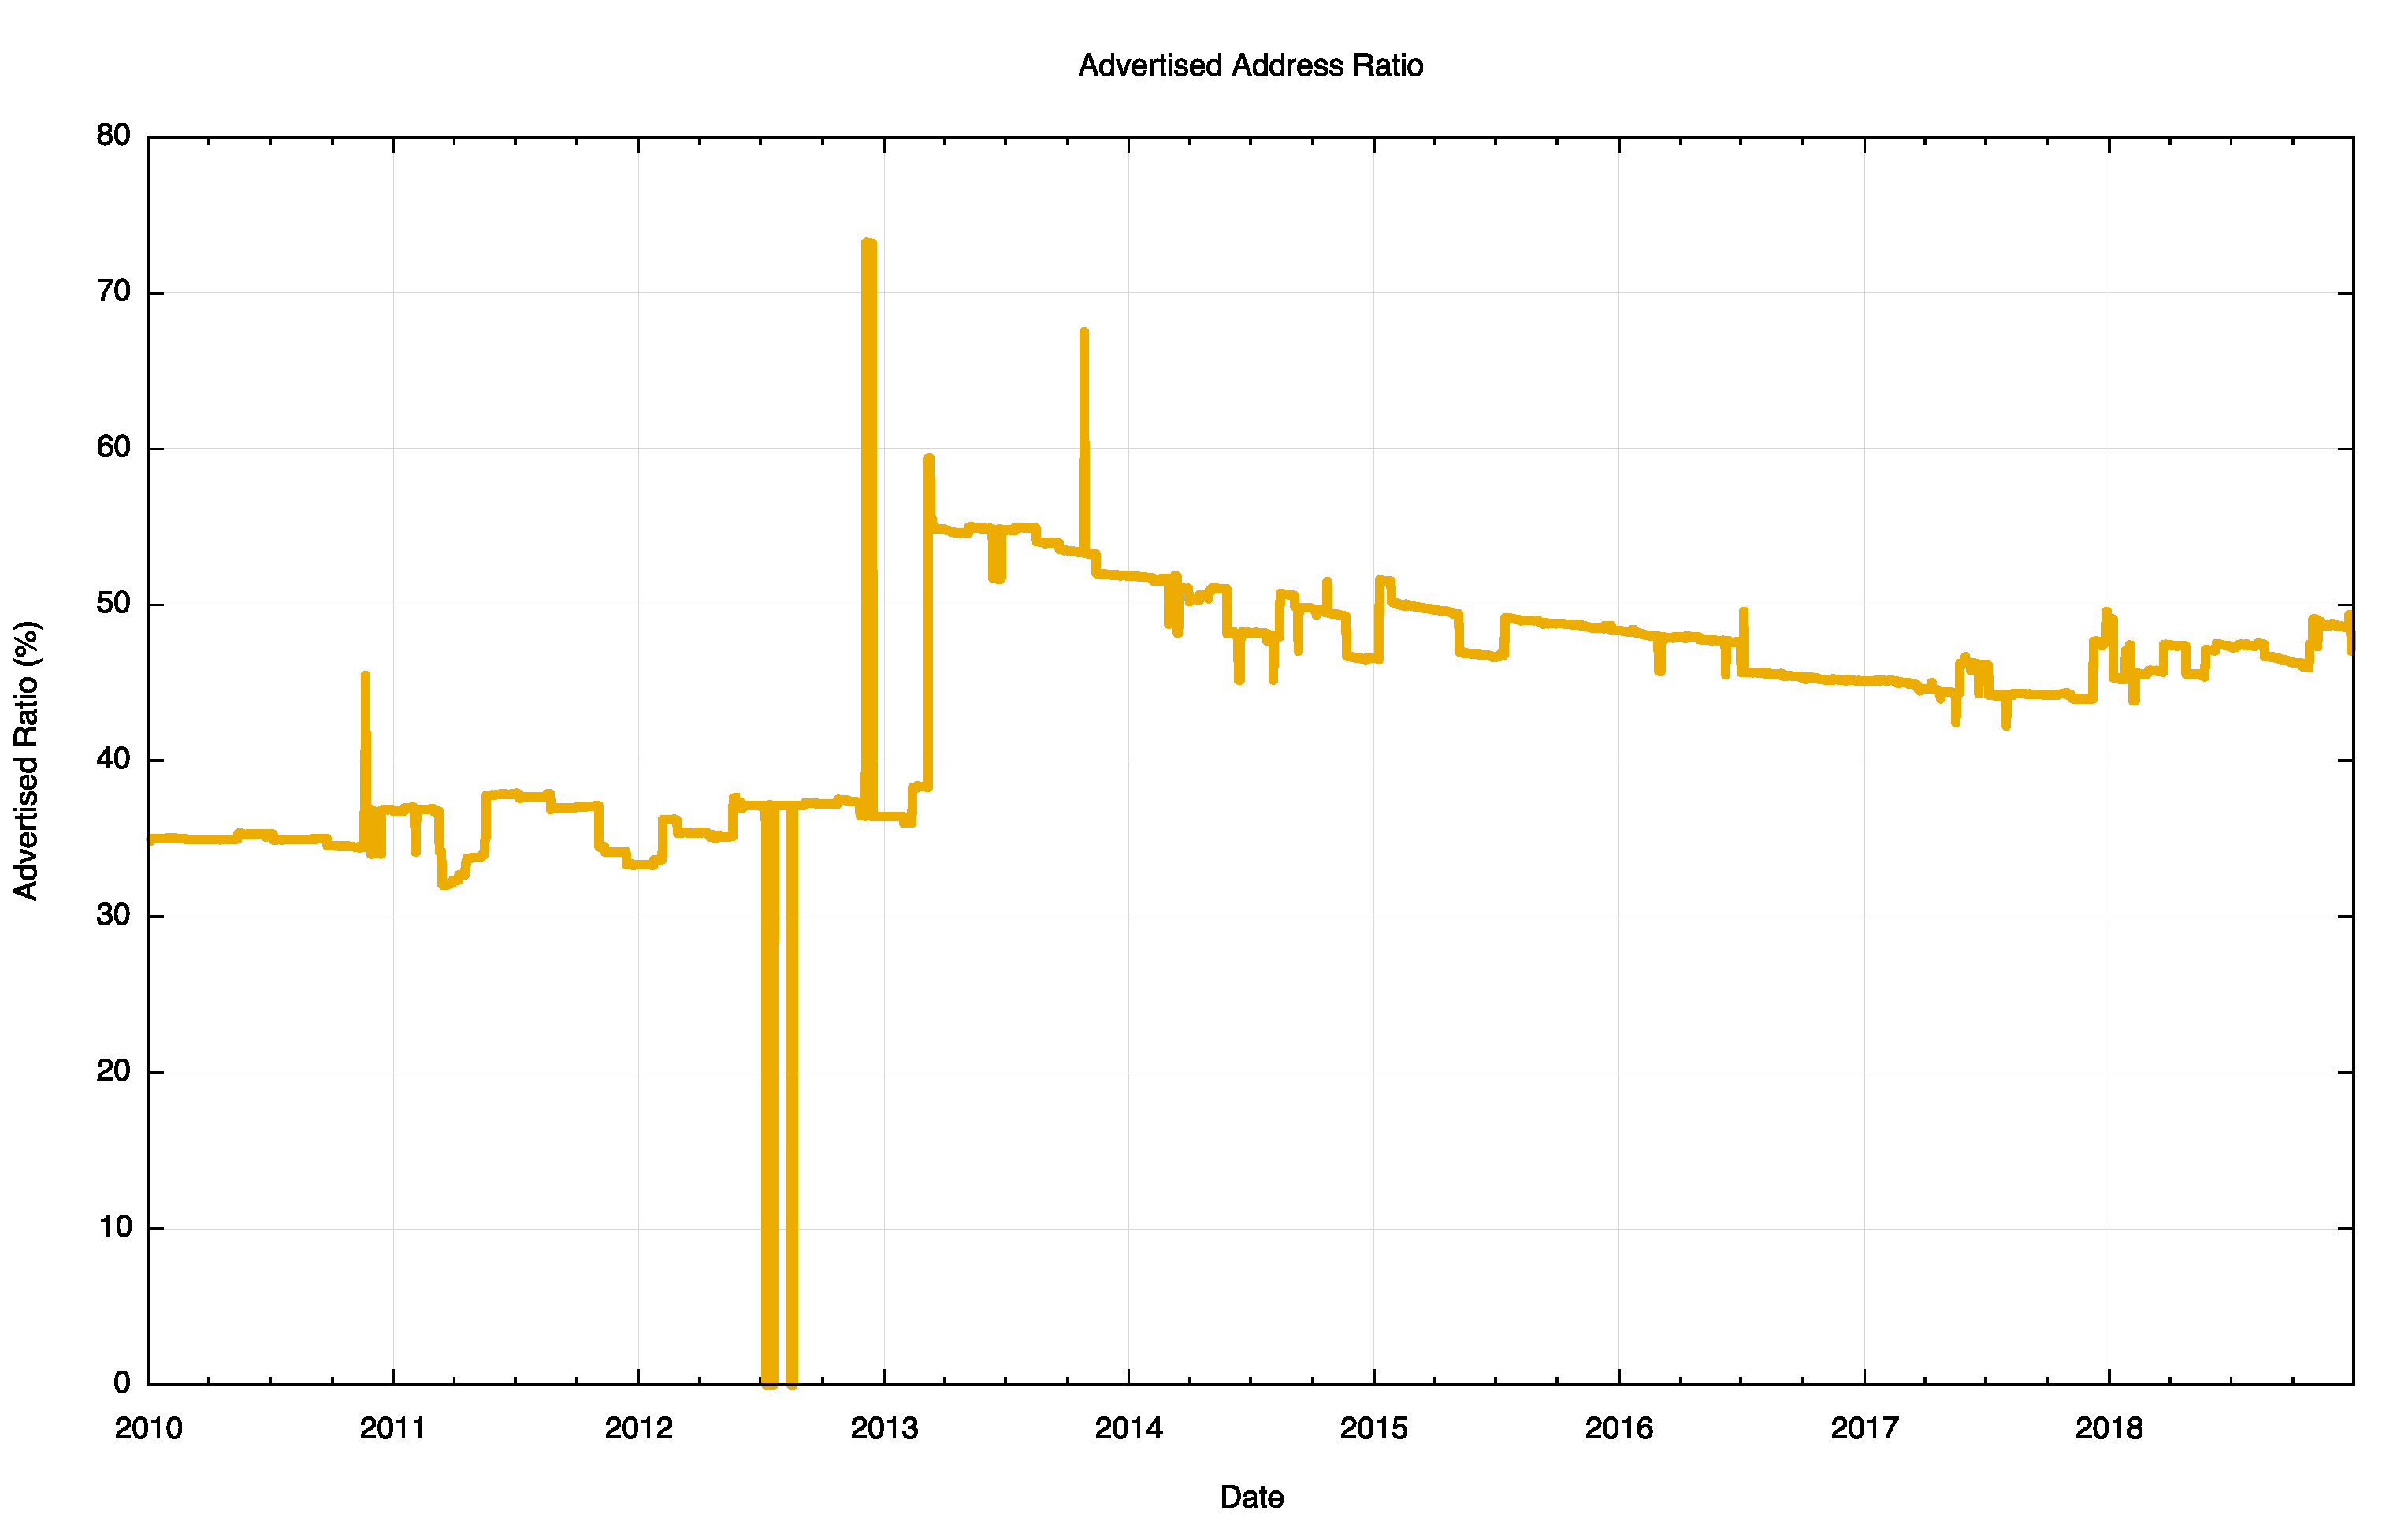
Figure 13 –Advertised IPv6 Addresses as a percentage of the Allocated Address Pool
The drop in the allocated address span in 2013 is the result of a change in LACNIC where a single large allocation into Brazil was replaced by the recording of direct allocation and assignments to ISPs and similar end entities.
From a history of careful conservation of IPv4 addresses, where some 77% of allocated or assigned IPv4 addresses are advertised in the BGP routing table, a comparable figure of 50% does not look all that impressive. But that's not the point. We chose the 128-bit address size in IPv6 to allow addresses to be used without overriding concerns about conservation. We are allowed to be inefficient in address utilisation. Today we have advertised an IPv6 address span which is the equivalent of some 125,000 /32s, or some 8 billion end-site /48 prefixes. That is just 0.003% of the total number of /48 prefixes in IPv6.
We can also look at the allocated address pools for the top twenty national economies in IPv6, and the current picture is shown in Table 19.
| Rank | CC | Allocated /48s | % Total | /48 per capita | Adv /48s | V6 Deployment | Name |
| 1 | US | 2,990,995,967 | 17.1% | 9.1 | 1,009,556,579 | 46.7% | USA |
| 2 | CN | 2,692,284,452 | 15.4% | 1.9 | 350,473,022 | 7.1% | China |
| 3 | DE | 1,314,193,902 | 7.5% | 15.9 | 541,000,366 | 37.7% | Germany |
| 4 | GB | 1,250,885,817 | 7.2% | 18.7 | 135,528,411 | 28.7% | UK |
| 5 | FR | 849,281,126 | 4.9% | 13.0 | 1,171,458 | 21.1% | France |
| 6 | JP | 655,040,680 | 3.8% | 5.2 | 427,061,462 | 31.6% | Japan |
| 7 | RU | 644,219,147 | 3.7% | 4.5 | 65,558 | 3.1% | Russia |
| 8 | AU | 591,987,769 | 3.4% | 23.6 | 274,736,022 | 13.0% | Australia |
| 9 | IT | 541,655,059 | 3.1% | 9.1 | 786,433 | 2.35% | Italy |
| 10 | NL | 464,716,082 | 2.7% | 27.1 | 3,342,346 | 13.1% | Netherlands |
| 11 | SE | 408,748,351 | 2.3% | 40.7 | 269,155,883 | 8.1% | Sweden |
| 12 | BR | 368,389,300 | 2.1% | 1.7 | 52,247,314 | 30.0% | Brazil |
| 13 | KR | 344,522,757 | 2.0% | 6.7 | 1,241,351 | 6.1% | Korea |
| 14 | AR | 332,139,066 | 1.9% | 7.4 | 272,187,805 | 8.2% | Argentina |
| 15 | ES | 321,388,567 | 1.8% | 6.9 | 196,609 | 2.4% | Spain |
| 16 | PL | 310,247,622 | 1.8% | 8.2 | 663,558 | 8.4% | Poland |
| 17 | ZA | 308,215,935 | 1.8% | 5.3 | 197,632 | 0.2% | South Africa |
| 18 | EG | 269,090,818 | 1.5% | 2.7 | 131,072 | 3.9% | Egypt |
| 19 | CH | 186,384,529 | 1.1% | 21.7 | 4,194,305 | 26.4% | Switzerland |
| 20 | TW | 162,660,362 | 0.9% | 6.8 | 16,867,675 | 34.2% | Taiwan |
Table 19 – IPv6 Allocated Address pools per National Economy
While the United States also tops this list in terms of the total pool of allocated IPv6 addresses, the per capita number is lower than many others in this list. Sweden has a surprisingly high number yet estimates of the population of IPv6-capable users in that country point to a deployment rate of just 7%, considerably lower than many other countries listed here. But for IPv6 its still relatively early days and no doubt the picture will change as deployment of IPv6 matures.
The Outlook for the Internet
Once more the set of uncertainties that surround the immediate future of the Internet are considerably greater than the set of predictions that we can be reasonably certain about.
Compared to previous years there has not been as much in the way of progress in the transition to IPv6 in 2018 (Figure 14). 2017 saw a sharp rise in IPv6 deployment, influenced to a major extent by the deployment of IPv6 services in India, notably by the Jio service. 2018 has been a quieter year, although the rise in the second half of the year is due to the initial stirrings of mass scale IPv6 deployment in the major Chinese service providers.
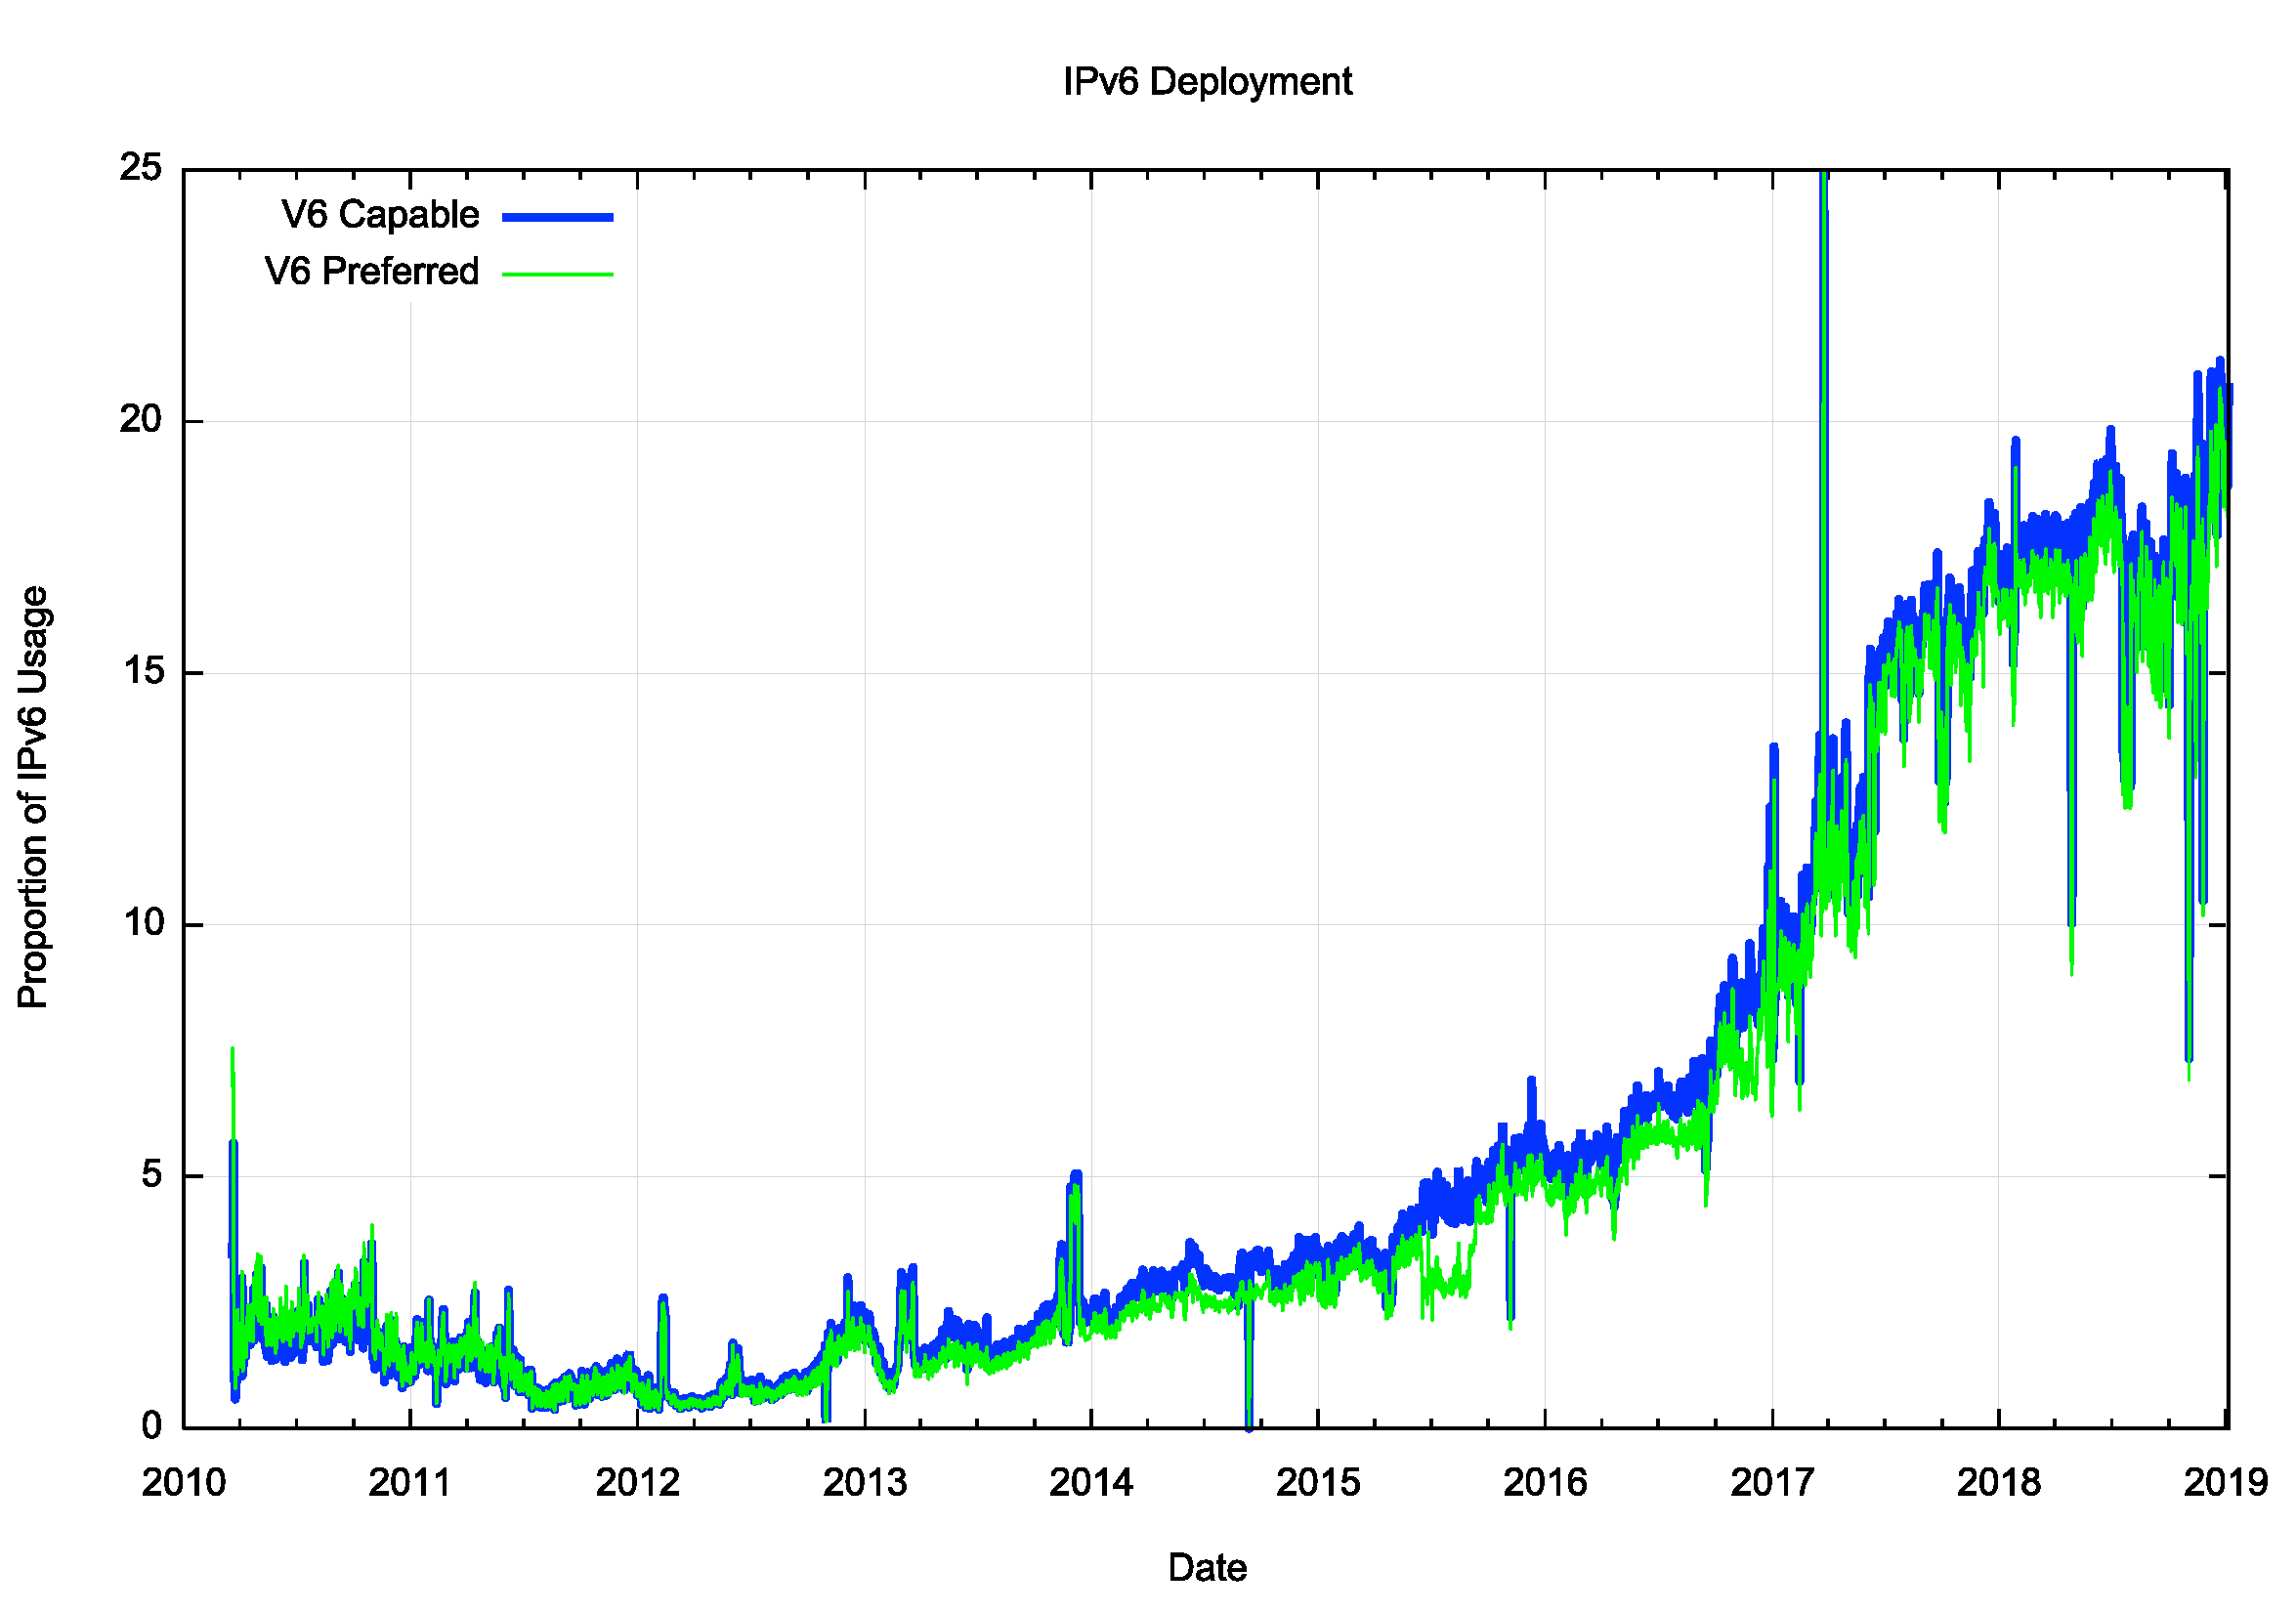
Figure 14 – IPv6 Deployment measurement 2010 - 2019
While a number of service operators have reached the decision point that the anticipated future costs of NAT deployment are unsustainable for their service platform, there remains a considerable school of thought that says that NATs will cost effectively absorb some further years of Internet device population growth. At least that's the only rationale I can ascribe to a very large number of service providers who are making no visible moves to push out Dual-Stack services at this point in time. Given that the ultimate objective of this transition is not to turn on Dual-Stack everywhere, but to turn off IPv4, there is still some time to go, and the uncertainty lies in trying to quantify what that time might be.
The period of the past few years has been dominated by the mass marketing of mobile internet services, and the growth rates for 2014 through to 2016 perhaps might have been the highest so far recorded were it not for the exhaustion of the IPv4 address pool. In address terms this growth in the IPv4 Internet is being almost completely masked by the use of Carrier Grade NATs in the mobile service provider environment, so that the resultant demands for public addresses in IPv4 are quite low and the real underlying growth rates in the network are occluded by these NATs.
In theory, there is no strict requirement for IPv6 to use NATs, and if the mobile world were deploying dual stack ubiquitously then this would be evident in the IPv6 address allocation data. And we see this in India, where the rollout of the Jio mobile service through 2016 and into 2017 has now encompassed some 90% of their considerable user population. The deployment in India has been accompanied by a conservative use of IPv6 addresses. The 107 million/48s allocated to date to India equates to 0.1 /48’s per capita, a number far lower that any other economy with significant IPv6 deployment.
On the other hand, the other massive user population, that of China, has only stirred with visible deployment of IPv6 in the latter part of 2018.
It has also been assumed that we should see IPv6 address demands for deployments of large-scale sensor networks and other forms of deployments that are encompassed under the broad umbrella of the Internet of Things. This does not necessarily imply that the deployment is merely a product of an over-hyped industry, although that is always a possibility. It is more likely to assume that so far such deployments are taking place using private IPv4 addresses, and they rely on NATs and application level gateways to interface to the public network. Time and time again we are lectured that NATs are not a good security device, but in practice NATs offer a reasonable front-line defence against network scanning malware, so there may be a larger story behind the use of NATs and device-based networks than just a simple conservative preference to continue to use an IPv4 protocol stack.
We are witnessing an industry that is no longer using technical innovation, openness and diversification as its primary means of propulsion. The widespread use of NATs in IPv4 limit the technical substrate of the Internet to a very restricted model of simple client/server interactions using TCP and UDP. The use of NATs force the interactions into client-initiated transactions, and the model of an open network with considerable flexibility in the way in which communications take place is no longer being sustained in today’s network. Incumbents are entrenching their position and innovation and entrepreneurialism are taking a back seat while we sit out this protracted IPv4/IPv6 transition.
What is happening is that today's internet carriage service is provided by a smaller number of very large players, each of whom appear to be assuming a very strong position within their respective markets. The drivers for such larger players tend towards risk aversion, conservatism and increased levels of control across their scope of operation. The same trends of market aggregation are now appearing in content provision, where a small number of content providers are exerting a completely dominant position across the entire Internet.
The evolving makeup of the Internet industry has quite profound implications in terms of network neutrality, the separation of functions of carriage and service provision, investment profiles and expectations of risk and returns on infrastructure investments, and on the openness of the Internet itself. Given the economies of volume in this industry, it was always going to be challenging to sustain an efficient, fully open and competitive industry, but the degree of challenge in this agenda is multiplied many-fold when the underlying platform has run out of the basic currency of IP addresses. The pressures on the larger players within these markets to leverage their incumbency into overarching control gains traction when the stream of new entrants with competitive offerings dries up, and the solutions in such scenarios typically involve some form of public sector intervention directed to restore effective competition and revive the impetus for more efficient and effective offerings in the market.
As the Internet continues to evolve, it is no longer the technically innovative challenger pitted against venerable incumbents in the forms of the traditional industries of telephony, print newspapers, television entertainment and social interaction. The Internet is now the established norm. The days when the Internet was touted as a poster child of disruption in a deregulated space are long since over, and these days we appear to be increasingly looking further afield for a regulatory and governance framework that can challenge the increasing complacency of the newly-established incumbents.
It is unclear how successful we will be in this search. We can but wait and see.
![]()
Disclaimer
The above views do not necessarily represent the views of the Asia Pacific Network Information Centre.
![]()
About the Author
GEOFF HUSTON B.Sc., M.Sc., is the Chief Scientist at APNIC, the Regional Internet Registry serving the Asia Pacific region.