The ISP Column
A column on things Internet
| |
Other Formats:
| |
IPv4 Address Exhaustion in APNIC
August 2015
Geoff Huston
It has been over 4 years since APNIC, the Regional Internet Registry for the Asia Pacific Region handed out its last “general use” allocation of IPv4 addresses. Since April 2011 APNIC has been restricted to handing out addresses from a “last chance” address pool, and has limited the amount of addresses allocated to each applicant to a maximum of 1,024 addresses, or the equivalent of a /22. In this article I’d like to review where APNIC is up to with its remaining pools of IPv4 addresses.
IPv4 Address Exhaustion
At the end of July 2015 only one RIR is operating a conventional general use IPv4 address distribution function, AFRINIC. AFRINIC’s remaining available pool of 40,324,096 IPv4 addresses will sustain the various regional demands for addresses for the next 3 ½ years, assuming that the future demand for addresses in that region continues largely at its current levels.
The other RIRs are operating under entirely different conditions.
APNIC exhausted its general use pool of addresses in April 2011, and since then has been operating under its “Last /8” framework, where each applicant is limited to a total address allocation of 1,024 addresses from this final pool of available addresses. APNIC currently has a total of 15,728,128 unassigned IPv4 addresses, of which 11,028,480 are marked as “available”.
The RIPE NCC also exhausted its general use IPv4 address pools in September 2012, and since then has been operating under a similar limited allocation framework to that used by APNIC. The RIPE NCC currently has 17,814,120 unassigned IPv4 addresses that are being allocated in this manner, of which 16,627,928 addresses are marked as available.
LACNIC exhausted its pool of general use IPv4 addresses in May 2014. It currently has 7,056,384 unassigned addresses, of which 2,605,312 are marked as available. At present LACNIC is using an address distribution framework that allocates a maximum of 1,024 addresses to each applicant. When the available addresses pass the next threshold the remaining addresses are reserved exclusively for new applicants.
The ARIN address pool was effectively exhausted at the end of June 2015. They have some 6,081,024 addresses marked as “reserved” while 57,088 addresses are marked as available. This pool of available addresses is composed of a set of /24 addresses and the prevailing policies require a precise match between the application’s requirements and a block in the available pool, so the drawdown from the remaining pool is now relatively slow.
The aggregate picture of this rundown across all the RIRs is shown in Figure 1.
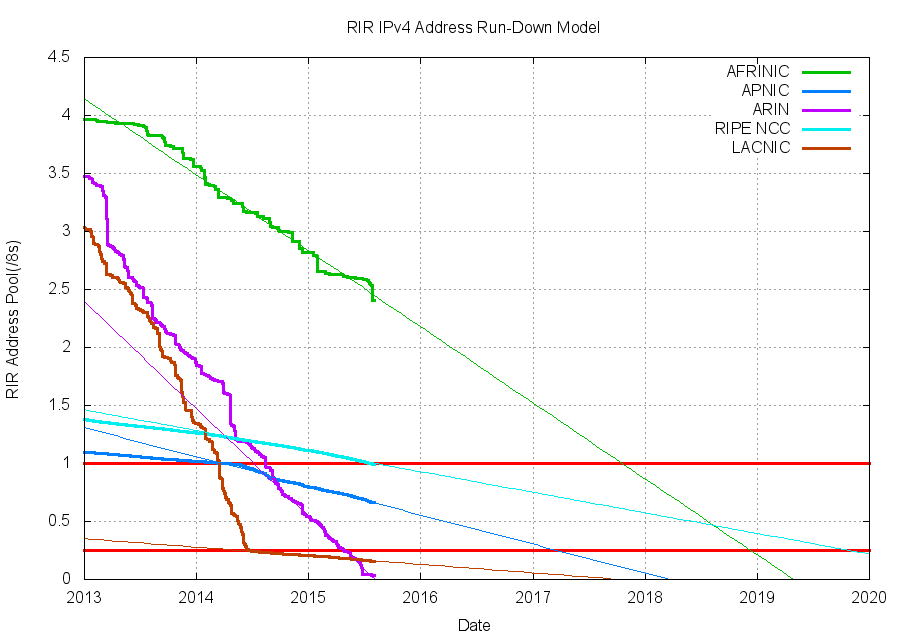
Figure 1 – IPv4 Address Rundown for the RIRs
Let’s take a more detailed view of APNIC’s drawdown of the addresses held in this last /8 pool. It is evident that there was a marked shift in the drawdown rate of this pool of addresses in the second quarter of 2014, and the consumption rate of addresses abruptly doubled at that time. The faster consumption rate of these addresses has been sustained for the subsequent 18 months to the present. (Figure 2). This coincides with the first set of returns from the IANA Recovered Address Registry, and suitably qualified applicants were able to request a total of a /21 by requesting a /22 from the Last /8 address pool , and a second /22 from the IANA Return pool. The approximate doubling of the address consumption rate at this point in time shows that most applicants availed themselves of the ability to draw from each pool once this was an available option.
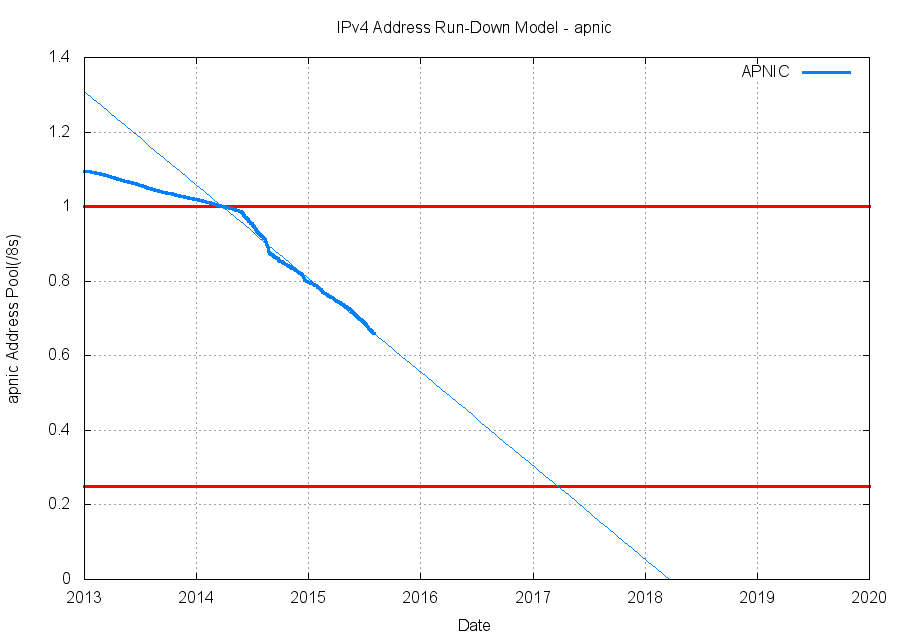
Figure 2 – Address Allocations from APNIC 2013 to the present
A more subtle version of this same uptake in address consumption is visible in the RIPE NCC, but rather than a doubling of the address consumption rate, the increase is close to a 25% increase in consumption (Figure 3). The RIPE NCC evidently did not open up a second allocation window with these returned addresses, and is managing the entire pool under a single last /8 policy framework.
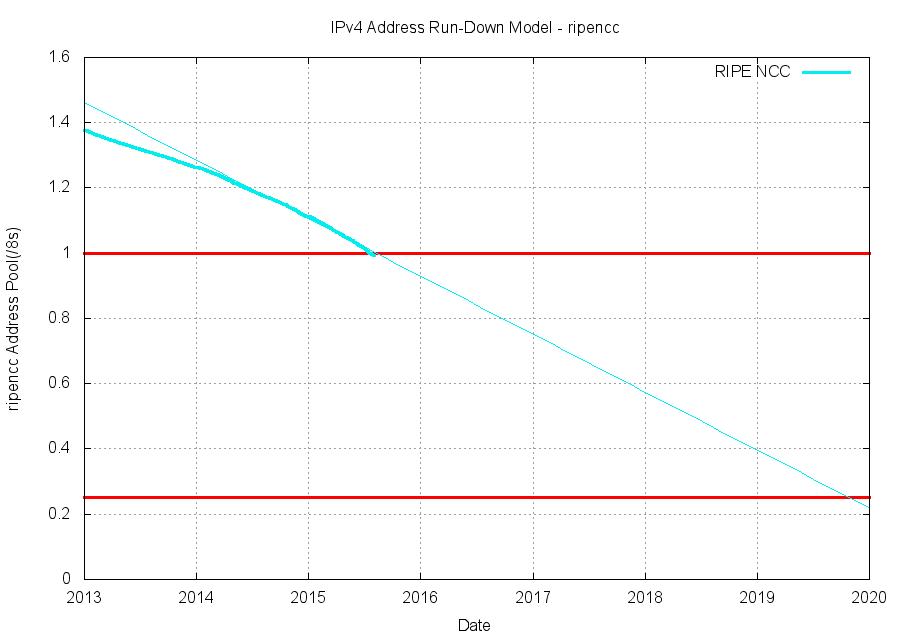
Figure 3 – Address Allocations from RIPE NCC 2013 to the present
Table 1 shows the current estimates of the time to draw down each of the RIR’s residual pool of IPv4 addresses to the level of complete exhaustion, assuming a continuation of the current levels of address consumption.
| RIR | Available Addresses | Current Policy | Est. Time to Depletion |
| AFRINIC | 40,324,096 | Demonstrated Need | ~4 years |
| APNIC | 11,028,480 | Last /8 | 2 – 2 ½ years |
| ARIN | 57,088 | Last Phase of Demonstrated Need | Inadequate Data |
| LACNIC | 2,605,312 | Exhaustion, Phase 2 | 1 ½ - 2 years |
| RIPE NCC | 16,629,928 | Last /8 | 4 ½ - 5 ½ years |
Table 1 – IPv4 Status in the RIRs
APNIC and the Last /8 Address Allocations
Let’s now take a more detailed look at APNIC and the allocations that have been made from their remaining pool of addresses.
The policy framework that is used by APNIC is one that directs APNIC to allocate no more than 1,024 addresses, or a /22 to each entity from this address pool. APNIC primarily uses the address block 103.0.0.0/8 as its “last /8” so we can look at this block to determine how APNIC is administering this pool of addresses.
As of the start of August 2015 some 6,118,144 addresses have been assigned from the block, 312,576 addresses are marked as reserved, leaving 10,346,496 available addresses. Some 36% of the addresses in this block have been assigned, leaving 64% of the addresses available for future allocation (Figure 4).
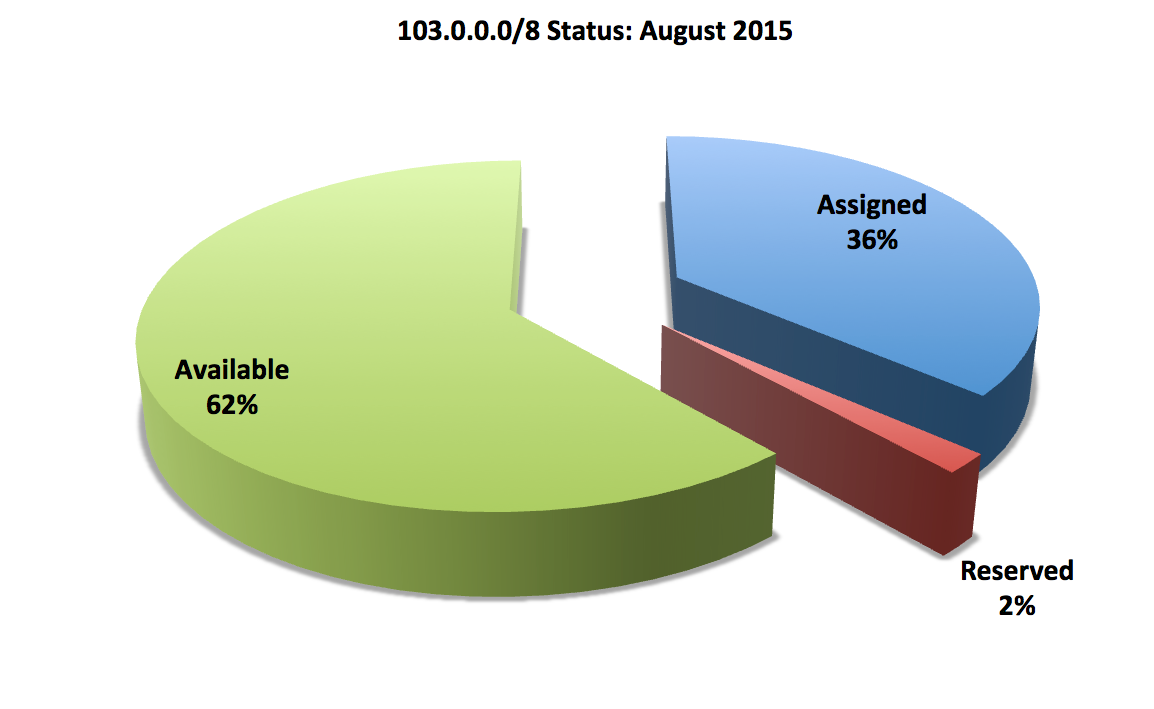
Figure 4 – Current Allocation Status of 103.0.0.0/8
A map of 103.0.0.0/8 showing the relative age of the registered allocations (Figure 5) shows that APNIC started allocating from the first addresses in the block, using 103.0.0.0/11. When this was fully allocated APNIC then allocated from the high end of the block, 103.240.0.0/12, then when this was fully allocated it followed by allocating from 103.224.0.0/12. It then switched back to the low part of the block and allocated from 103.32.0.0/11, and most recently APNIC has been from 103.192.0.0/12. The empty spaces in the map of this address block in Figure 4 are not returns of address space. They mark blocks that are labelled “reserved”. The reasons why APNIC is “hopping” across the block for groups of allocations is not entirely obvious to this observer, nor am I aware of the rationale of these reservations made within the block.
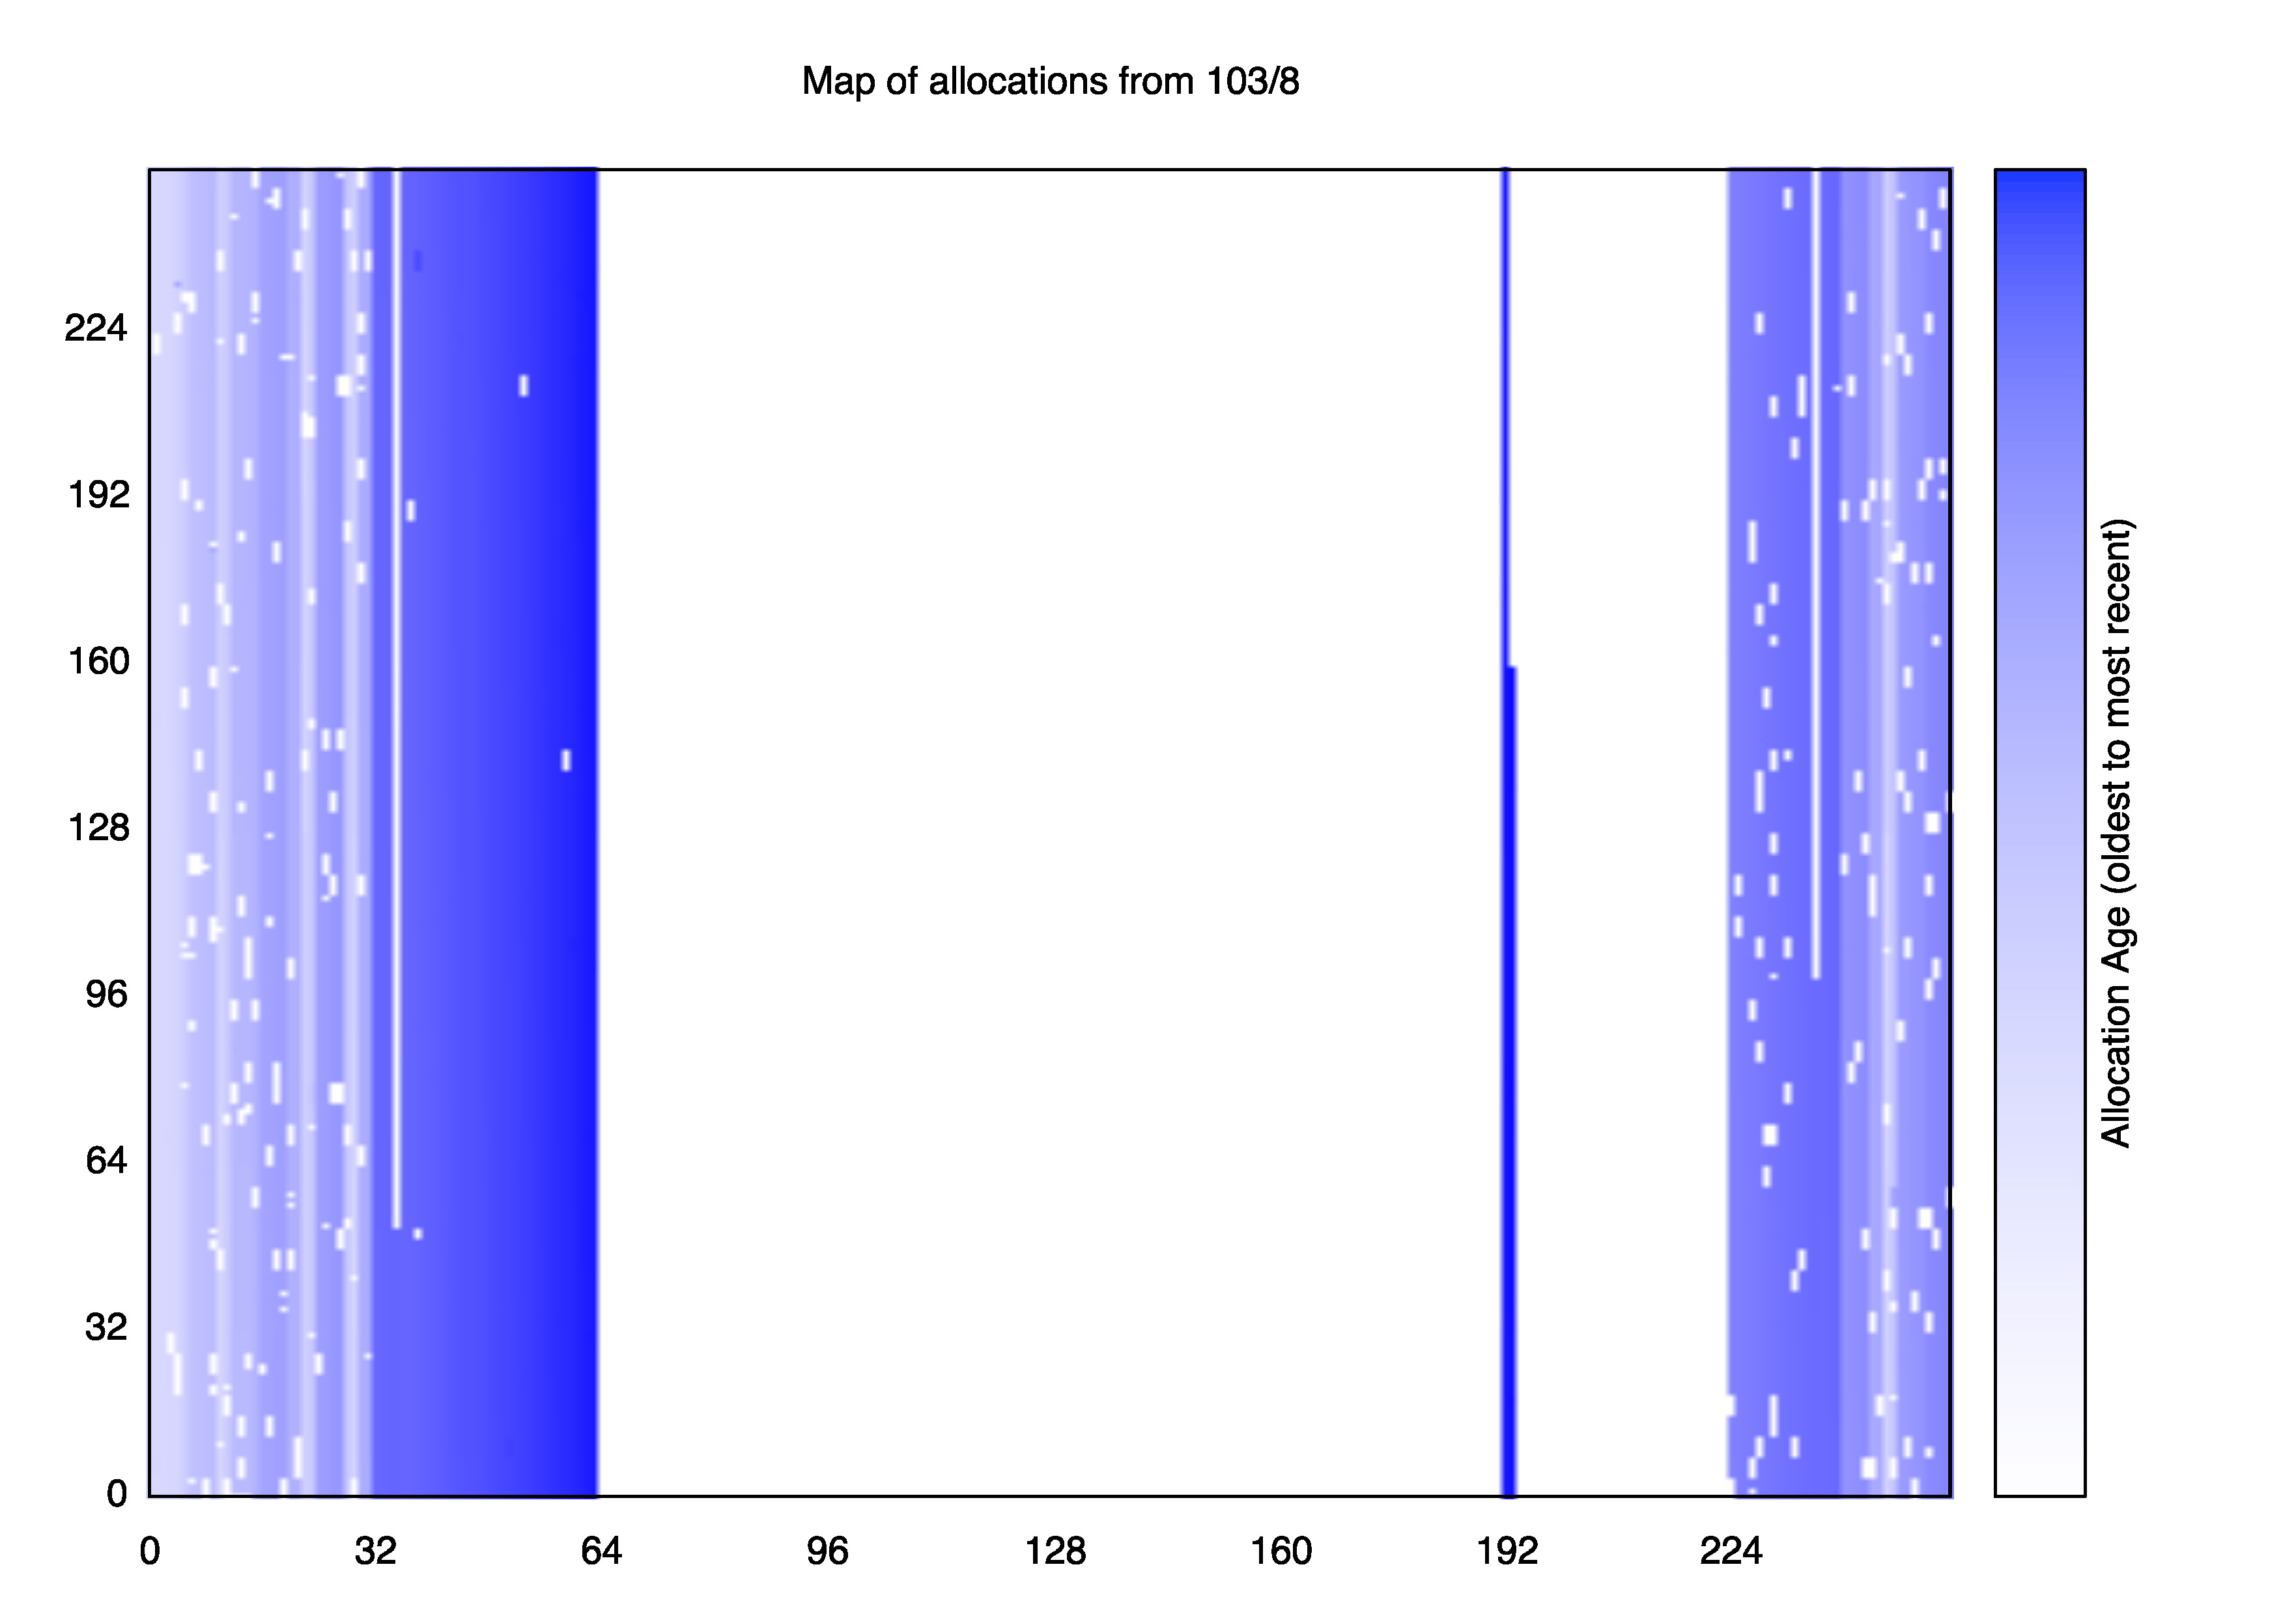
Figure 5 – Address Allocations from 103.0.0.0/8
The allocations from this last /8 block are intended to be either a /22 (1,024 addresses), a /23 (512 addresses) or a /24 (256 addresses).
Some three quarters of all allocations are /22’s. The remainder is split between /24s and /23s in the approximate ratio of 2:1. If we look at the evolution of allocation sizes on a year-by-year basis (Figure 6) its evident that the relative number of /22 allocations has been gradually increasing, and in 2014 the number of /22 allocations was closer to four fifths than the longer term average of three quarters. (Figure 4). The smaller values for 2015 reflect the partial totals for the first seven months of the year.
There are a couple of anomalous entries in the APNIC registry that show 4 allocations of /21 (2,048 addresses) and one allocation of a /20 (4,096 addresses). In one case (103.23.80.0/21) this appears to be a transcription error when passing registration data from the Korean KRNIC data base to the APNIC database (103.23.80.0/22 and 103.23.84.0/22). The other anomalous entries (103.51.168.0/21, 103.51.184.0/21, 102.51.192.0/21 and 103.51.240.0/20) are not so readily explained. One entity appears to be holding some 14,336 addresses from this address block, well above the policy-determined upper limit of allocations of 1,024 addresses per entity. Presumably there has been some post-allocation mergers that would account for this apparent anomaly.
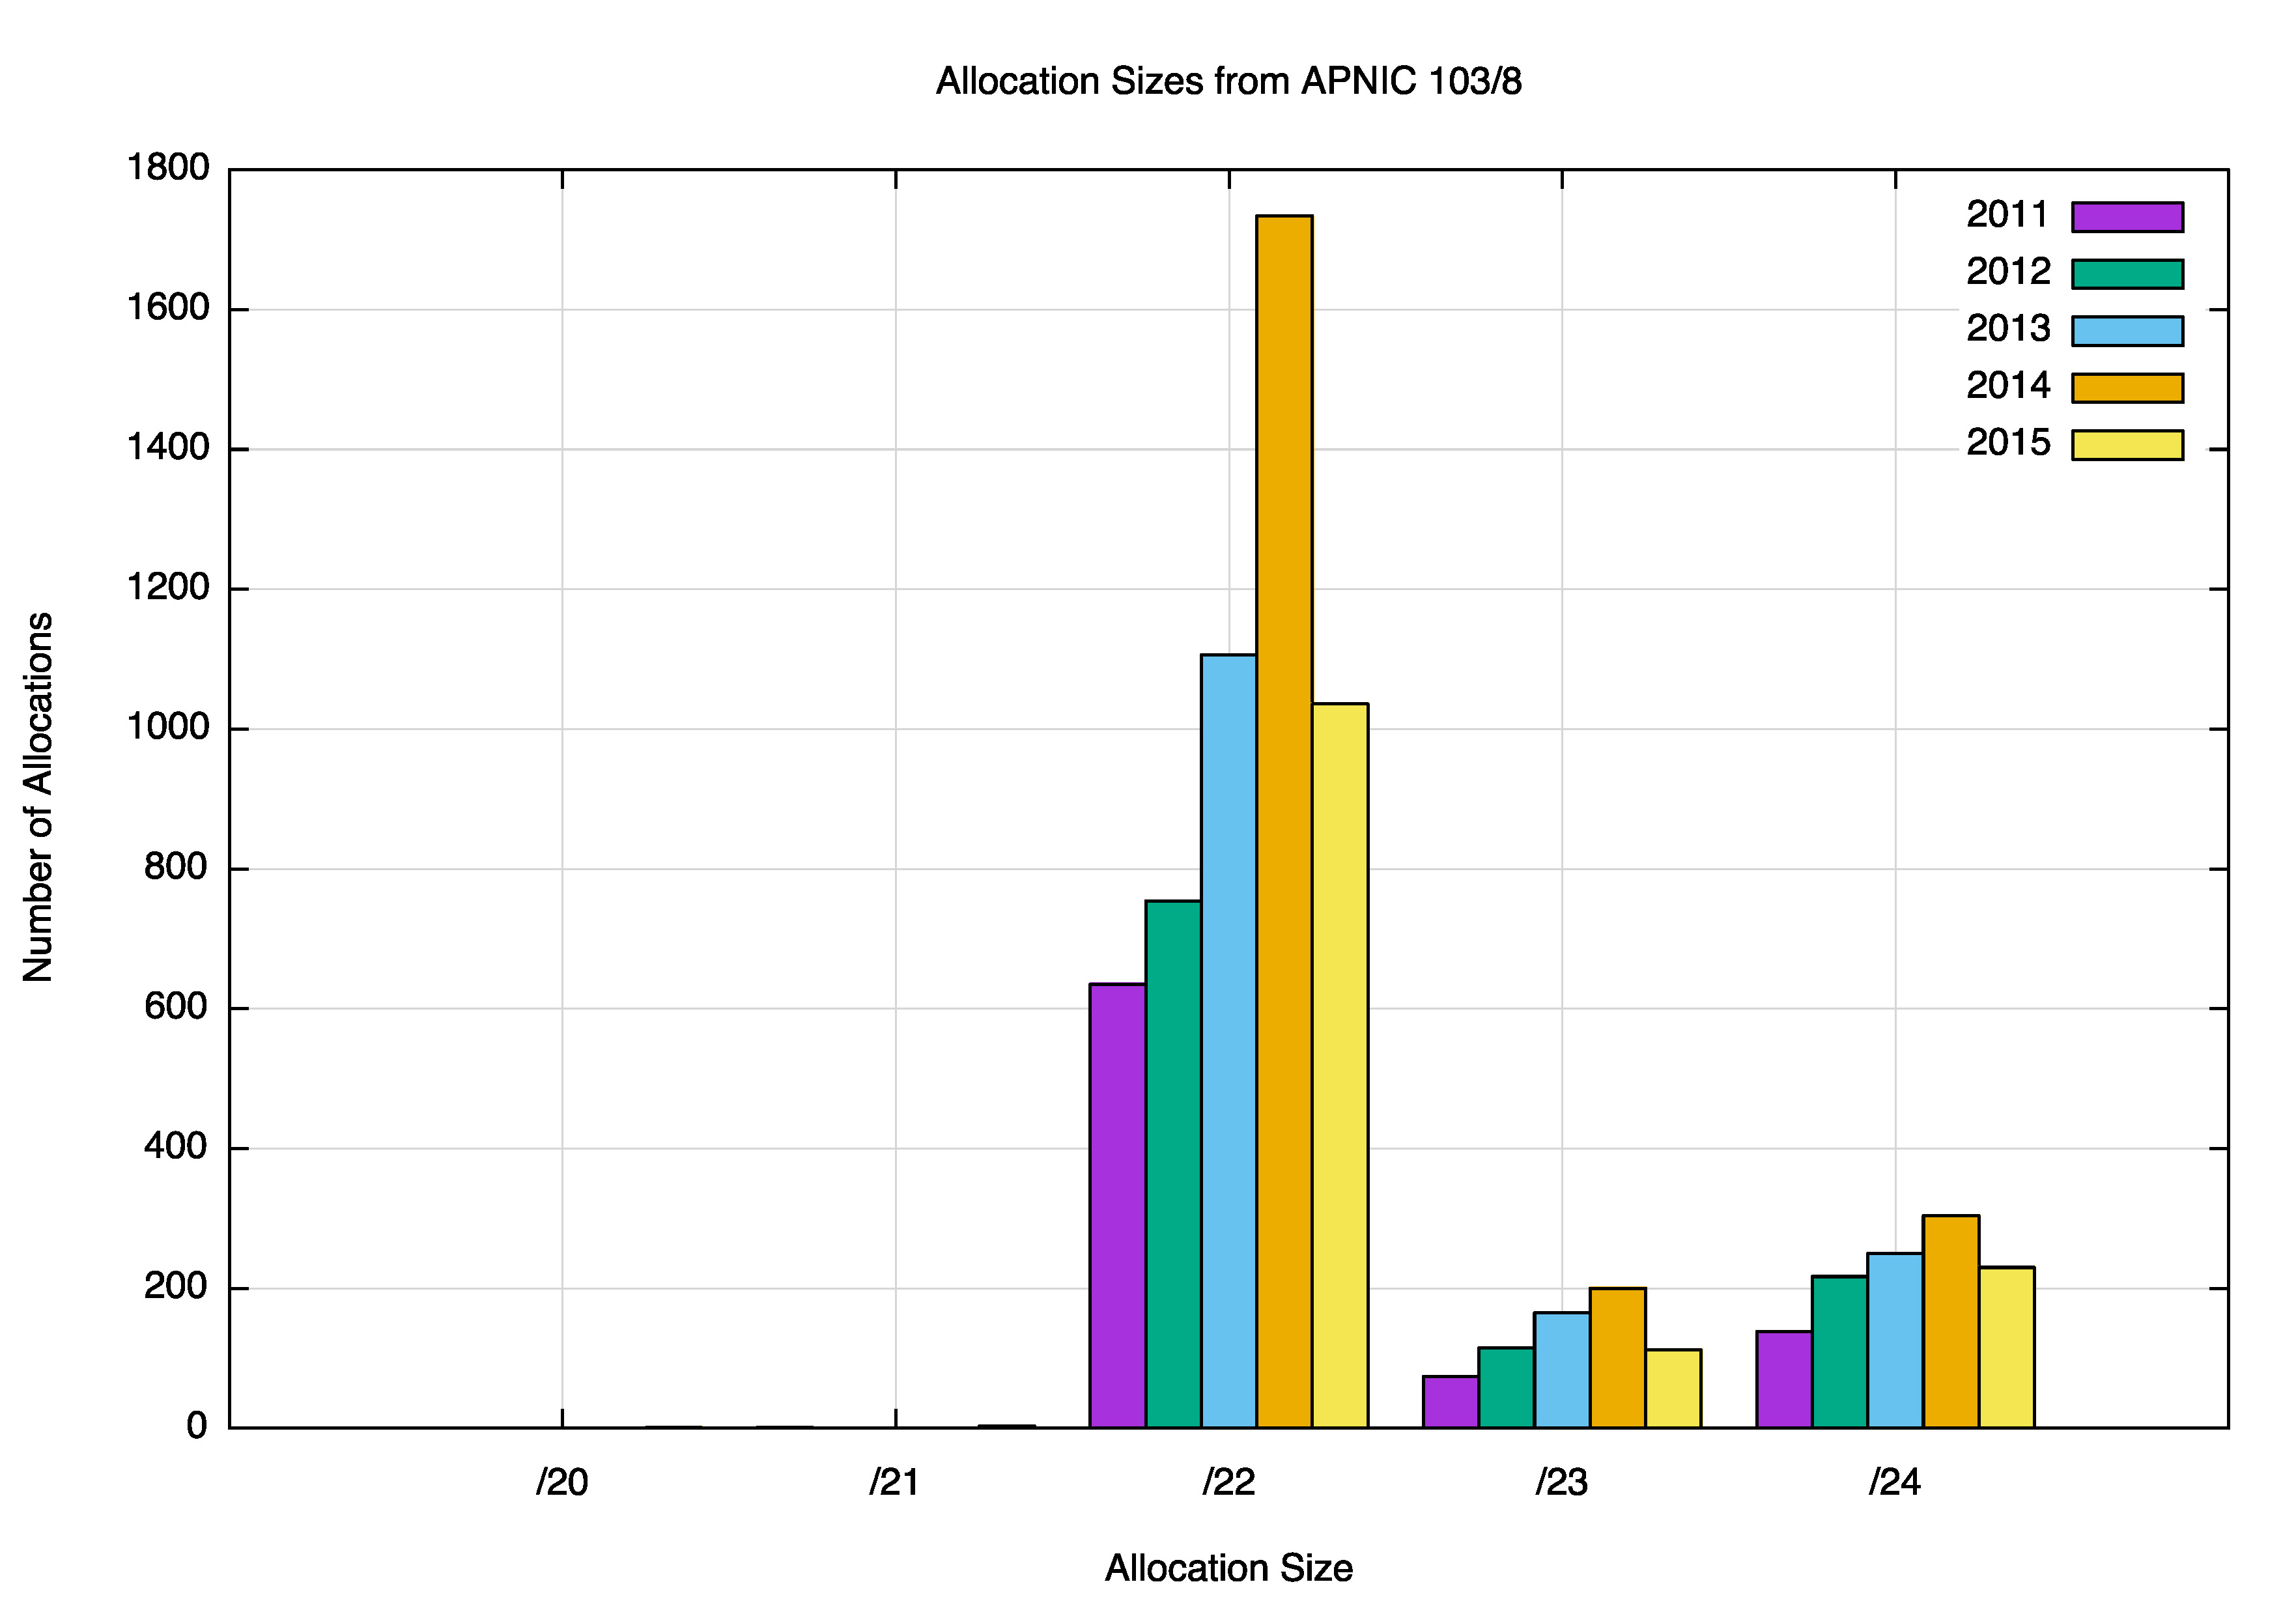
Figure 6 – Allocation Size Distribution of Address Allocations from 103.0.0.0/8
The countries which have received allocations from this last /8 are shown in Figure 7. The distribution is reflective of the cross product of the level of maturity of Internet infrastructure within the country with the population of the country’s Internet users. The six countries that have received the largest volume of addresses from this address block are China, India and Indonesia who share large populations and a rapidly expanding internet infrastructure, and Australia, Japan and Hong Kong who share a mature Internet infrastructure with an increasing intensity of reliance on this infrastructure a broad range of secure services and function. In such cases, particularly relating to secure content and service provision, address sharing is not the preferred approach, and the use of dedicated addressing for the service infrastructure is commonplace in these environments.
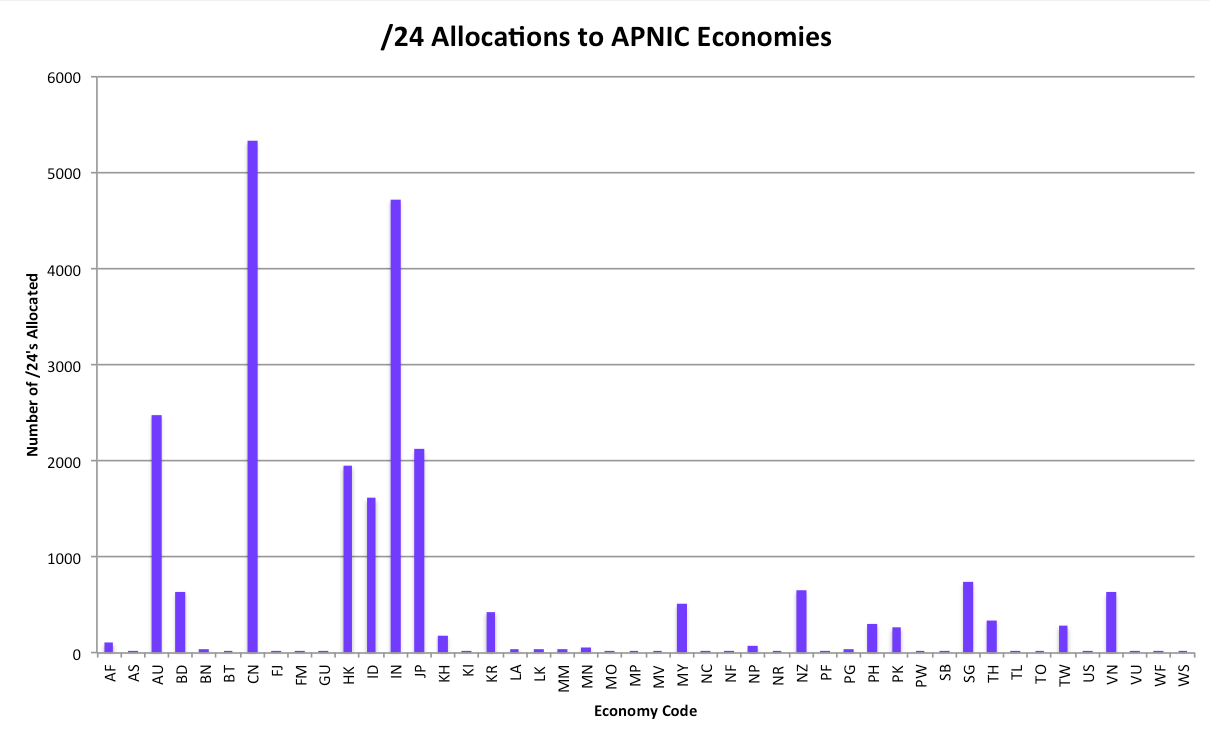
Figure 7 – Per-Country Distribution of Allocations from 103.0.0.0/8
Given that applicants need to demonstrate that they have some form of immediate or near term future need to receive an address allocation from this final pool of IPv4 addresses it may be reasonable to assume that the overall majority of these addresses would be used on the public Internet, and therefore would be advertised in the global routing system.
This is not quite the case, and of the 6,052,6080 assigned addresses from this address block we see only 4,037,376 advertised addresses (66% of the assigned total). This is shown as a cumulative distribution in Figure 8, indicating that the practice of receiving al allocation from the last /8 and not advertising it immediately is most prevalent for addresses that have been allocated within the past 12 month.
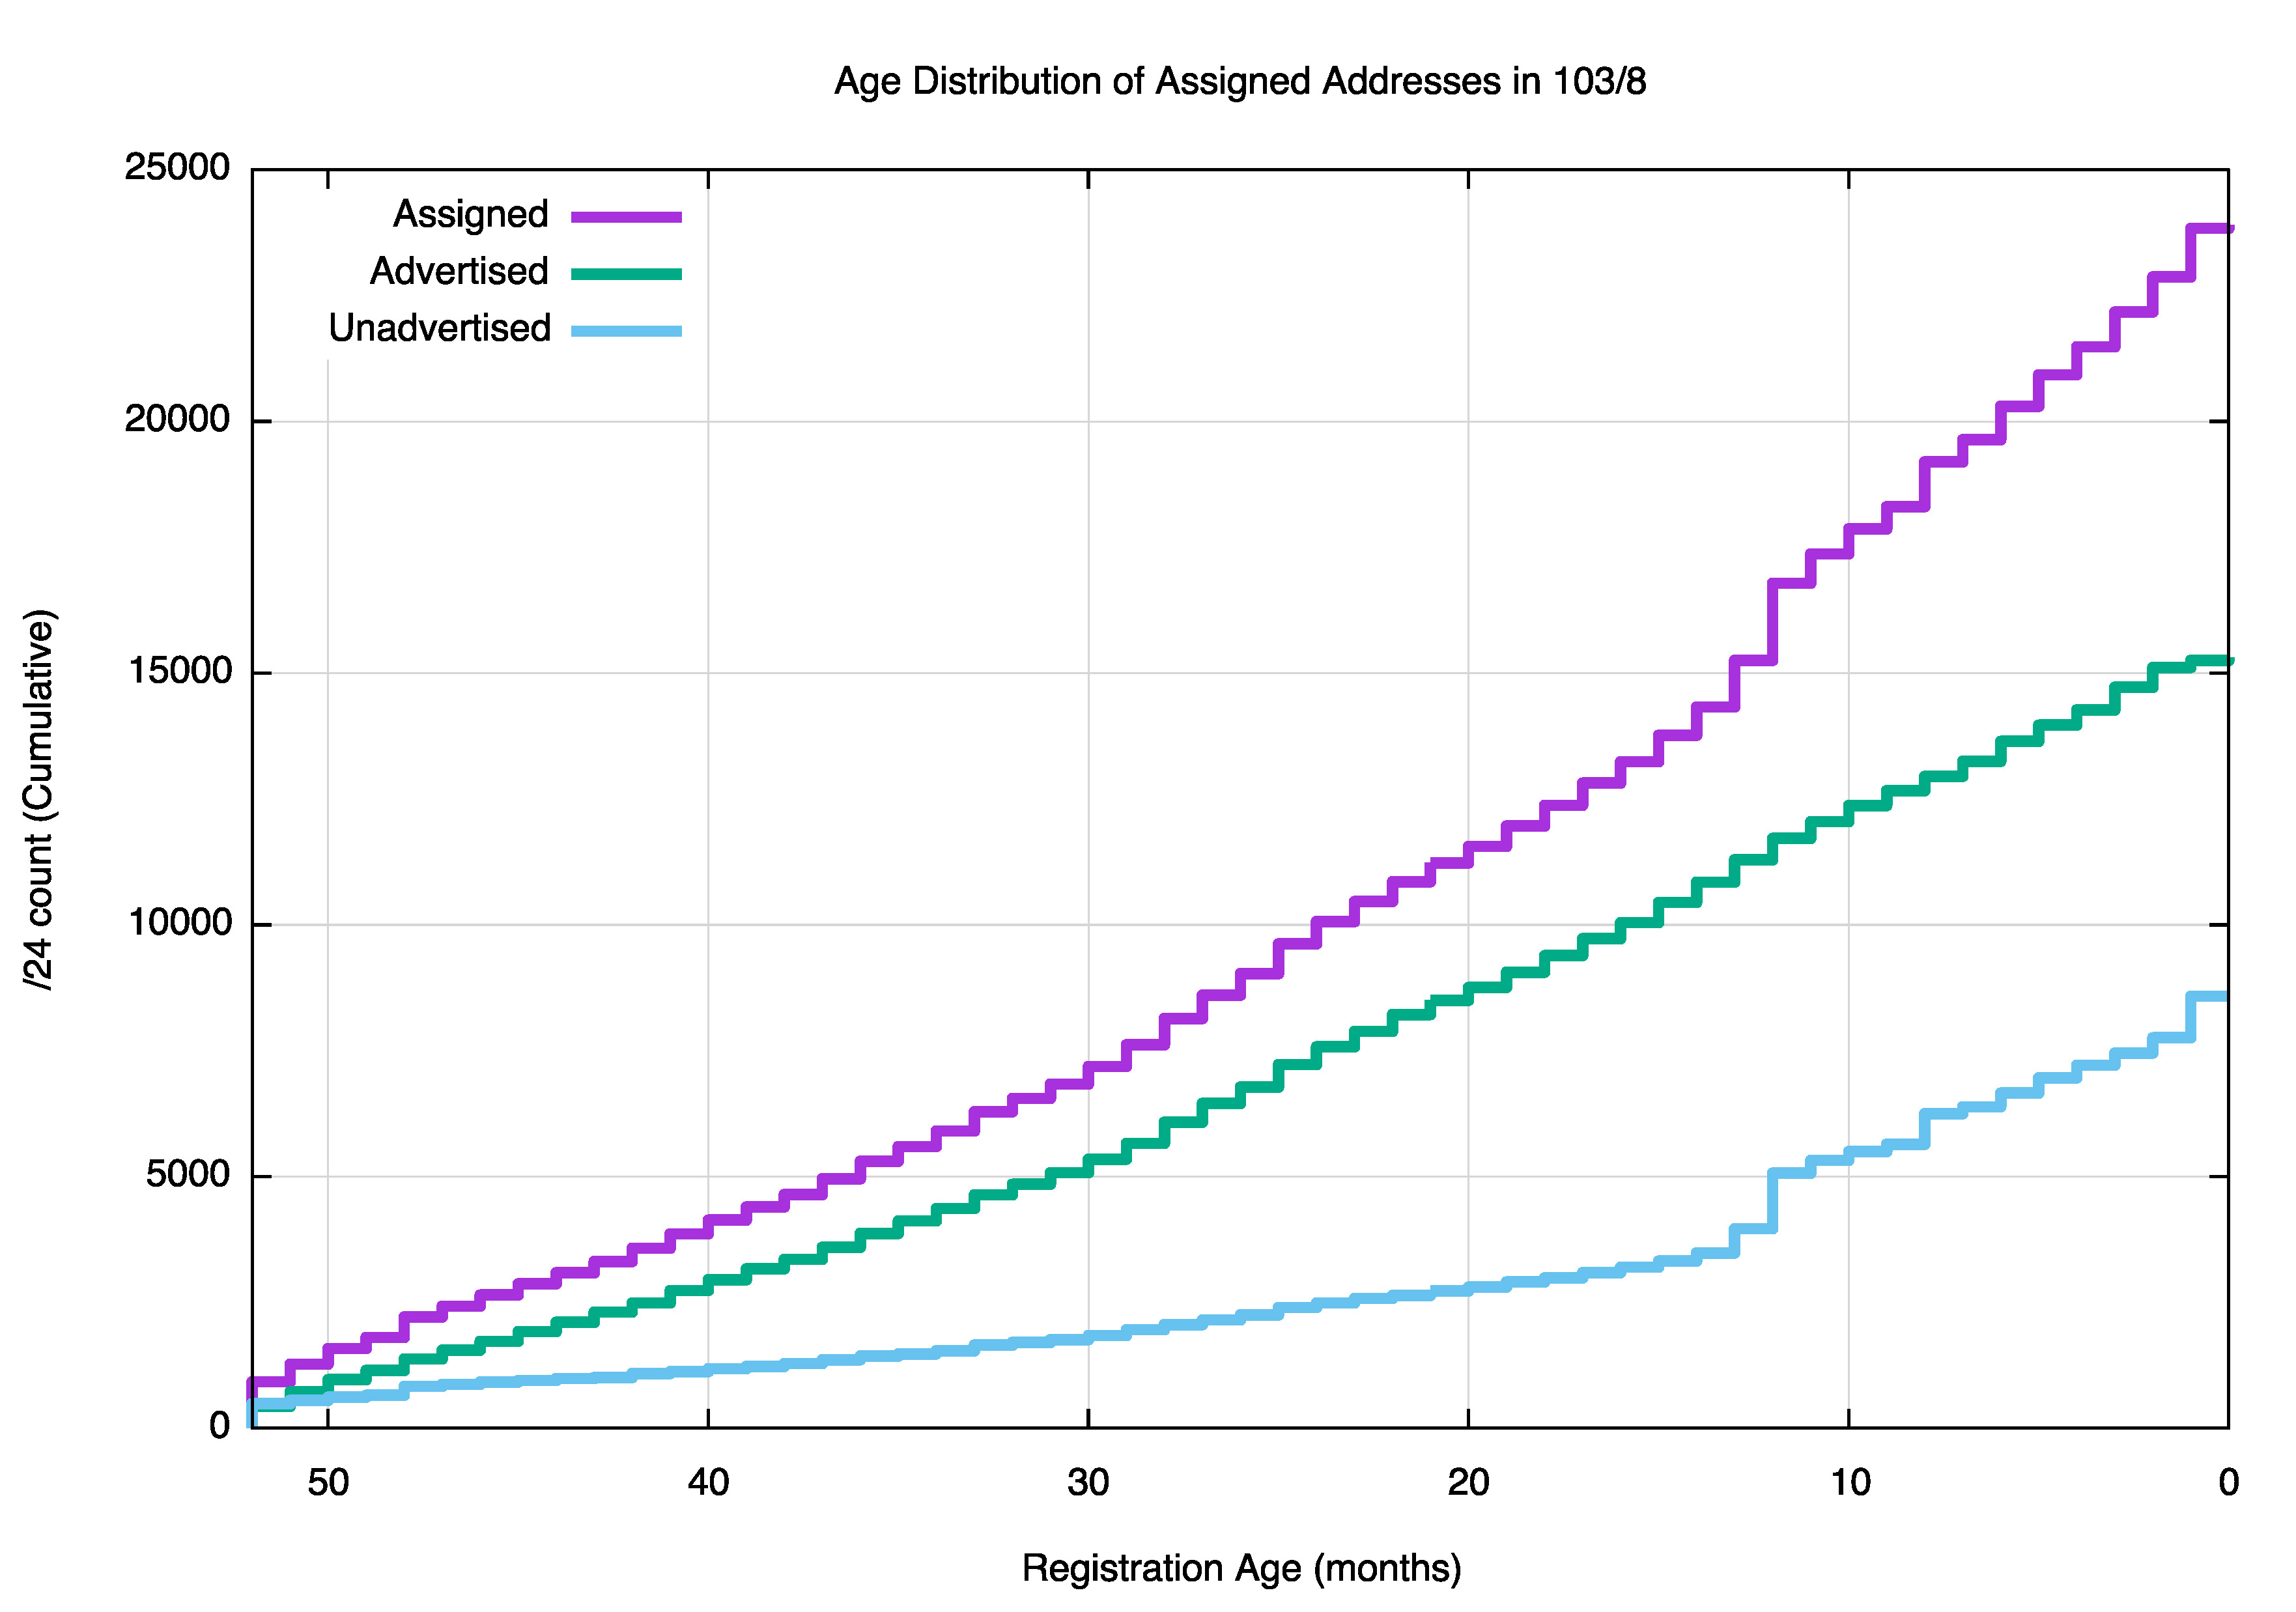
Figure 8 – Time Series of Advertised / Unadvertised Address Allocations from 103.0.0.0/8
A map of the entire /8 address space shows that the unadvertised addresses are drawn from over the entirety of the assigned 103.0.0.0/8 address space. While there is more unadvertised addresses in the most recently assigned address blocks (103.32.0.0/11 and 103.192.0.0/12), the extent of unadvertised in the older address blocks is also clearly visible in Figure 9.
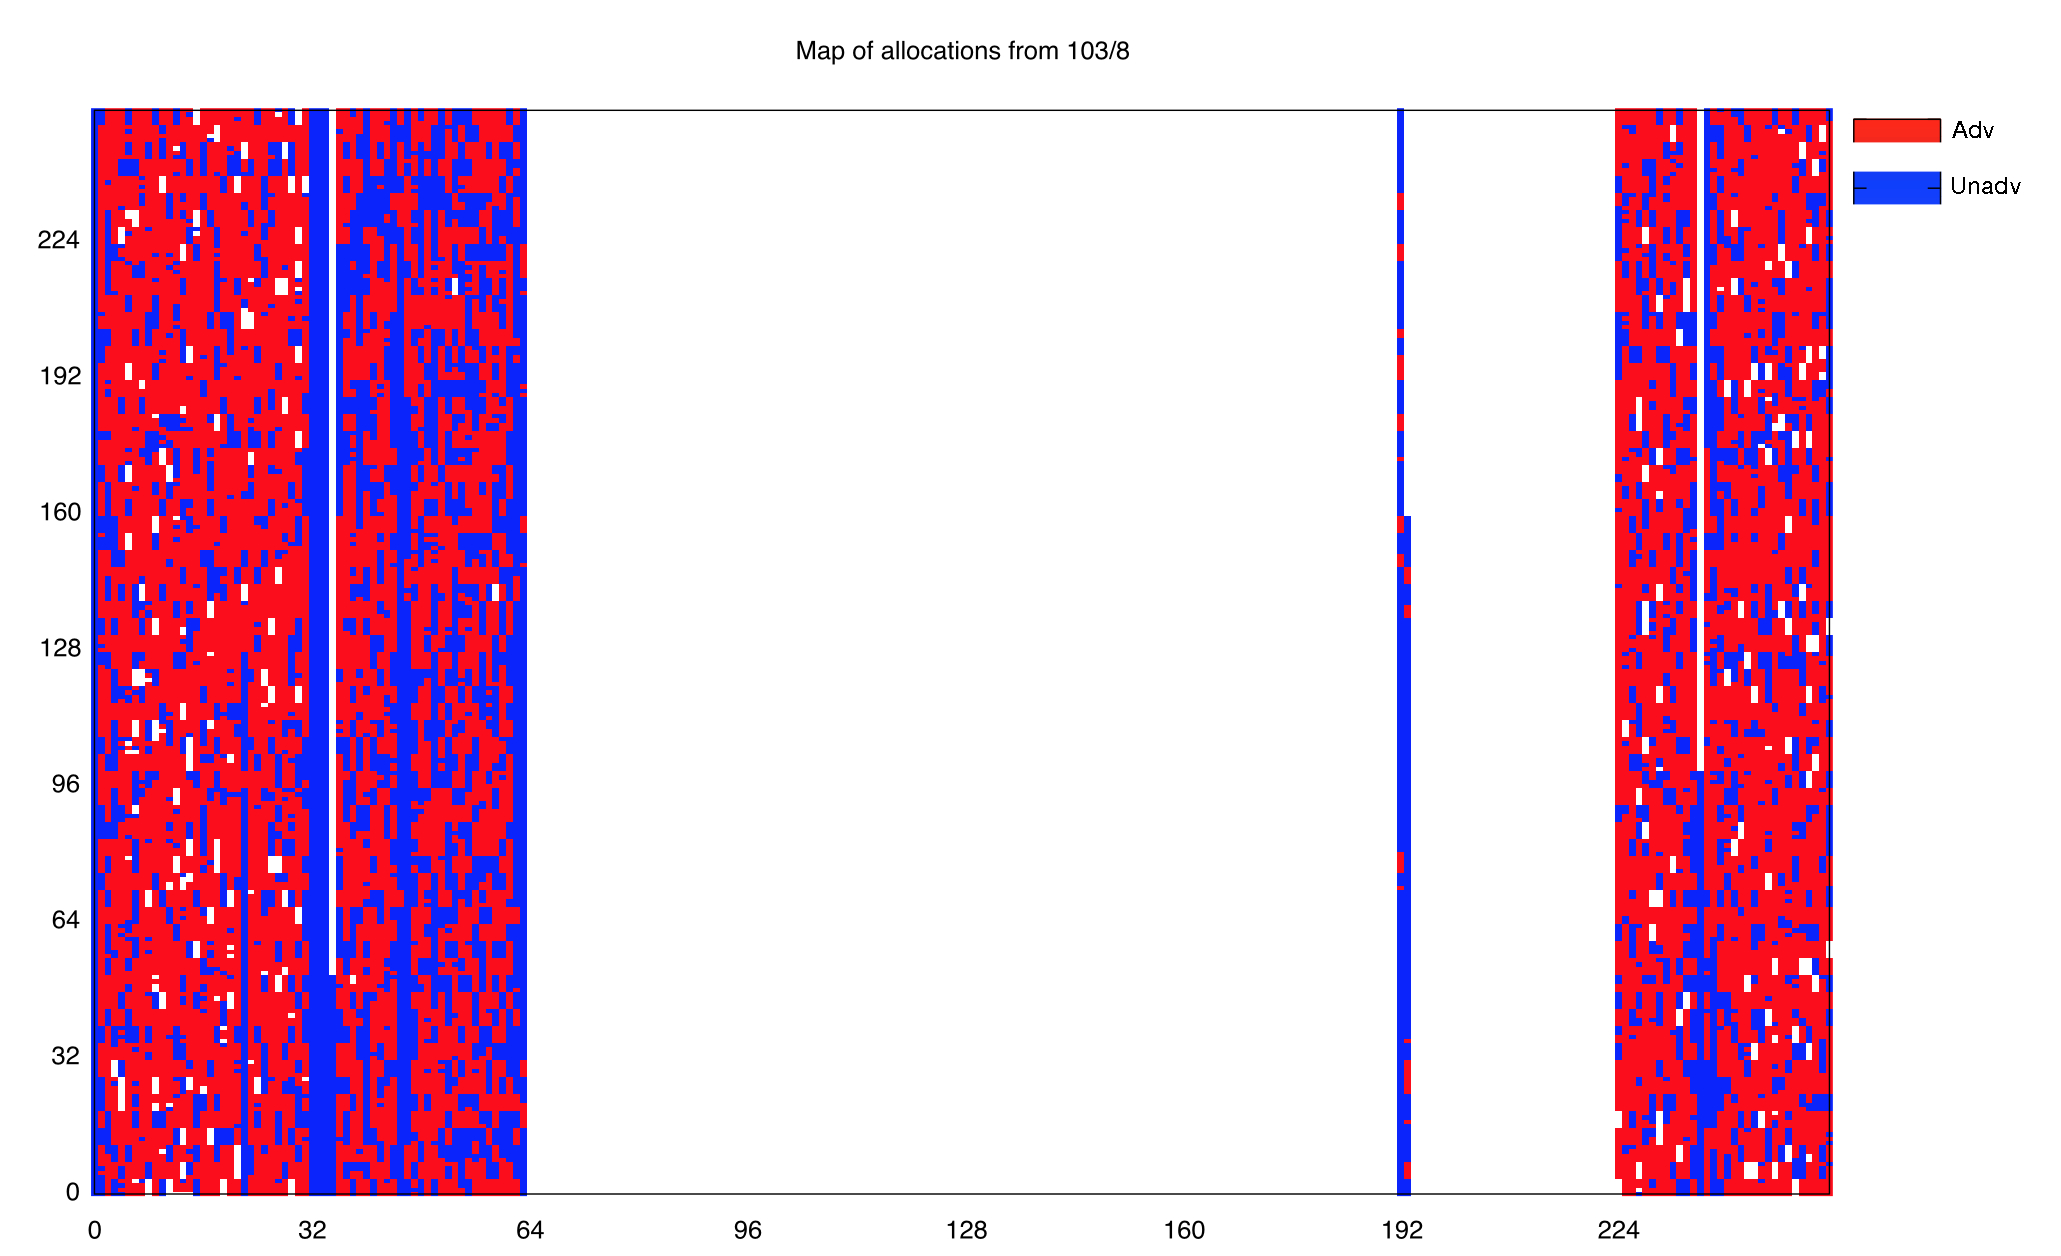
Figure 9 – Map of Advertised / Unadvertised Address Allocations from 103.0.0.0/8
The APNIC registry has 5,987 distinct entities holding address records in the registry for addresses held prior to opening up the last /8 and the IANA returned address pool, and 6,507 distinct entities that hold allocations in the last /8. Only 1,180 entities who hold allocations for pre-exhaustion addresses hold allocations from the last /8, while 5,327 entities are listed in the last /8 registry, but are not listed as holding any pre-exhaustion addresses.
If the overall objective for APNIC’s Final /8 policy was to find a mechanism for entrants, who would otherwise been pushed to an after market for addresses, to be assigned a small pool of addresses as a “last chance”, then this appears to have been the case for these 5,327 entities who have availed themselves of an allocation from this last /8.
The IANA Recovered Address Pool
The address pool of 103.0.0.0/8 is not the only pool of IPv4 addresses available for allocation by APNIC. IANA operates a “recovered address pool, and distributes addresses from this pool to the RIRs every six months. APNIC has received a number of allocations from this pool, as shown in Table 2.
| Start | End | Date |
| 43.224.0.0 | 43.231.255.255 | 2014-05 |
| 43.236.0.0 | 43.243.255.255 | 2014-05 |
| 43.245.0.0 | 43.252.255.255 | 2014-05 |
| 43.254.0.0 | 43.255.255.255 | 2014-05 |
| 45.64.0.0 | 45.65.15.255 | 2014-05 |
| 45.112.0.0 | 45.127.255.255 | 2014-09 |
| 45.248.0.0 | 45.255.255.255 | 2015-03 |
| 150.107.0.0 | 150.107.255.255 | 2014-05 |
| 150.129.0.0 | 150.129.255.255 | 2014-05 |
| 150.242.0.0 | 150.242.255.255 | 2014-05 |
| 163.47.4.0 | 163.47.18.255 | 2014-05 |
| 163.47.20.0 | 163.47.21.255 | 2014-05 |
| 163.47.32.0 | 163.47.45.255 | 2014-05 |
| 163.47.47.0 | 163.47.255.255 | 2014-05 |
| 163.53.0.0 | 163.53.255.255 | 2014-05 |
Table 2 – IANA Return Pool Address Allocations to APNIC
(from: http://www.iana.org/assignments/ipv4-recovered-address-space/ipv4-recovered-address-space.xhtml)
This pool represents a total of 3,670,016 addresses. As of the start of August 2015 2,883,584 addresses have been assigned, 104,448 are reserved and 681,984 addresses are available (Figure 10).
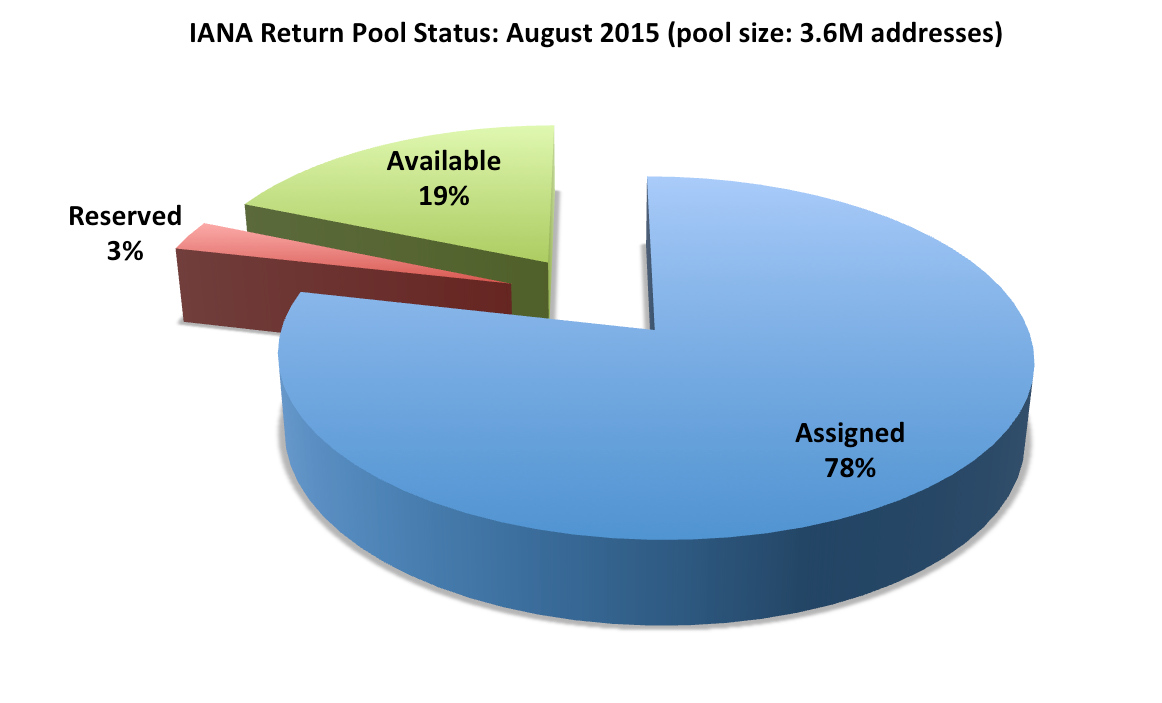
Figure 10 – Current Allocation Status of tjhe IANA Return Address Pool
The policies of allocation from this block are the same as those used for the last /8, namely that each entity can apply for a maximum of 1,024 addresses from this address pool. The distribution of allocation sizes from the APNIC statistics report is shown in Figure 11.
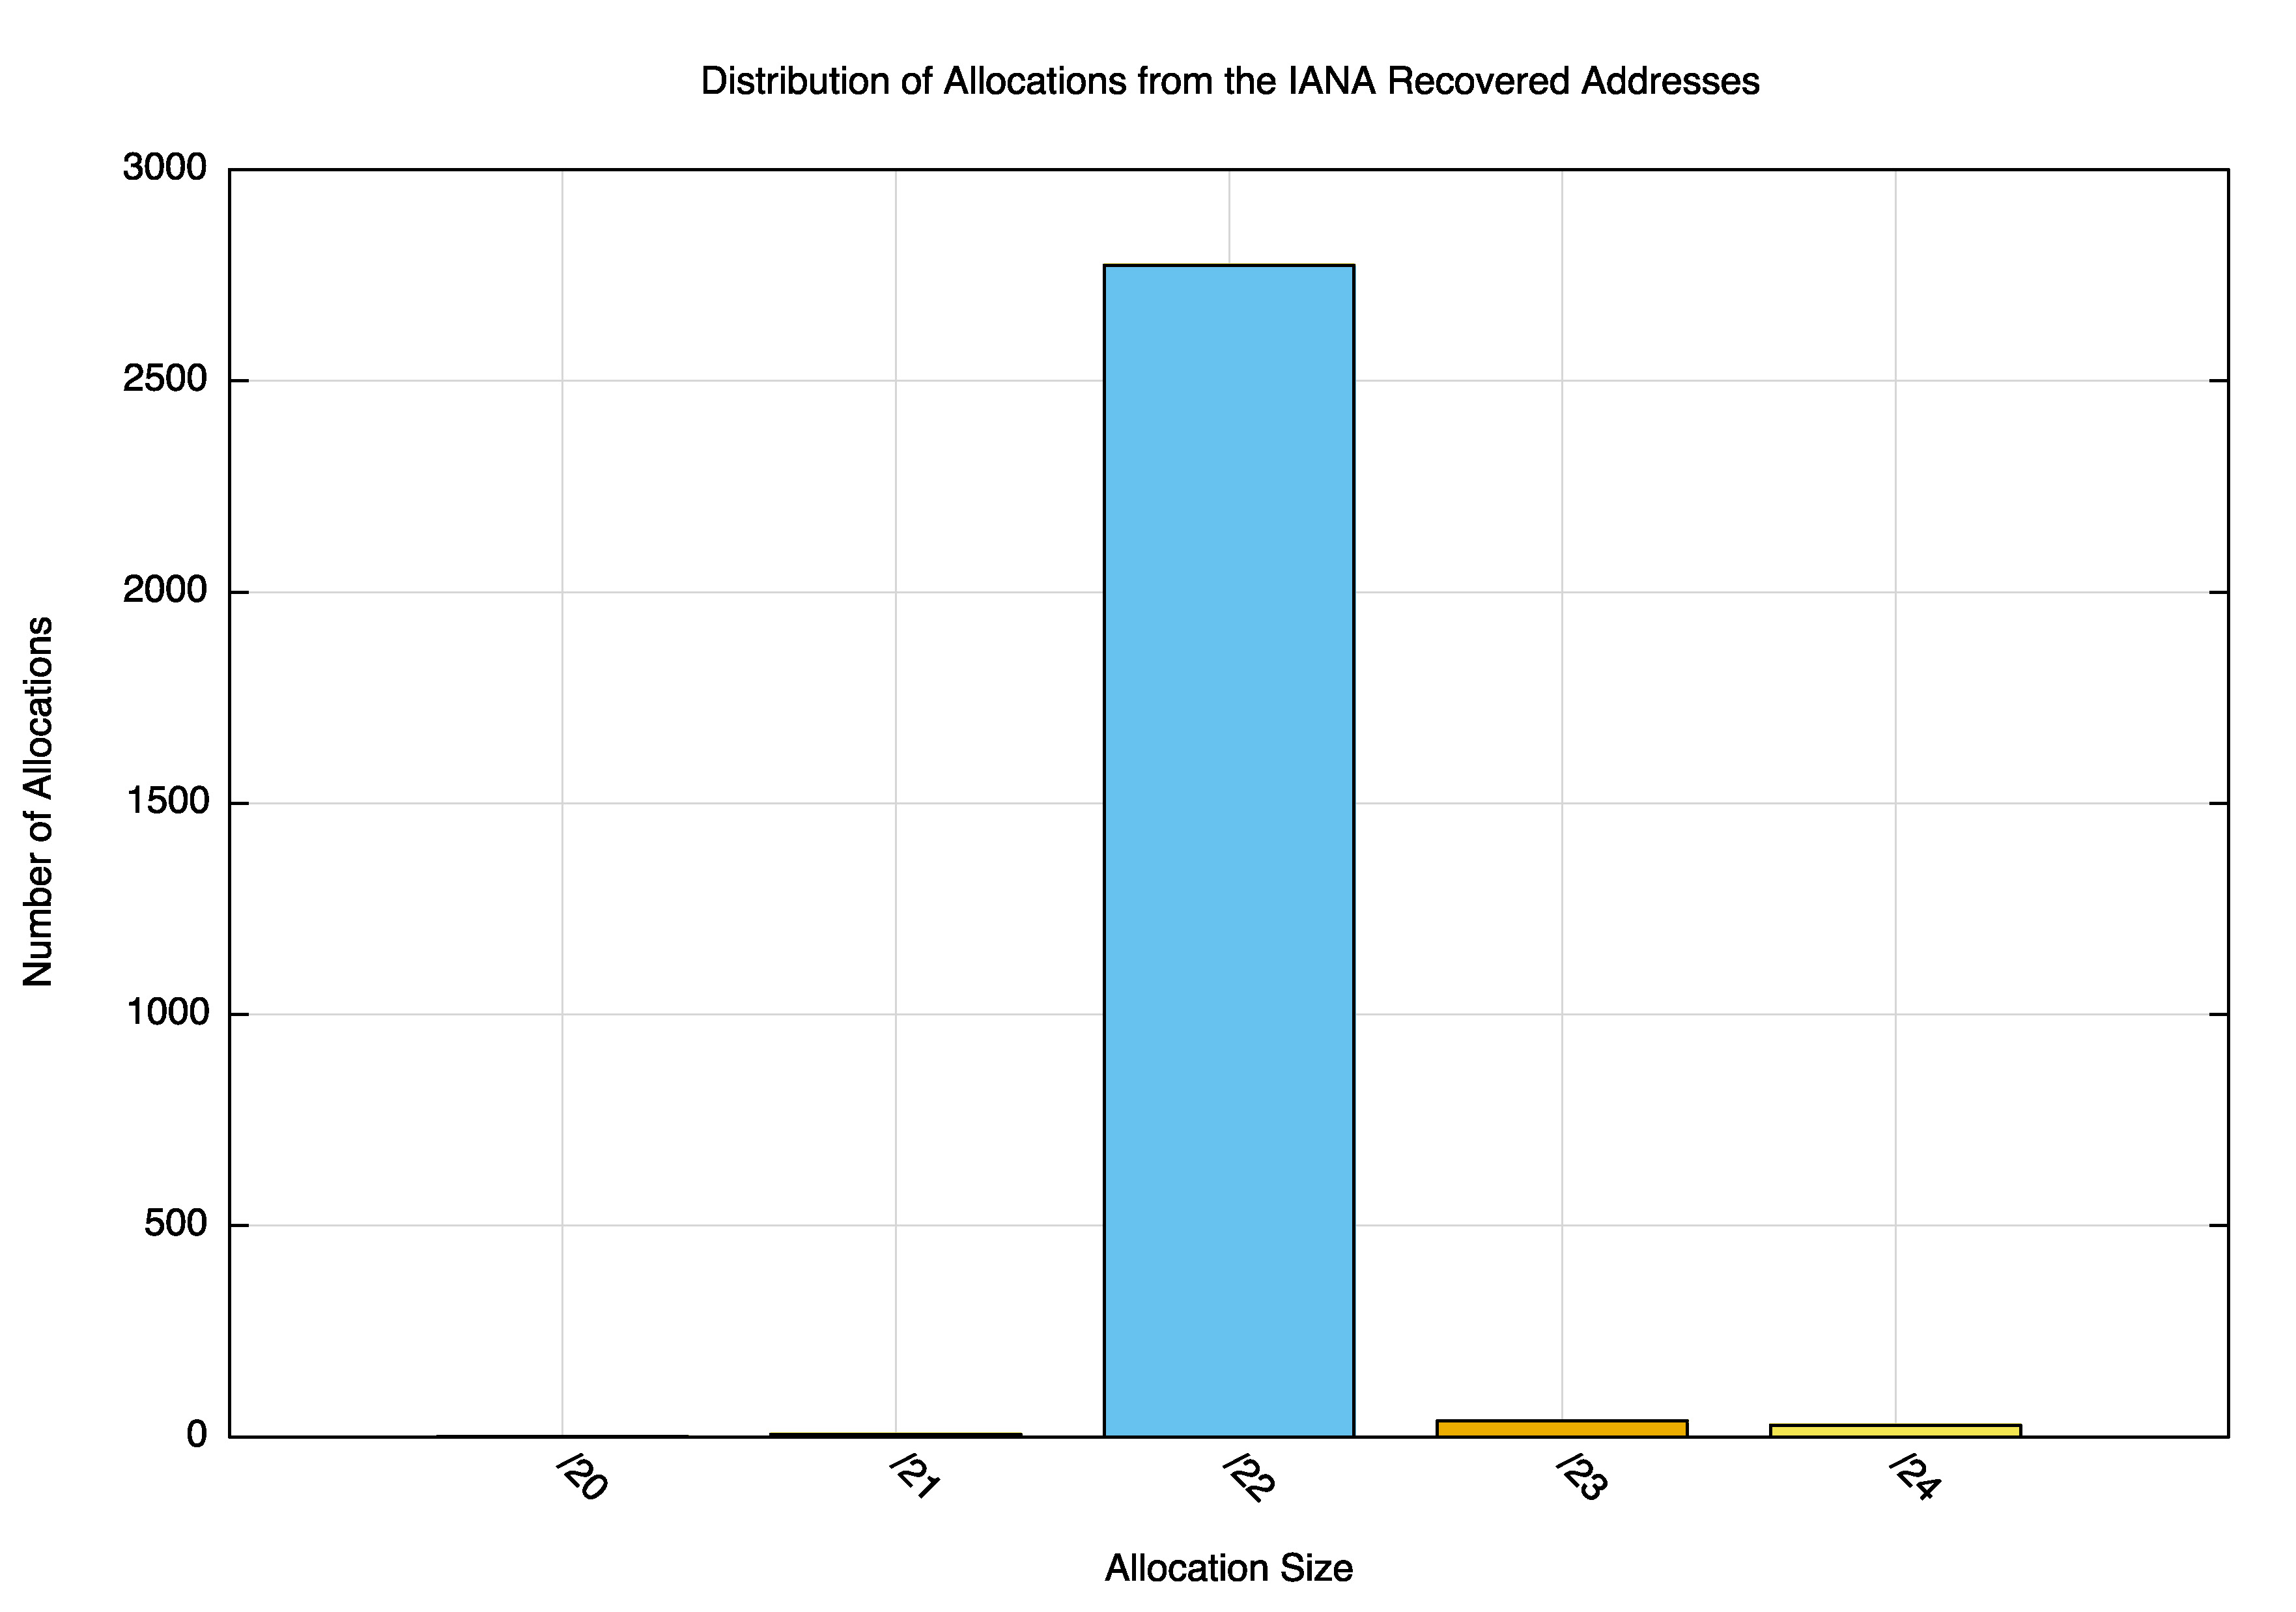
Figure 11 – Distribution of Allocations from the IANA Recovered Address Space
A comparison of this distribution with that of the last /8 is interesting. Here we see a far higher proportion of /22 allocations and very few /24 allocations. The table of allocation distributions is shown below (Table 3). Given that the policies associated with these two address pools are essentially the same, then it is not immediately obvious why the IANA return pool has so few /24 and /23 allocations.
One potential explanation for the difference here is that the address policies are similar, but not exactly the same. Allocations can only be made from the IANA return pool to existing holders of addresses, while the last /8 is open to any suitably qualified applicant. New applicants who can show a need for a /24 or a /23 can obtain an allocation from the last /8, but not from the IANA return pool. This implies that applicants who want a small number of addresses to support a service delivery infrastructure would be supported with a single /24 allocation from the last /8 and would not necessarily have the necessary justification for a second allocation from the IANA Return pool.
| Allocation Size | Last /8 Pool | IANA Returns Pool | ||
| /24 | 1,139 | 16.1% | 28 | 1.0% |
| /23 | 664 | 9.4% | 38 | 1.3% |
| /22 | 5,282 | 74.5% | 2,774 | 97.4% |
| /21 | 4 | 0.1% | 6 | 0.2% |
| /20 | 1 | 0.0% | 1 | 0.0% |
| Total | 7,090 | 2,847 | ||
The per-country distribution of allocations from both address blocks is shown in Figure 12.
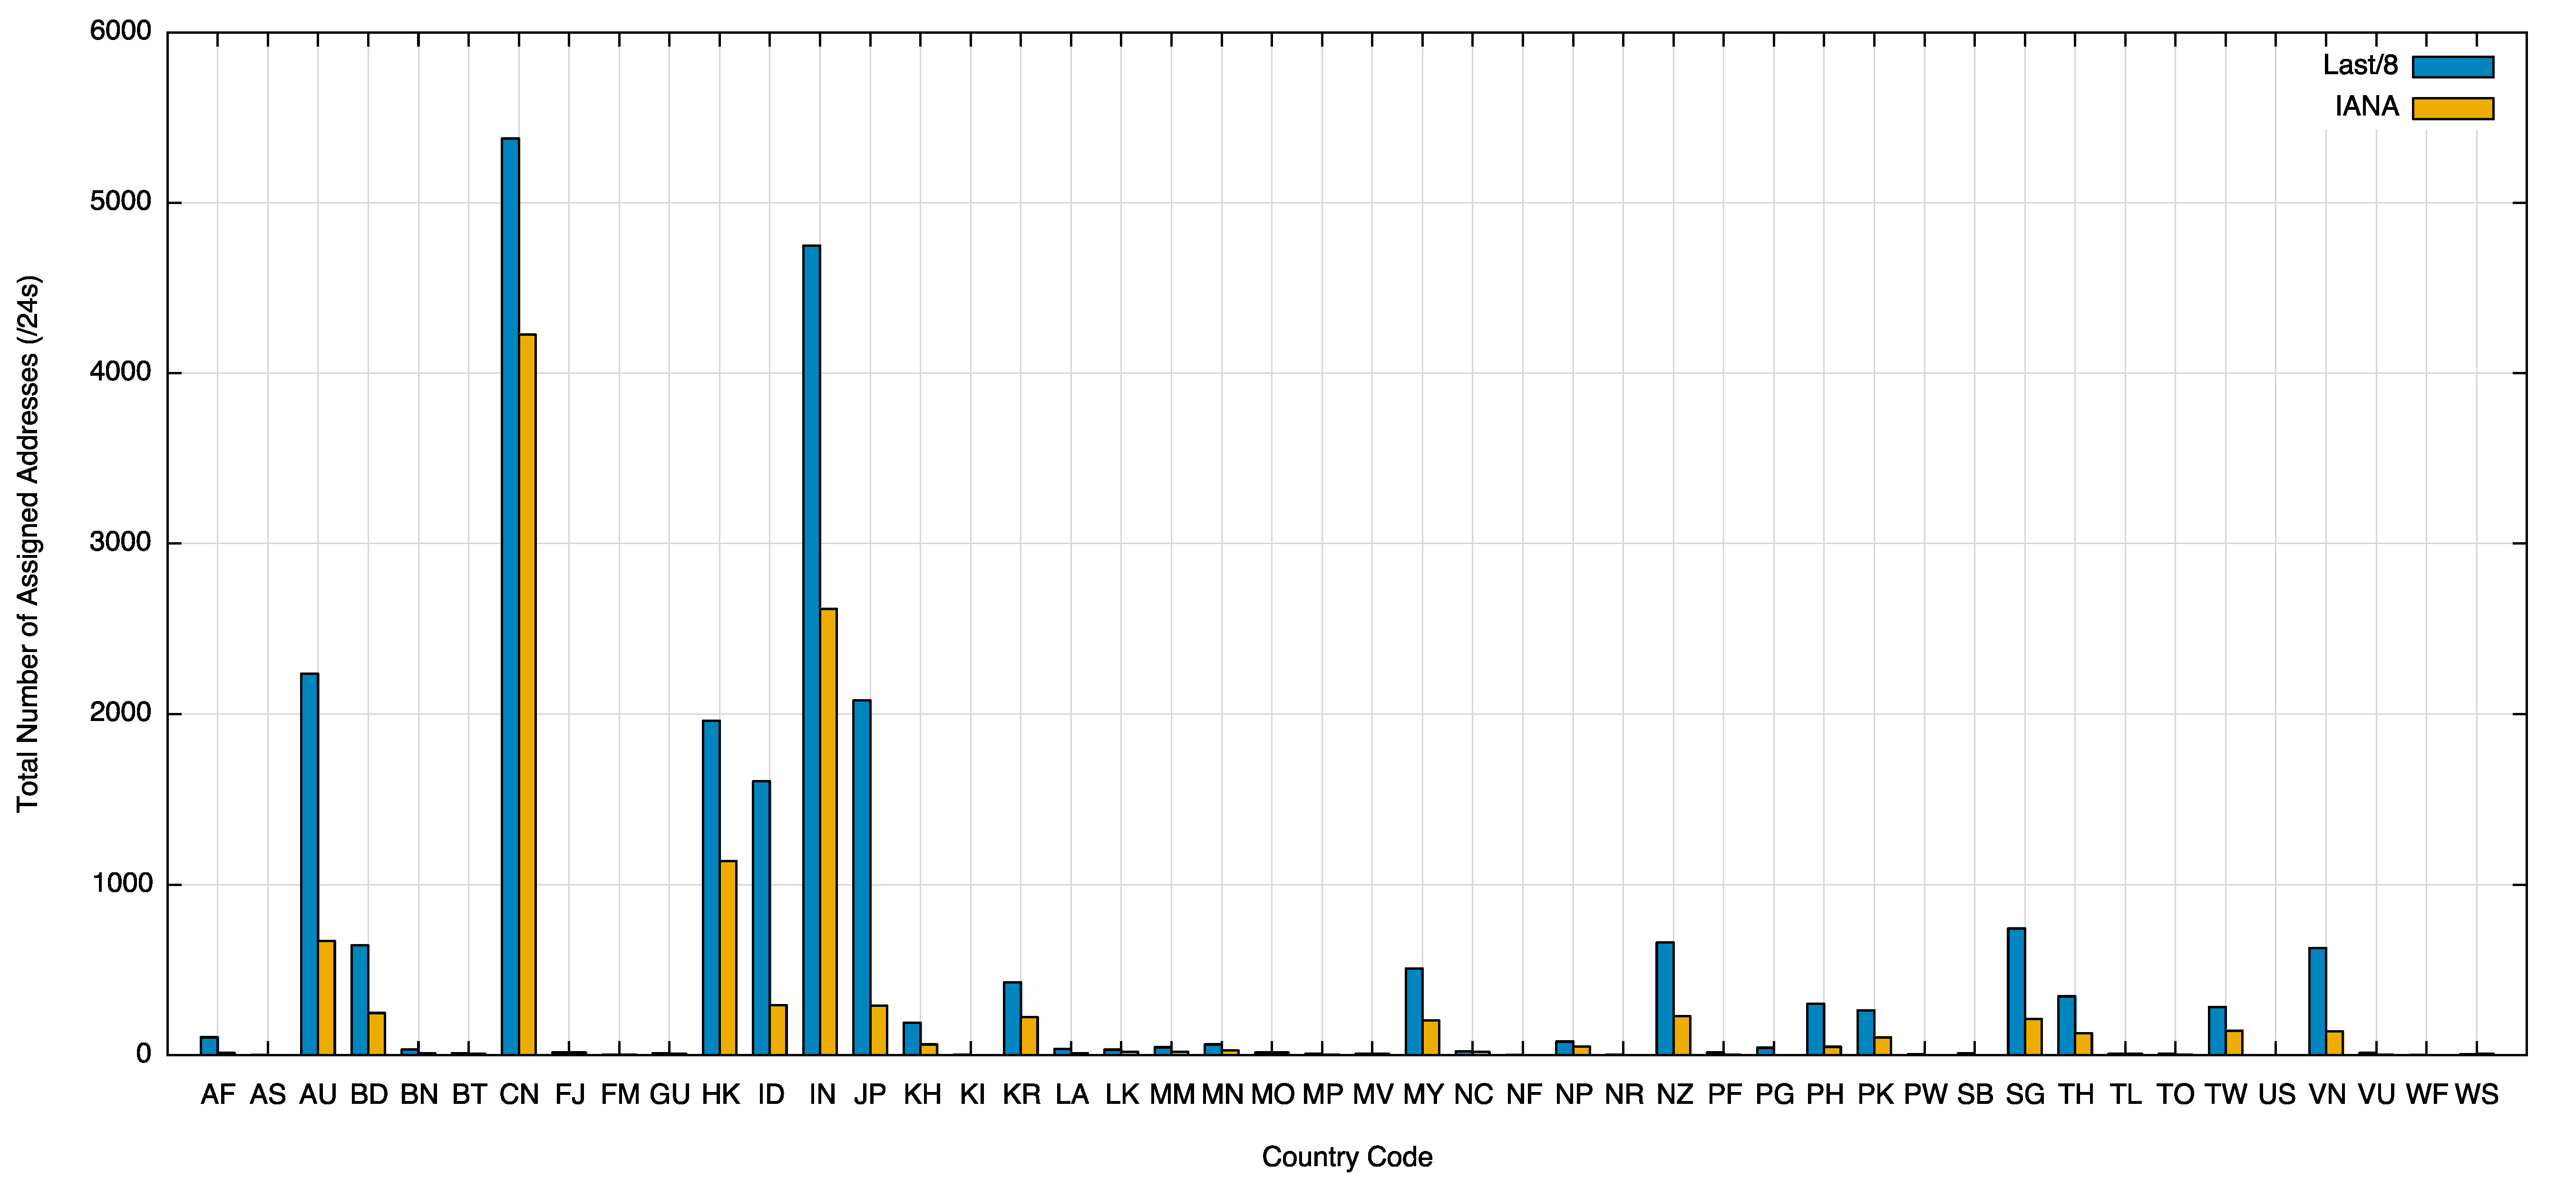
Figure 12 – Per-Country Distribution of Allocations from the last /8 and the IANA Recovered Address Space
The two data sets are relatively consistent, in that national communities that have made use of the Last /8 allocations have also made use of the returned IANA pool allocations. China and Hong Kong show a strong correlation between Last /8 and IANA Return allocations, while this is not as evident in Australia, India Japan or Indonesia.
The picture of advertised and unadvertised addresses between these two blocks is somewhat different. While some two thirds of the last /8 assigned address blocks are visible in the routing system, this drops to less that one half of the assigned blocks from the recovered IANA space.
| Last /8 | IANA Returned | |
| Advertised | 4,037,376 | 1,334,528 |
| UnAdvertised | 2,015,232 | 1,549,056 |
| Total | 6,052,608 | 2,883,584 |
Table 4 – Advertised and Unadvertised address counts
The relatively low level of advertisement of these allocations is certainly a cause for some level of concern about the efficacy of this allocation policy. If the intent of the policy was to retain a small pool of addresses to meet the immediate needs of a set of “late comers” with public addresses to be used on the public side of NATS, and to allow services to use named certificates for transport security that don't require SNI capacities in clients, then we would expect that applicants would hold off until they had an immediate operational requirement. However a significant proportion of applications are apparently acting in a somewhat more opportunistic manner, and obtaining addresses from these exhaustion pools well in advance of any particular operational requirement.
Finally, we can look at the distribution of entities who hold address records in the pre-exhaustion address space, in the last /8 and in this IANA returned space (Table 5).
| Pre-Exhaustion | Last /8 | IANA Return | Count |
| ✔ | 4,803 | ||
| ✔ | 3,051 | ||
| ✔ | ✔ | 671 | |
| ✔ | 14 | ||
| ✔ | ✔ | 4 | |
| ✔ | ✔ | 2,276 | |
| ✔ | ✔ | ✔ | 509 |
| 5,987 | 6,507 | 2,803 | 11,328 |
Table 5 – Entities and their address holdings in the Pre- and Post- Exhaustion Address Pools
Of the 5,987 entities holding addresses prior to APNIC’s exhaustion of general use addresses, 1,184 entities have been allocated additional addresses from the post-exhaustion address pools. A further 5,327 entities who did not already have an address allocation from the pre-exhaustion address pools have availed themselves of a last /8 allocation. Of these entities almost one half, or 2,276 entities, have also been allocated an address block from the returned IANA pool in addition to the allocation from the last /8.
The After-Market in Addresses and the Address Transfer Registry
Address exhaustion imposes a fundamental constraint that there are simply not enough addresses to meet demand. The policy position taken by the APNIC regional Address Policy Community is one that is effectively a rationing framework, where each party’s demands from the remaining resource pool is limited to a common ceiling (in this case a ceiling of 2,048 addresses).
If parties have a need to obtain a larger number of addresses than this ceiling, then they inevitably must turn to the aftermarket, where the relative levels of intensity of demand and volumes of supply are matched through a market’s pricing function.
This cannot be sustained indefinitely, and if the current levels of demand for IPv4 addresses continues, then APNIC's available pool of addresses can only hold out for the next 24 - 30 months. At that point there will only be the address market, assuming of course that there is still residual demand for IPv4 addresses. Which means that we probably should turn our attention to understanding how this market is operating, and update our expectations around the momentum of deployment of IPv6.
I’ll look at the visible part of this address aftermarket, through the contents of the APNIC Transfer Registry in the next article.
![]()
About the Author
Geoff Huston B.Sc., M.Sc., is the Chief Scientist at APNIC, the Regional Internet Registry serving the Asia Pacific region. He has been closely involved with the development of the Internet for many years, particularly within Australia, where he was responsible for building the Internet within the Australian academic and research sector in the early 1990’s. He is author of a number of Internet-related books, and was a member of the Internet Architecture Board from 1999 until 2005, and served on the Board of Trustees of the Internet Society from 1992 until 2001. He has worked as a an Internet researcher, as a ISP systems architect and a network operator at various times.
Disclaimer
The above views do not necessarily represent the views of the Asia Pacific Network Information Centre.
![]()