|
The ISP Column
A column on things Internet
|
|
|
Other Formats:
|
|
|
|
|
What's So Special about 512?
September 2014
Geoff Huston
The 12th August 2014 was widely reported as a day when the Internet collapsed. Despite the sensational media reports the following day, the condition was not fatal, and perhaps it could be more reasonably reported that some parts of the Internet were having a bad hair day.
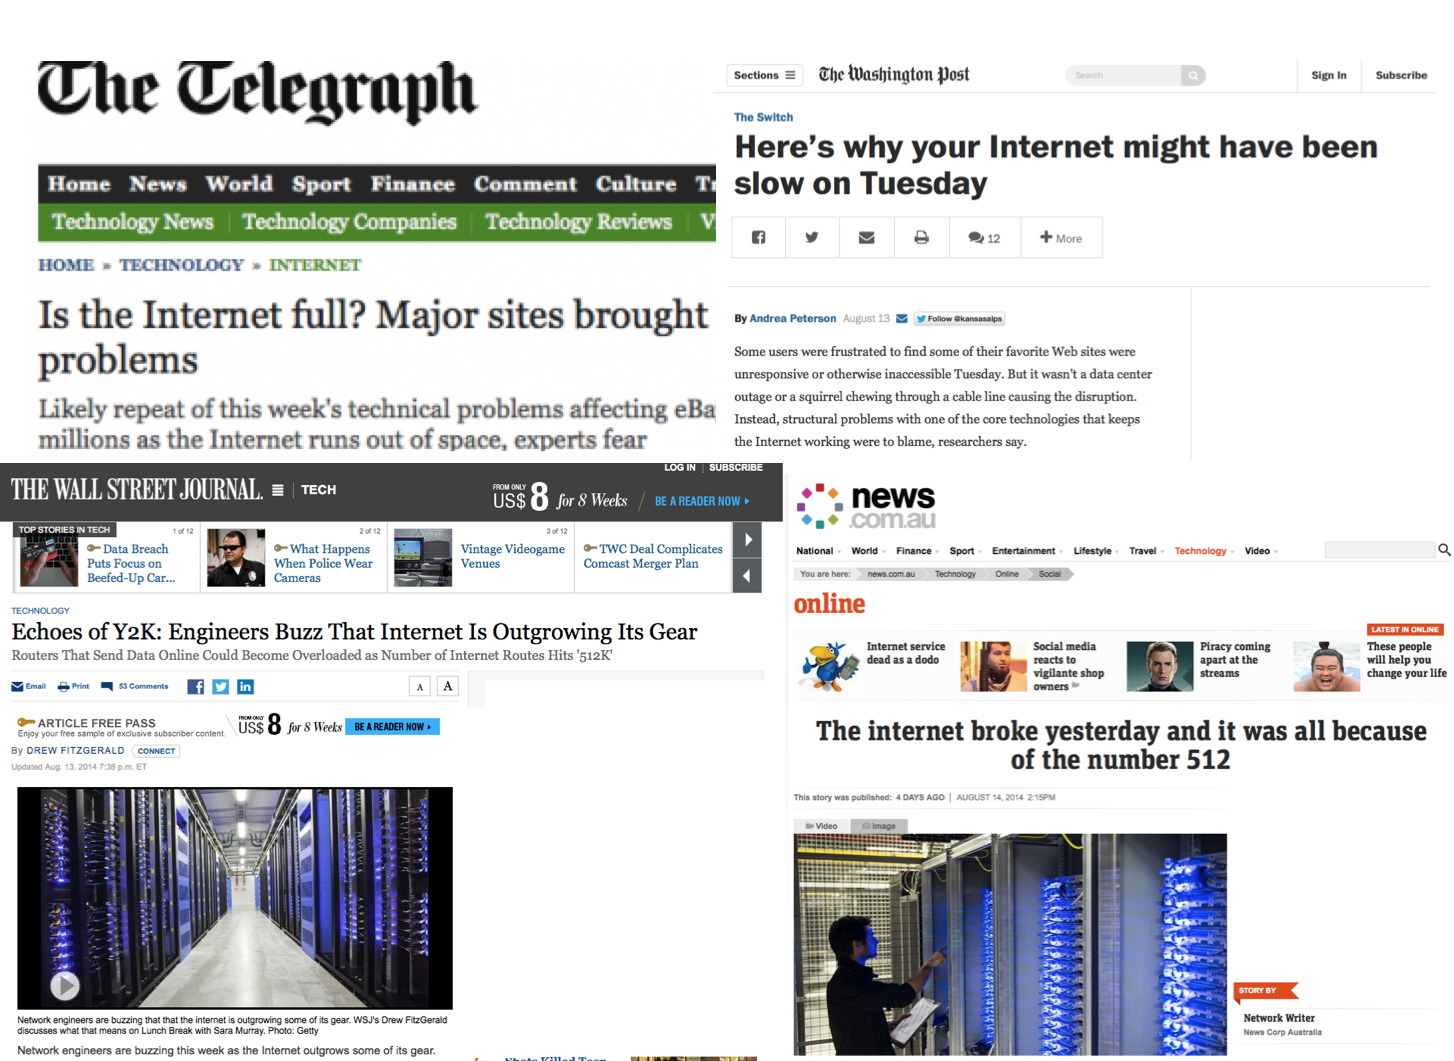
Figure 1: Media Reports about the Internet’s Routing Table hitting 512K entries
What was happening was that the Internet’s growth had just exceeded the default configuration limits of certain models of network switching equipment. In this article I'll review the behaviour of the Internet's routing system, and then look at the internal organization of packet switching equipment and see how the growth of the routing table and the scaling in the size of transmission circuits impacts on the internal components of network routing equipment.
12th August 2014
But first, lets look at the events in routing on the 12th August, by using a detailed analysis of the routing updates that were seen by a local BGP router. Figure 2 shows a detailed analysis of the behaviour of the routing system for the 24 hour period. The number of BGP prefix announcements in each 5 minute interval is shown in green, and the number of prefix withdrawals for the same period is shown in red. The net of updates and withdrawals is shown in blue, and the cumulative change in the size of the forwarding table (the total count of prefixes announced in the inter-domain default-free zone of the Internet) is shown in brown.
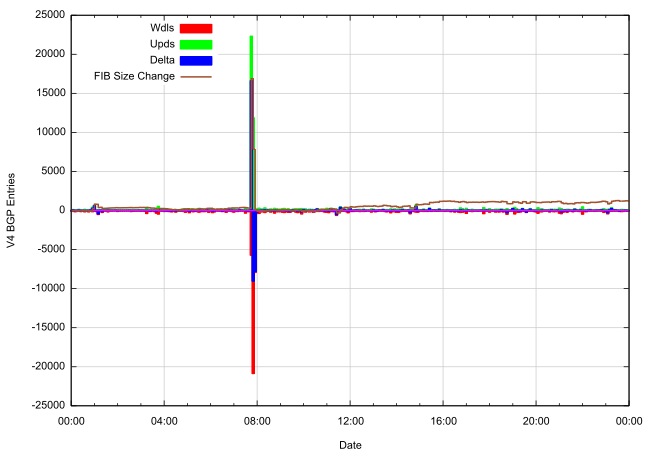
Figure 2: BGP Update Profile for 12th August 2014
What dominates this picture is the spike that occurred a few minutes before 0800 UTC on that day, when the Internet was flooded with what appears from the graph to be 22,000 new prefixes, which were withdrawn very rapidly thereafter. All these routes shared a common origin, AS 701, and were all more specifics of already announced aggregate routes. The announcements were short-lived, and were withdrawn soon after their announcement. The most likely explanation of this event was a "route leak" where routing detail that was internal to this network was inadvertently leaked into the larger inter-AS routing space, either as a result of a filter reset or a BGP community tag failure, or other forms of transient failure within the network's route control apparatus.
Is this an uncommon event? Unfortunately, it’s relatively common. It appears that if you look closely at the behaviour of the inter-domain routing system across any week in the Internet some route leaks appear to be evident. For example, in the first week of September we saw two separate route leak incidents, both involving a very short term leak of some 2,000 prefixes (Figure 3).
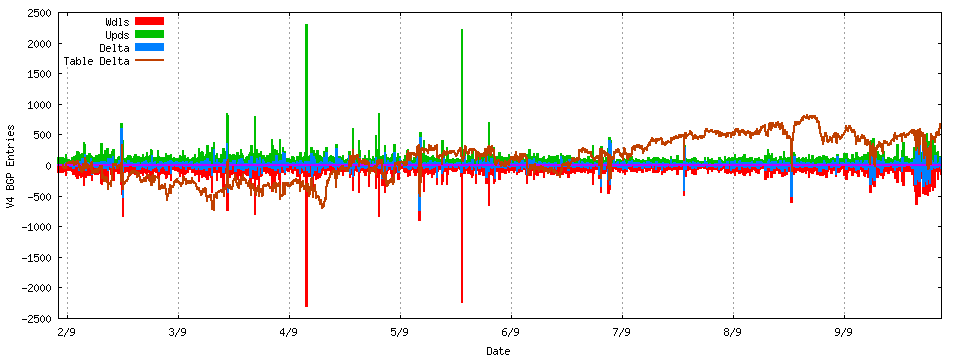
Figure 3: BGP Update Profile: 2 – 9 September 2014
However, 22,000 routes is a significant leak, and if the press reports are any guidance, then something did happen. Or maybe not. Let’s see if we can focus attention in a bit into the leak and see if there are further details that can be found. We’ll stay with a view collected from a BGP speaker in AS131072.
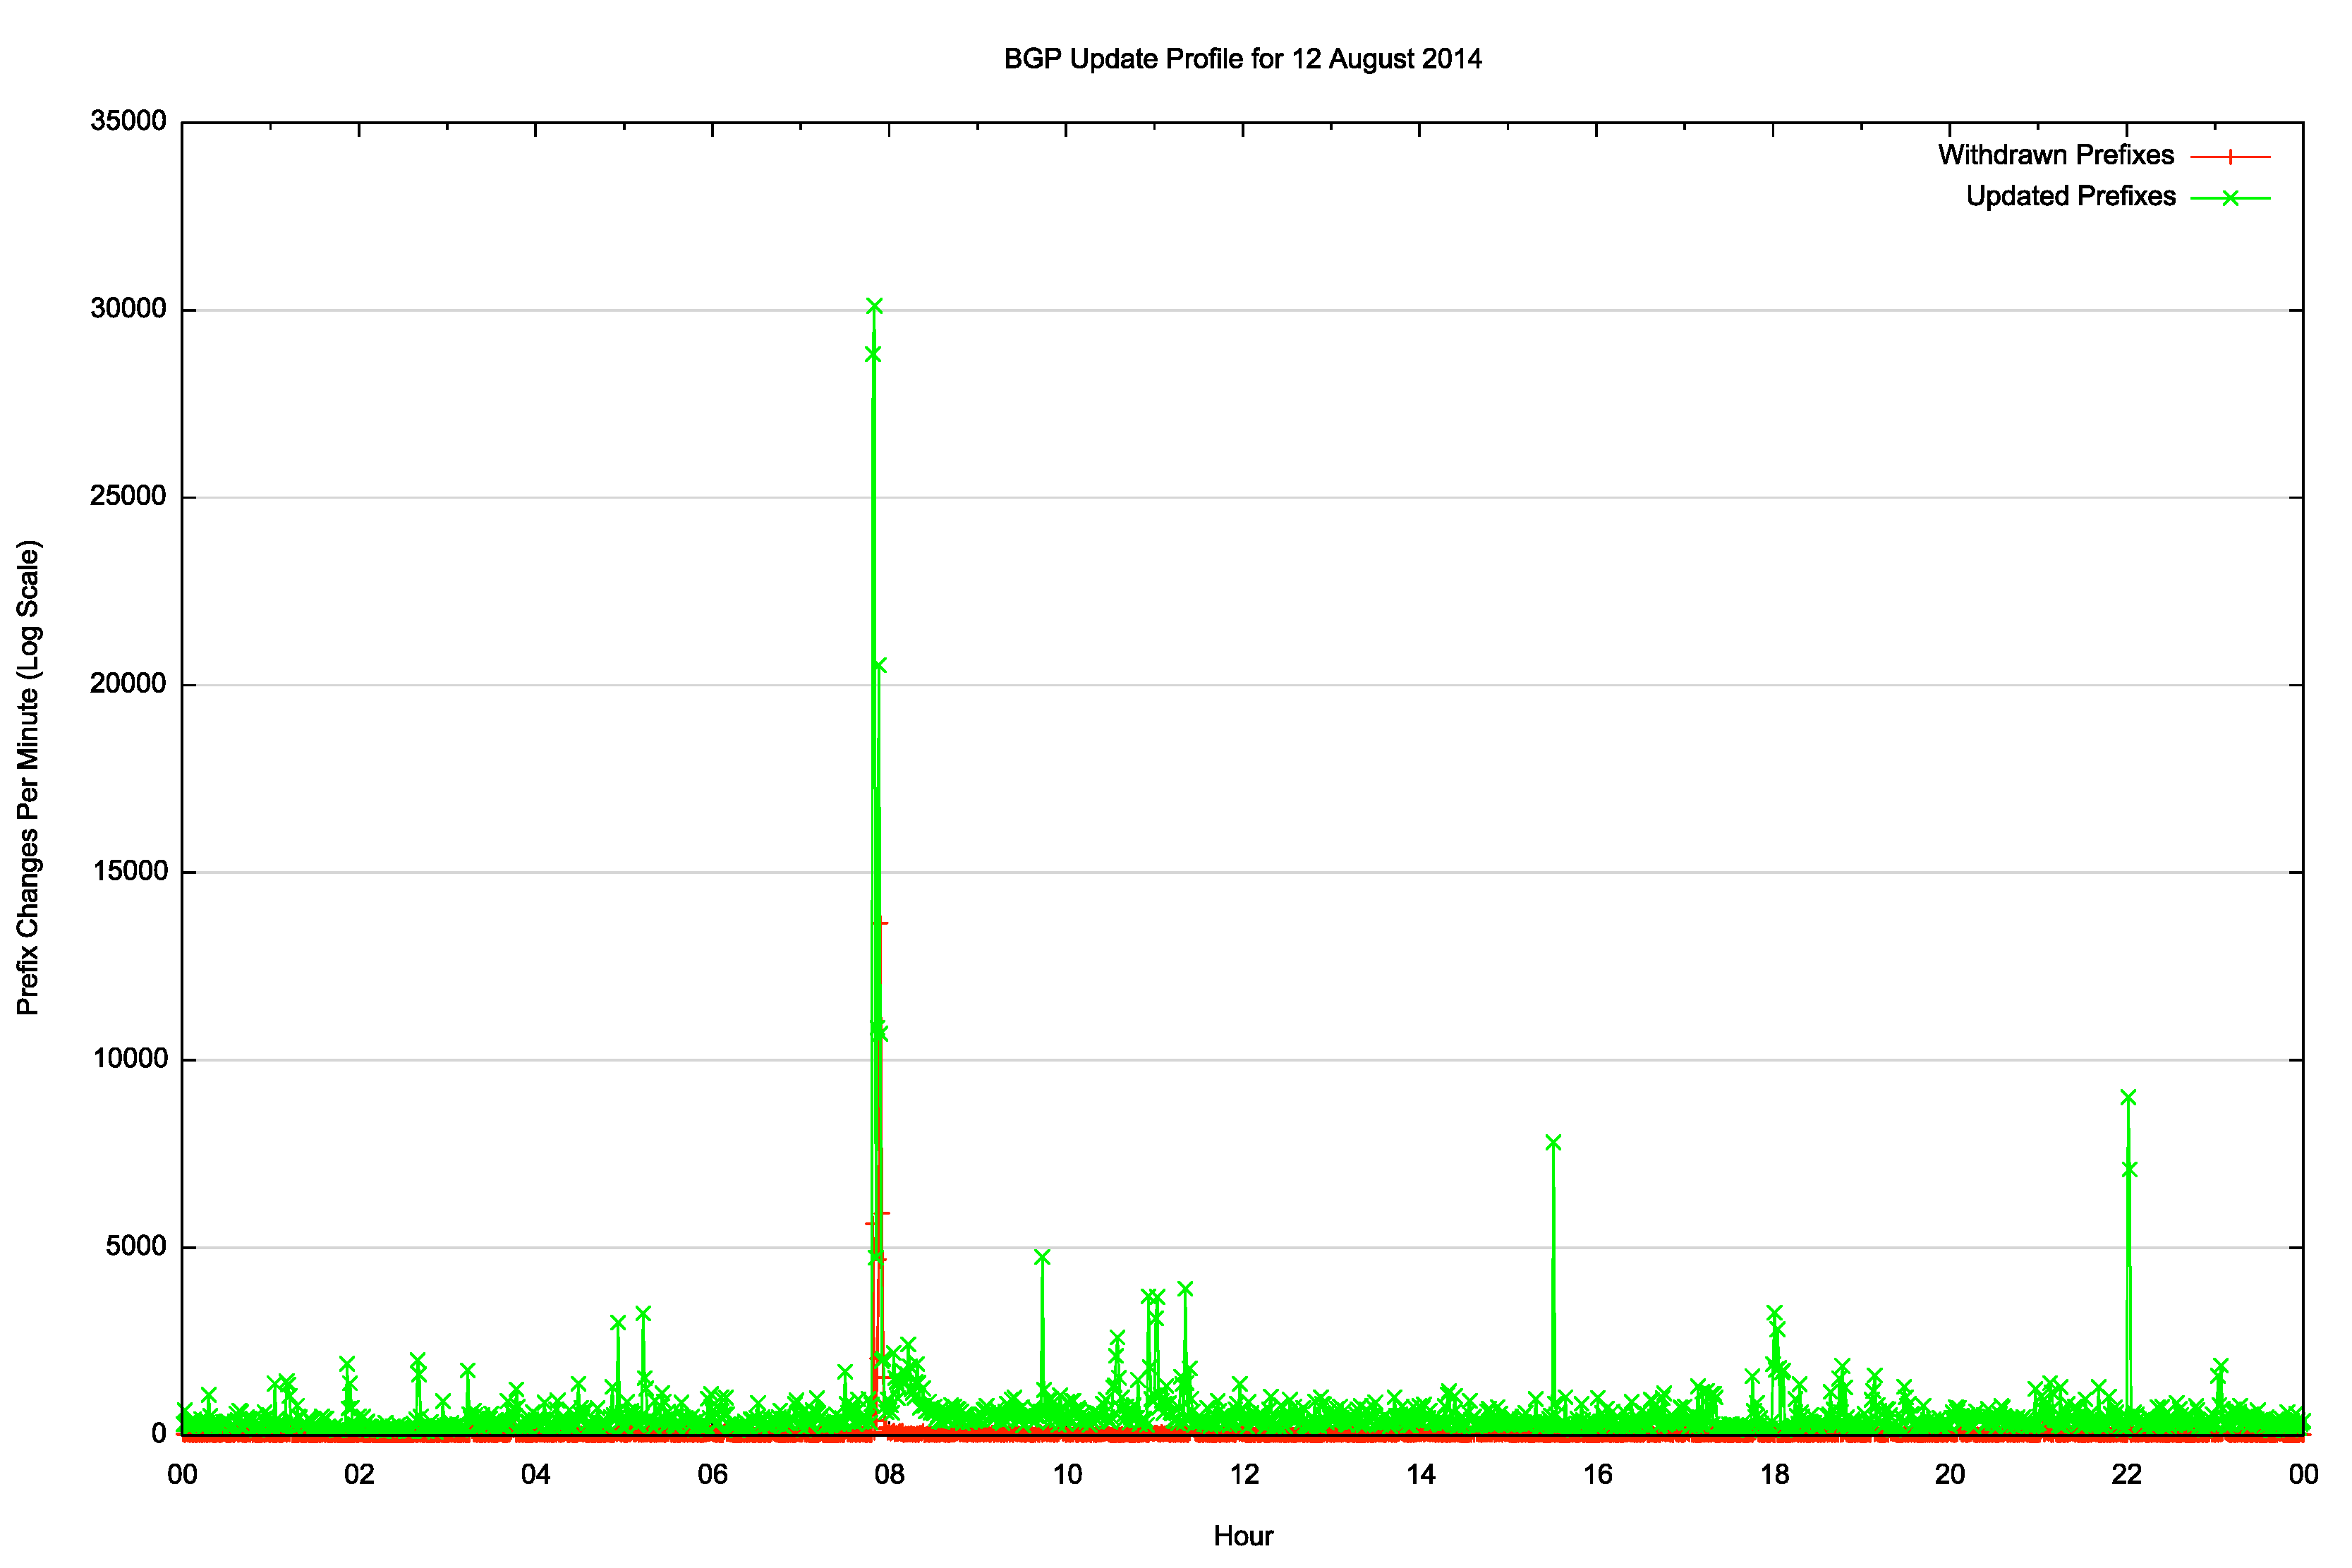
Figure 4: 5 minute BGP Update Profile: 12 August 2014
Figure 4 shows the day using a 5 minute count of BGP protocol activity for the day, and its clear from this picture that there was a large spike of activity in the period just before 0800. What impact did this have on the routing table size? Lets look at those minutes before 0800, looking at the BGP update activity on a second-by-second basis (Figure 5)
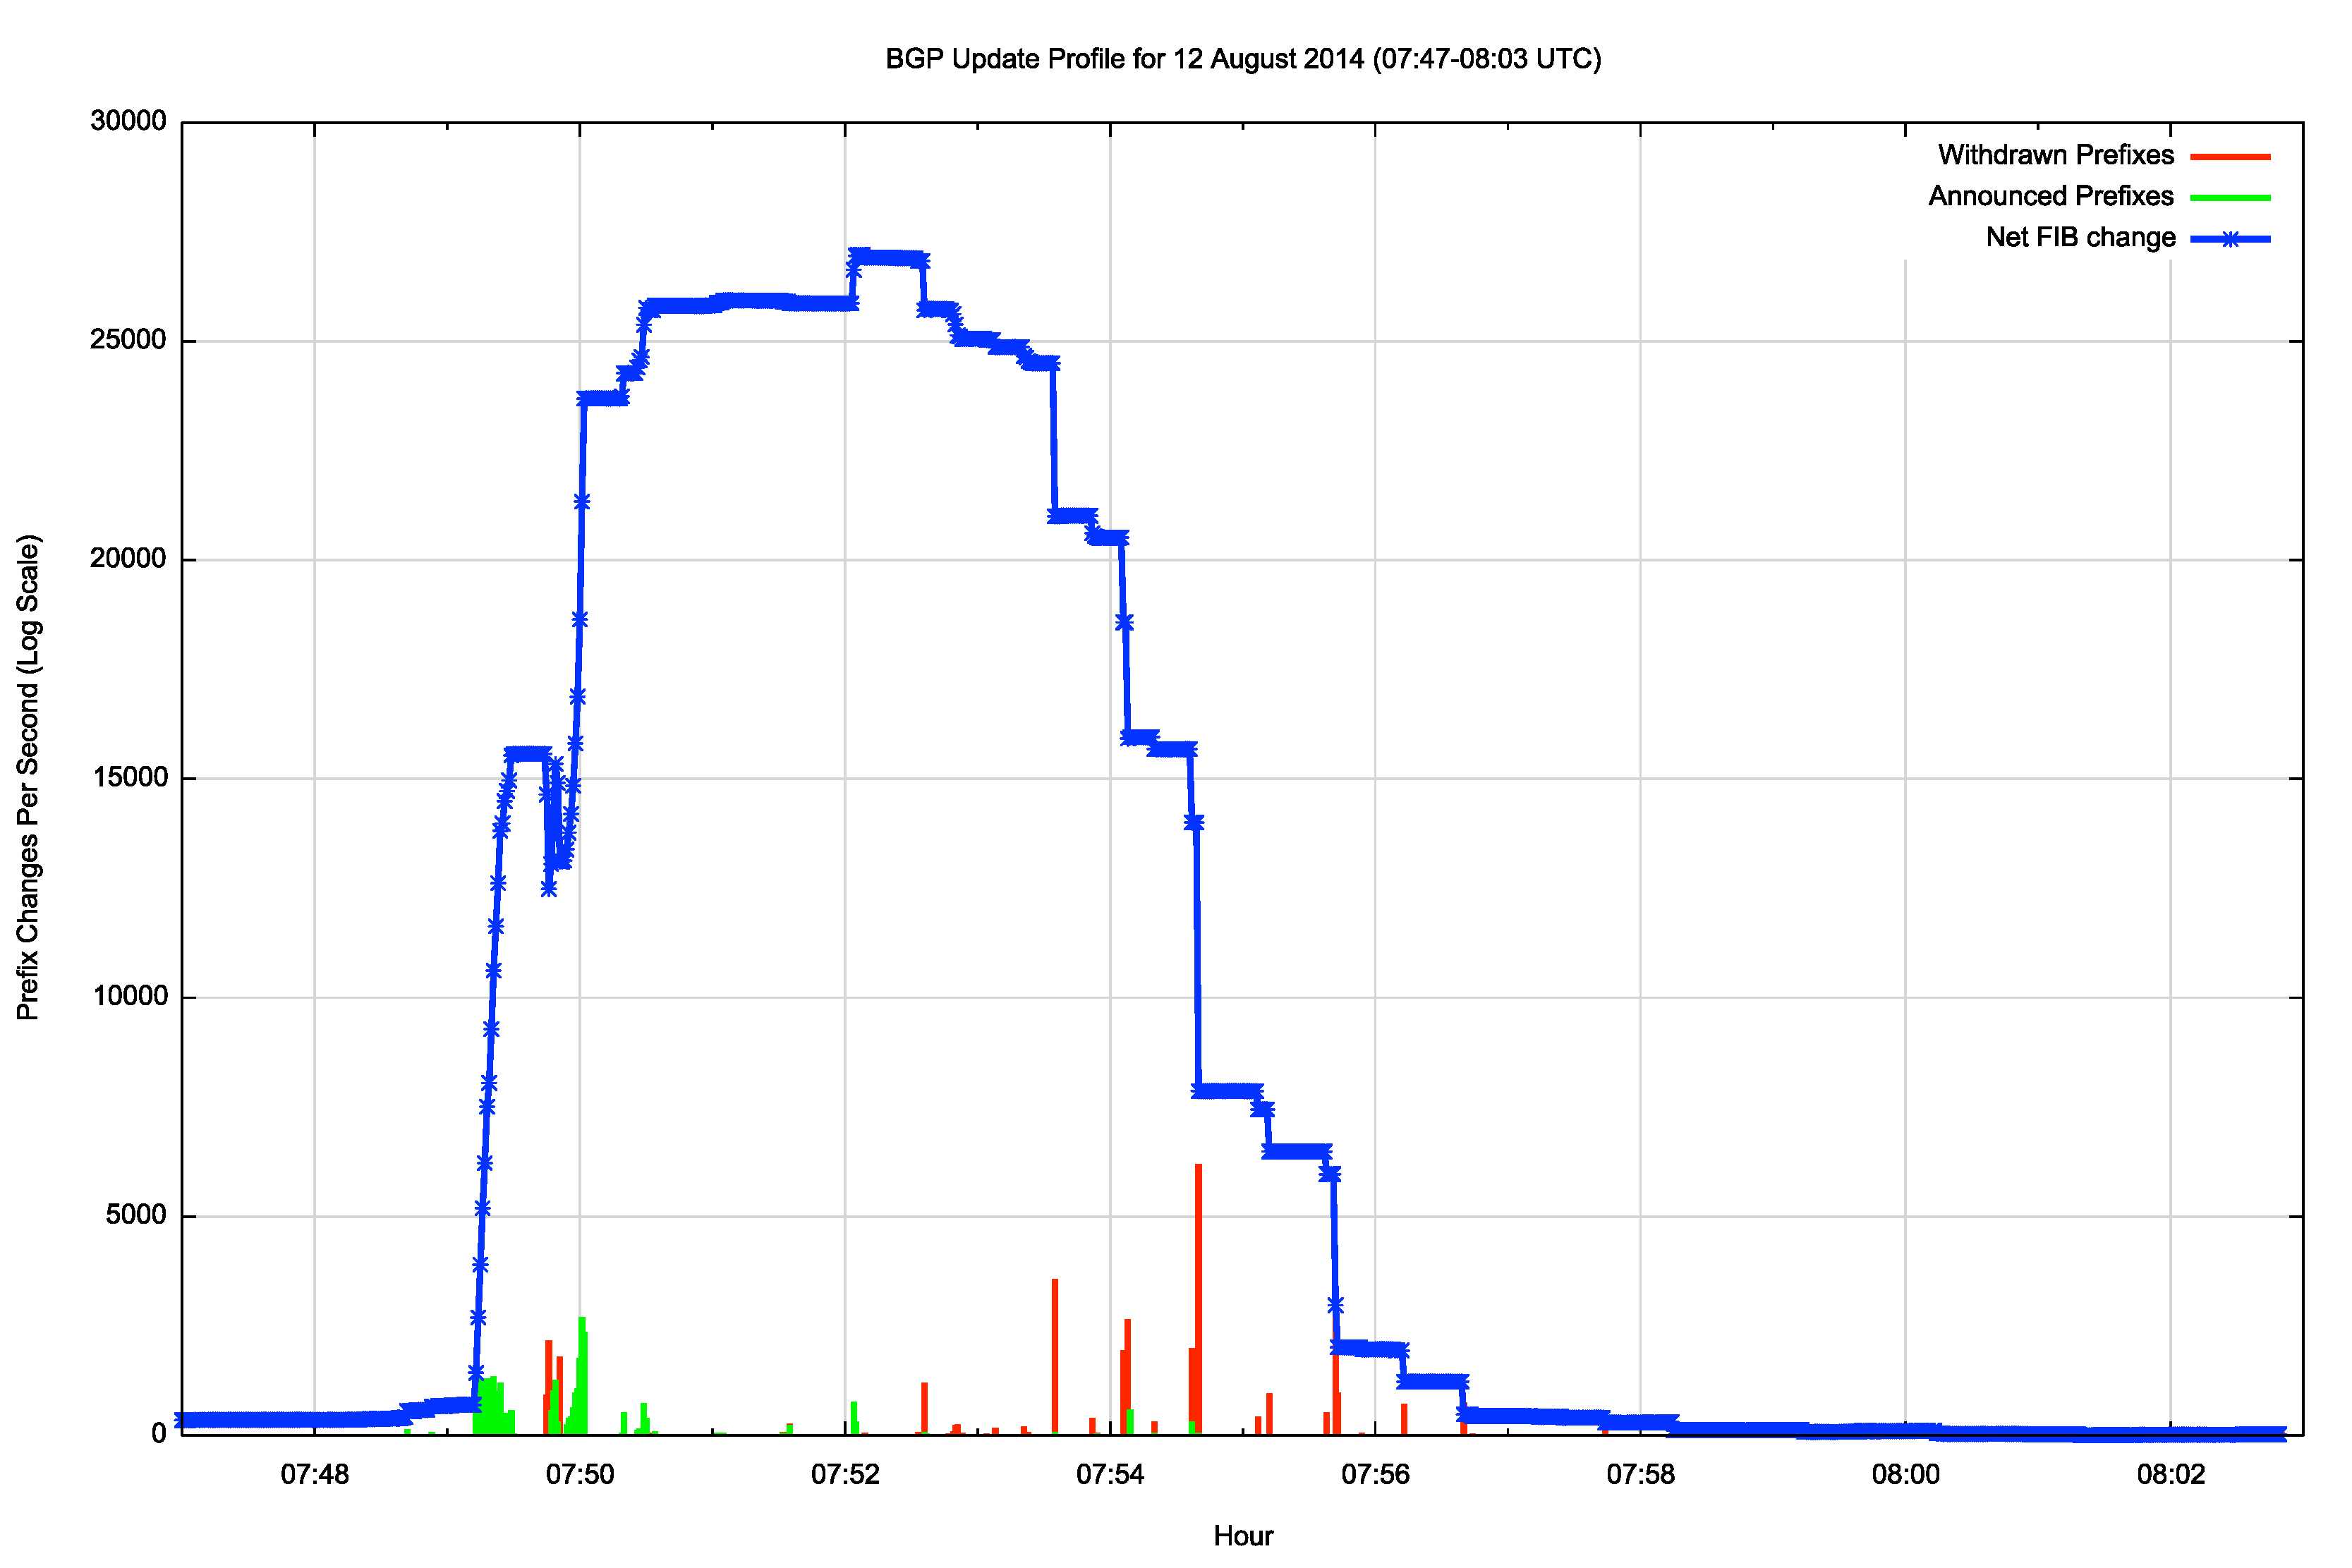
Figure 5: 1 second BGP Update Profile: 08:00 12 August 2014
This is now a lot clearer. An initial burst of 15,000 prefixes was received over a 30 second interval at 07:49. Some 10 second later there were a set of some 3,000 withdrawals, and then a further 14,000 additional prefixes being announced. 120 second later there was a further announcement of 1,000 prefixes. Withdrawals of these 27,000 prefixes occurred over the following 5 minutes, and it was not until 07:57 did we see the routing table return to the earlier state as of 07:49.
However it's a reasonable to ask whether the state of the routing table t the end of this leak event was the same as the earlier pre-leak state. Did we lose some routes along the way?
Perhaps if we look at the entire morning following the route leak we might find some indication of whether there was any collateral damage associated with this route leak. Figure 6 shows the BGP activity profile up to midday, and it does appear that in the immediate aftermath of the route leak a further 700 routes were missing, 350 of these routes were subsequently restored over the ensuring 90 minutes, and then there was a further period of instability involving some 600 routes, until the routing table was at its pre-leak level just before midday.
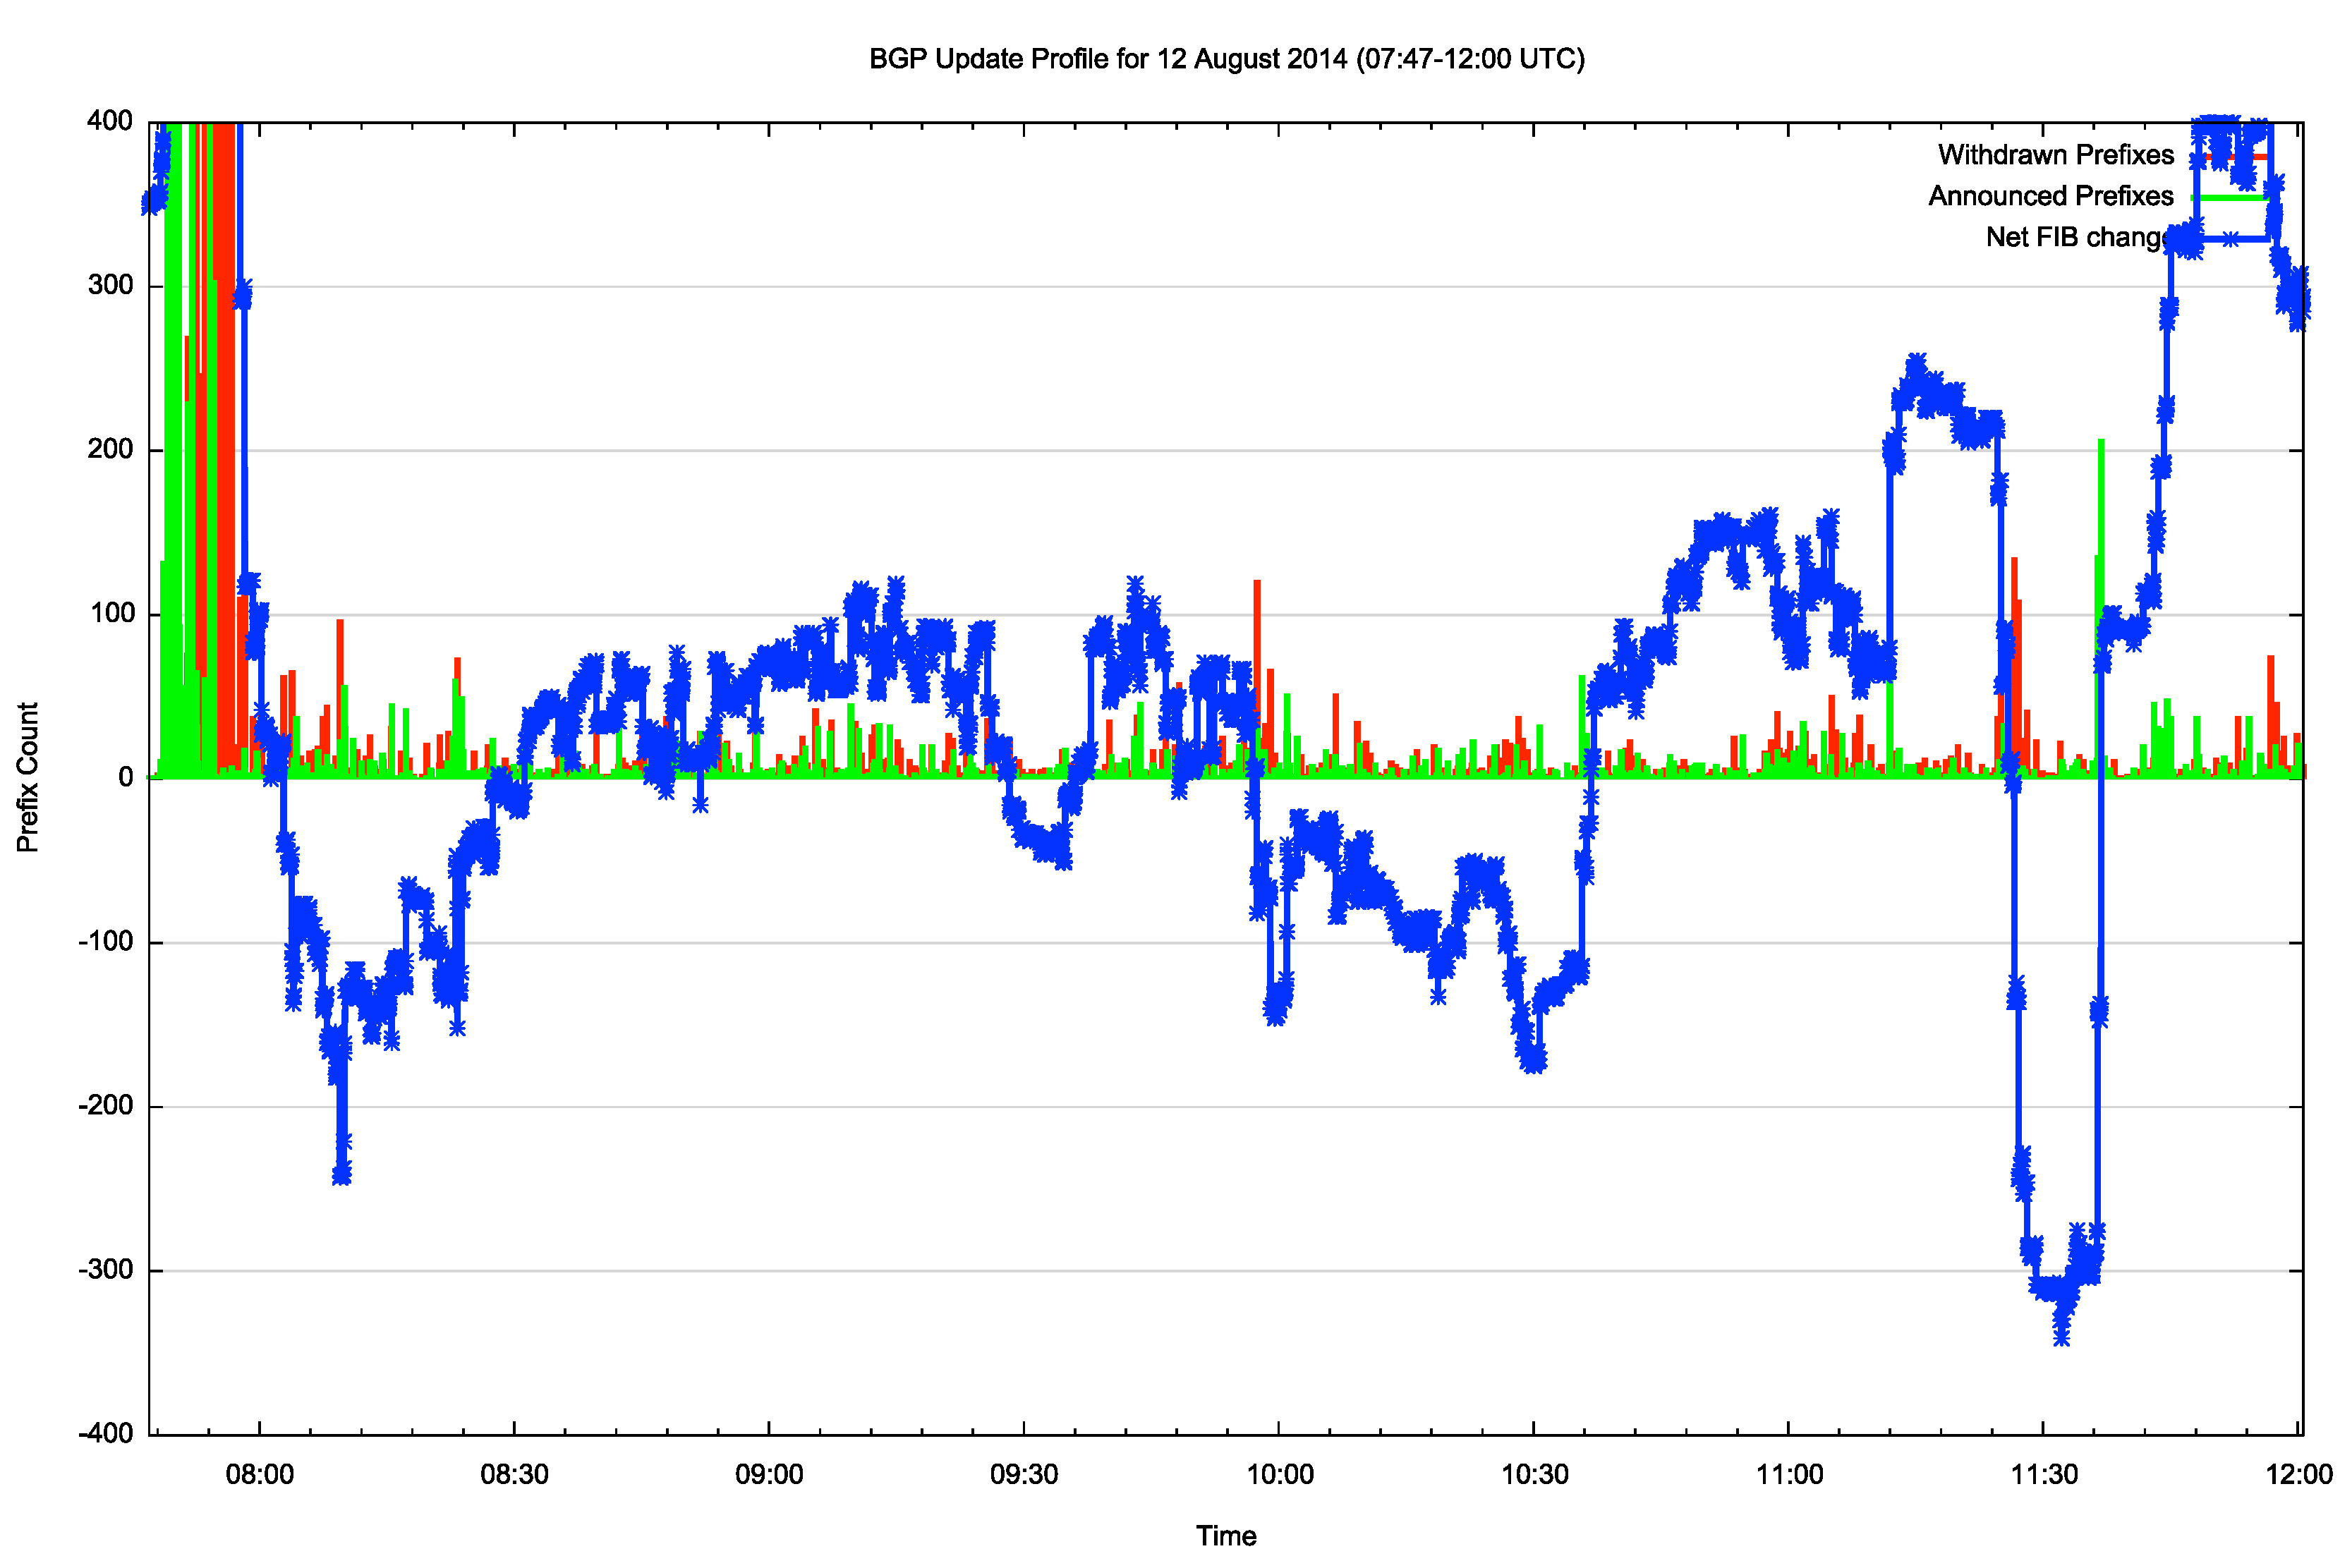
Figure 6: 5 minute BGP Update Profile: 08:00 – 12:00 12 August 2014
However, as noted above route leaks are common. So what made this one special? Why did we see collateral damage across a number of other Ass that appeared to be a direct consequence of the original route leak. If we present this route table growth data using an absolute scale (Figure 7) then a possible cause becomes a little clearer. For AS 131072 this route leak pulled the BGP routing table to well in excess of 512,000 entries. And its likely that this was at the heart of the problems we saw.
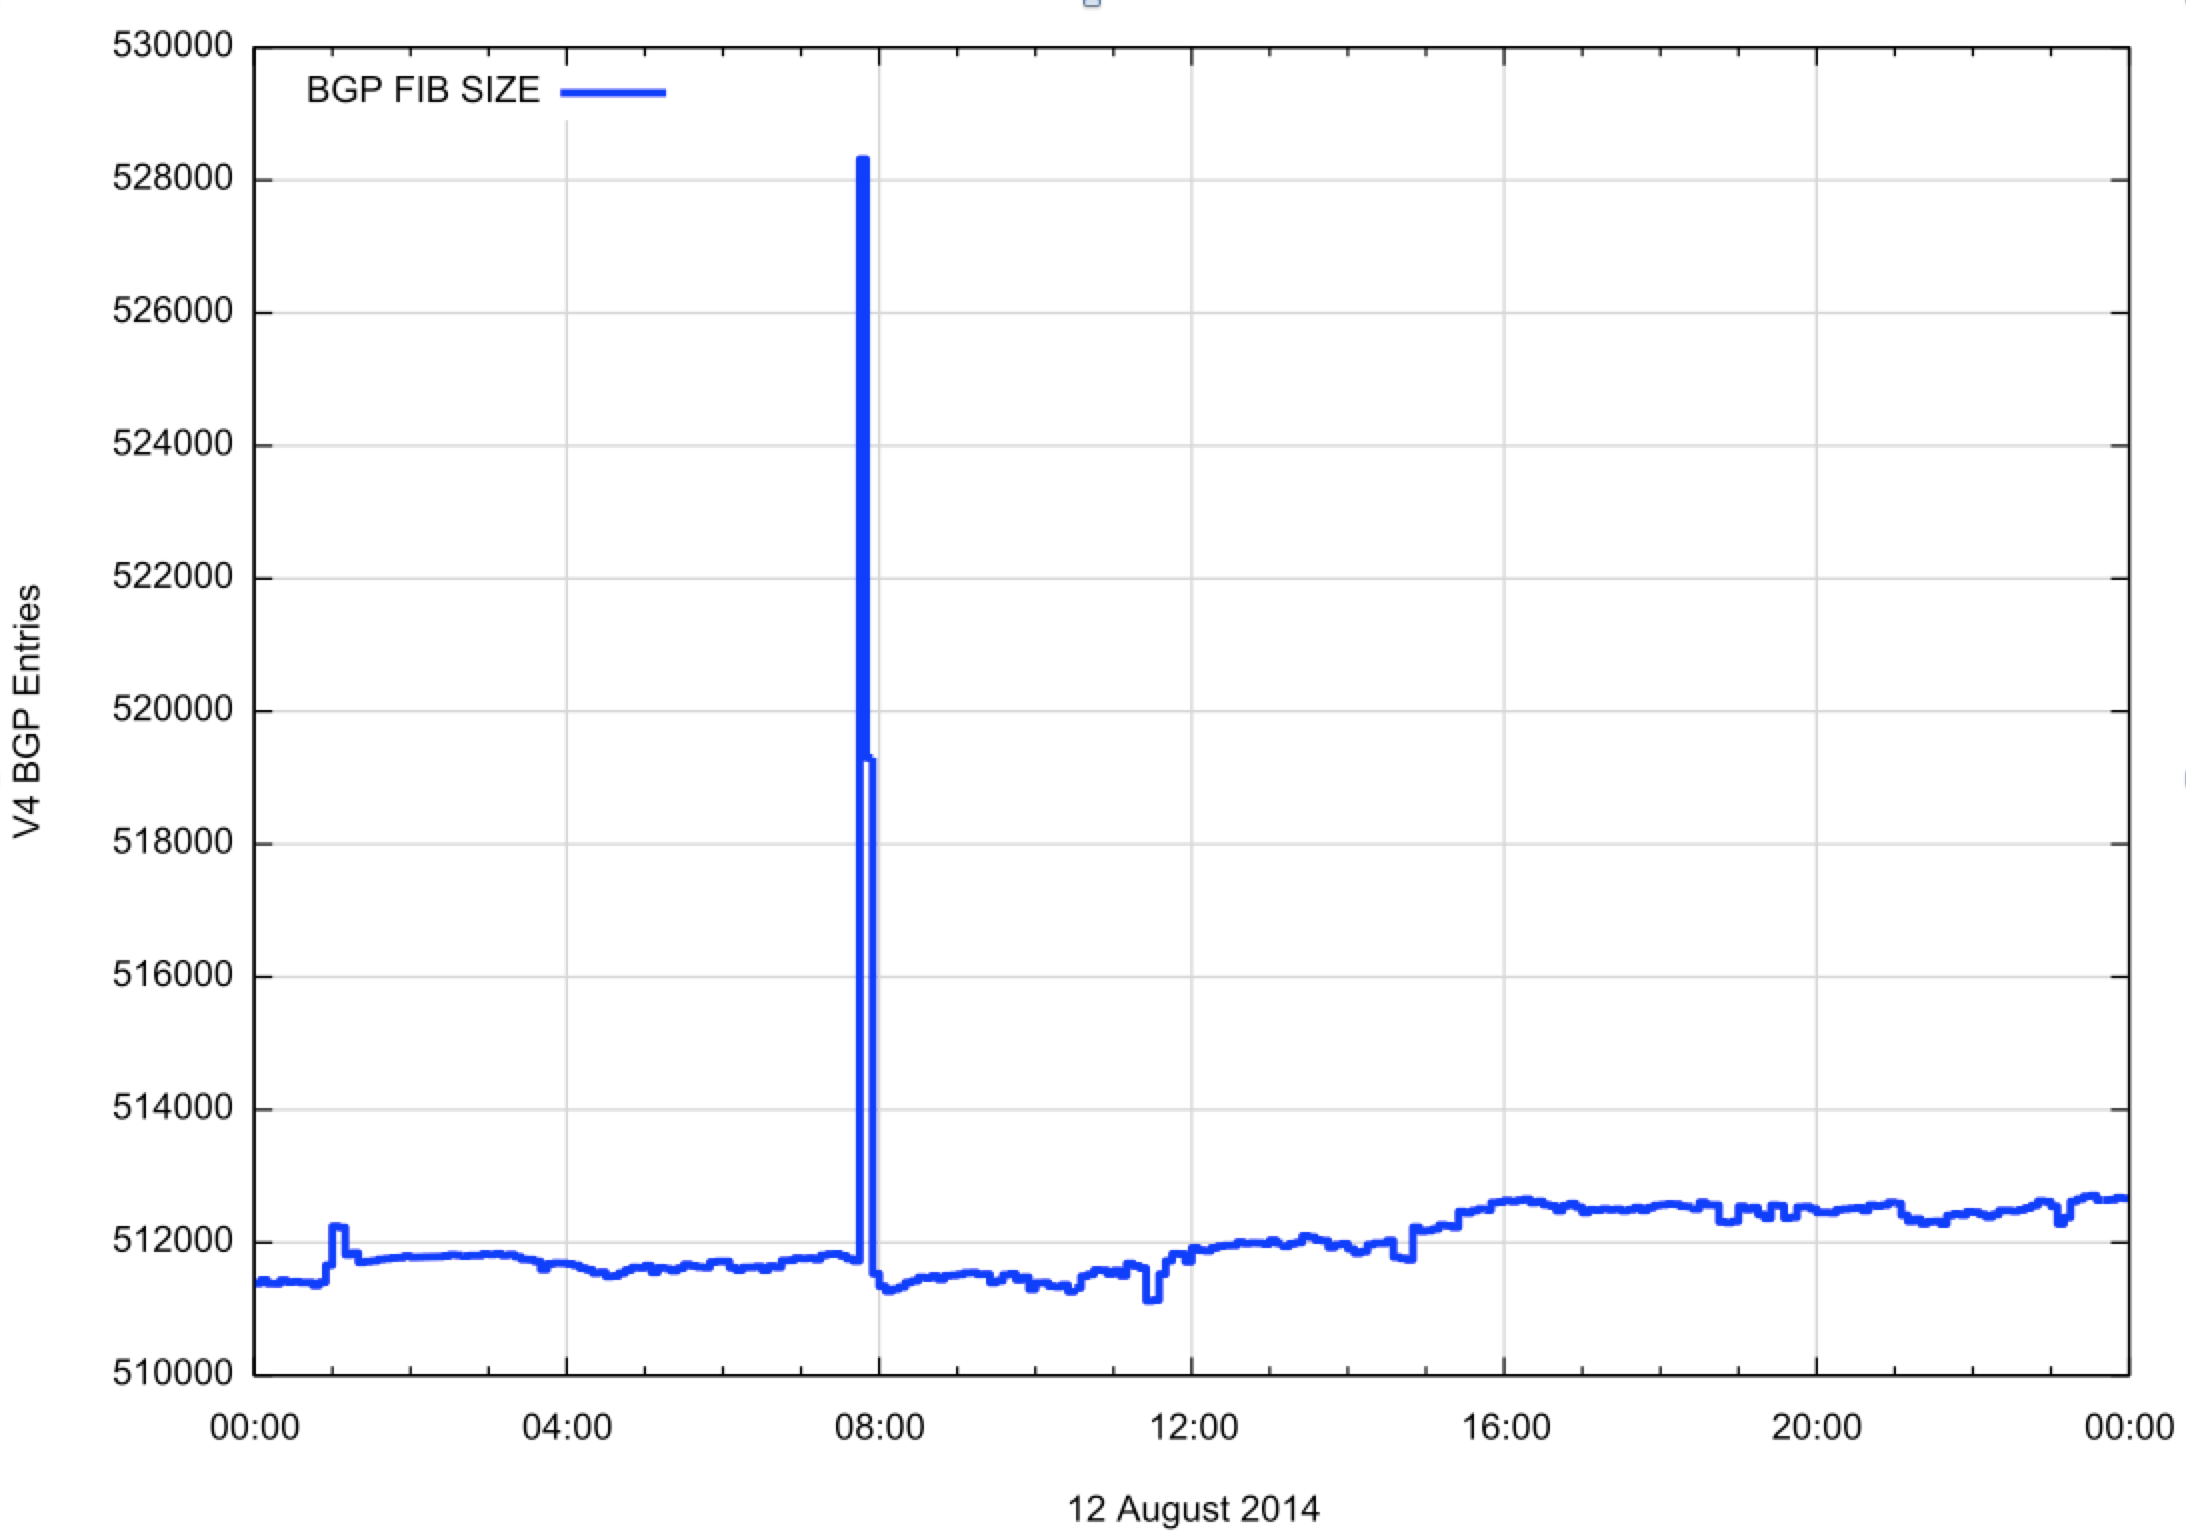
Figure 7: BGP IPv4 Prefix Count for 12th August 2014
If you look at the specifications from some commonly used switching equipment (Figure 8), there are some references to the number 512K in the fine print as a default setting for the number of IPv4 entries that are carried in a high speed lookup cache.
When the number of routes in the routing table exceeds this number then there are a number of potential scenarios (note that I'm not describing the exact behaviour of any particular equipment or configuration here, just the options for failure!). The worst possible option is that the condition triggers a reset. Unfortunately, once the equipment reboots the condition of excess routes will be triggered again, and this cycle will continue indefinitely. Another possibility is that new and updated routes are simply discarded by the unit in its forwarding caches. This would result in a rather subtle condition where, for packets addressed to a relatively small number of prefixes the equipment would silently discard the packet. However the operating BGP process on the equipment would not necessarily be aware of this and would report that all was normal. And of course another option is that the unit crashes and awaits an operator intervention, which may be related to the additional withdrawals that are seen in Figure 6.
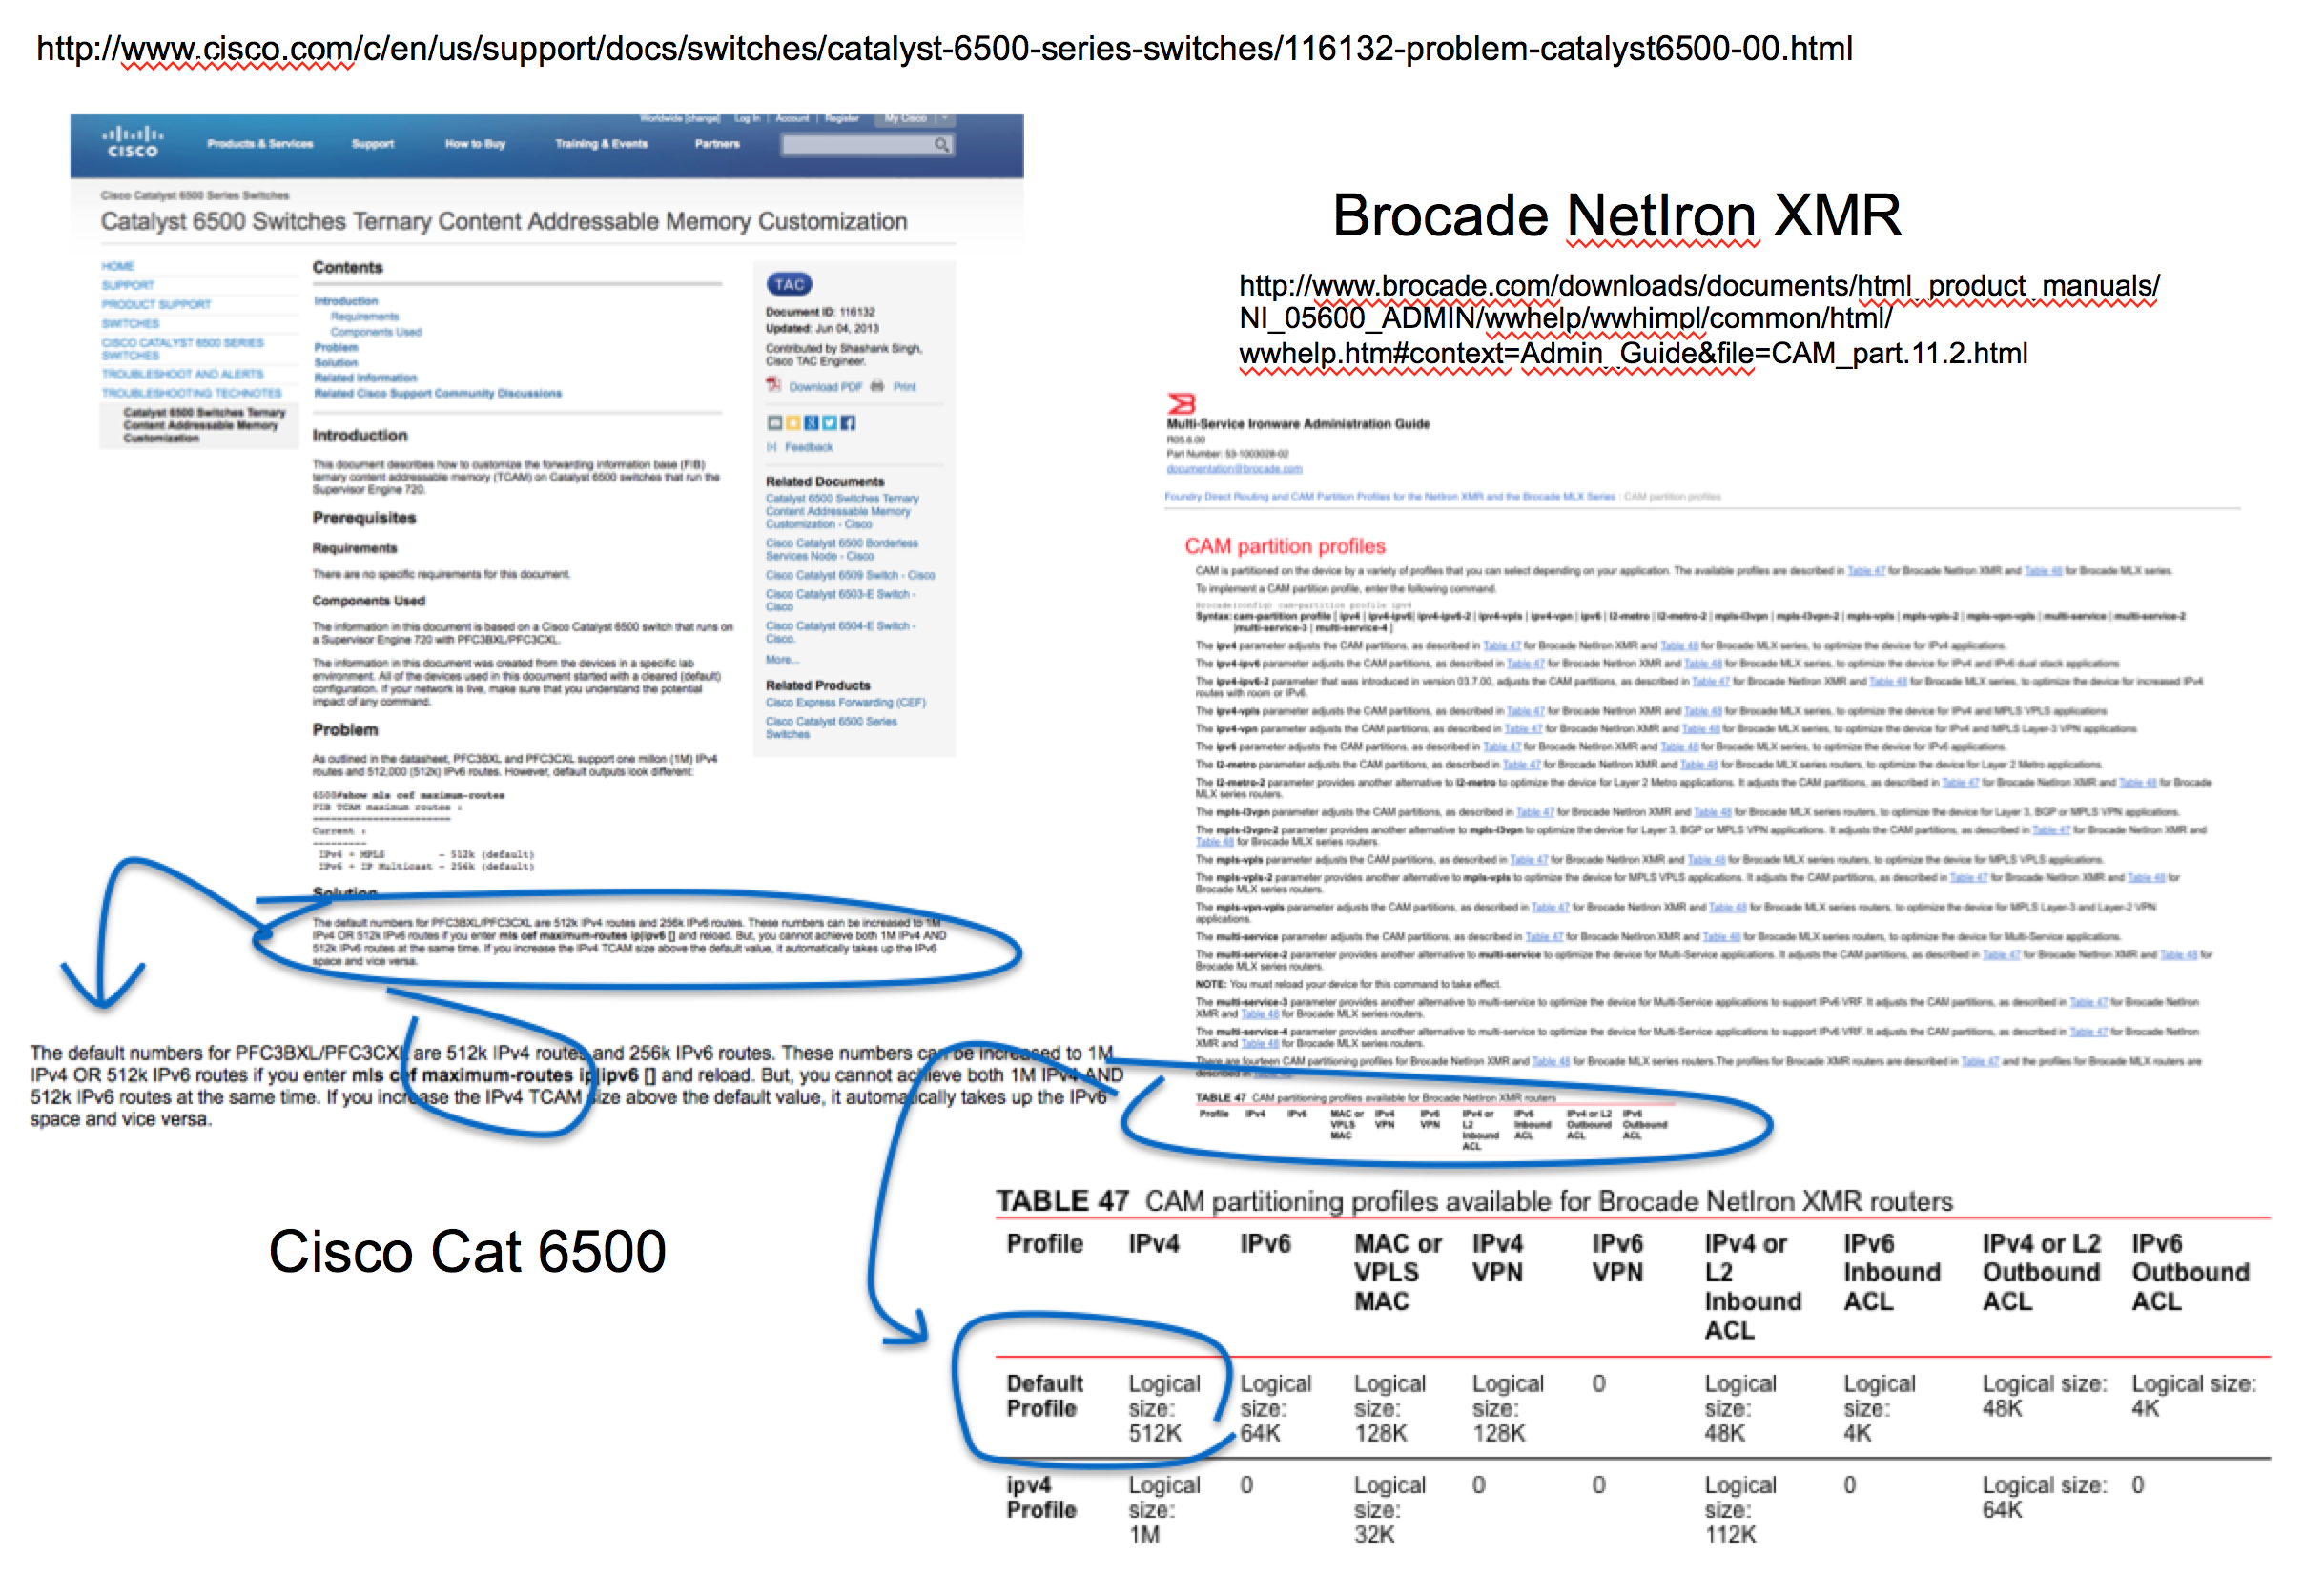
Figure 8: Router Spec Sheets
But for AS131072 this 512,000 route threshold was exceeded a second time that day, at midday. Why didn’t this cause a similar ripple in the fabric of the Internet? The best way to answer this is to note that there is no single view of the Internet’s routing table, and every AS speaker has their own view. If we look at the number of prefixes announced by a collection of peers of Route Views over this period we see variation between peers of some 20,000 route entries (Figure 9).
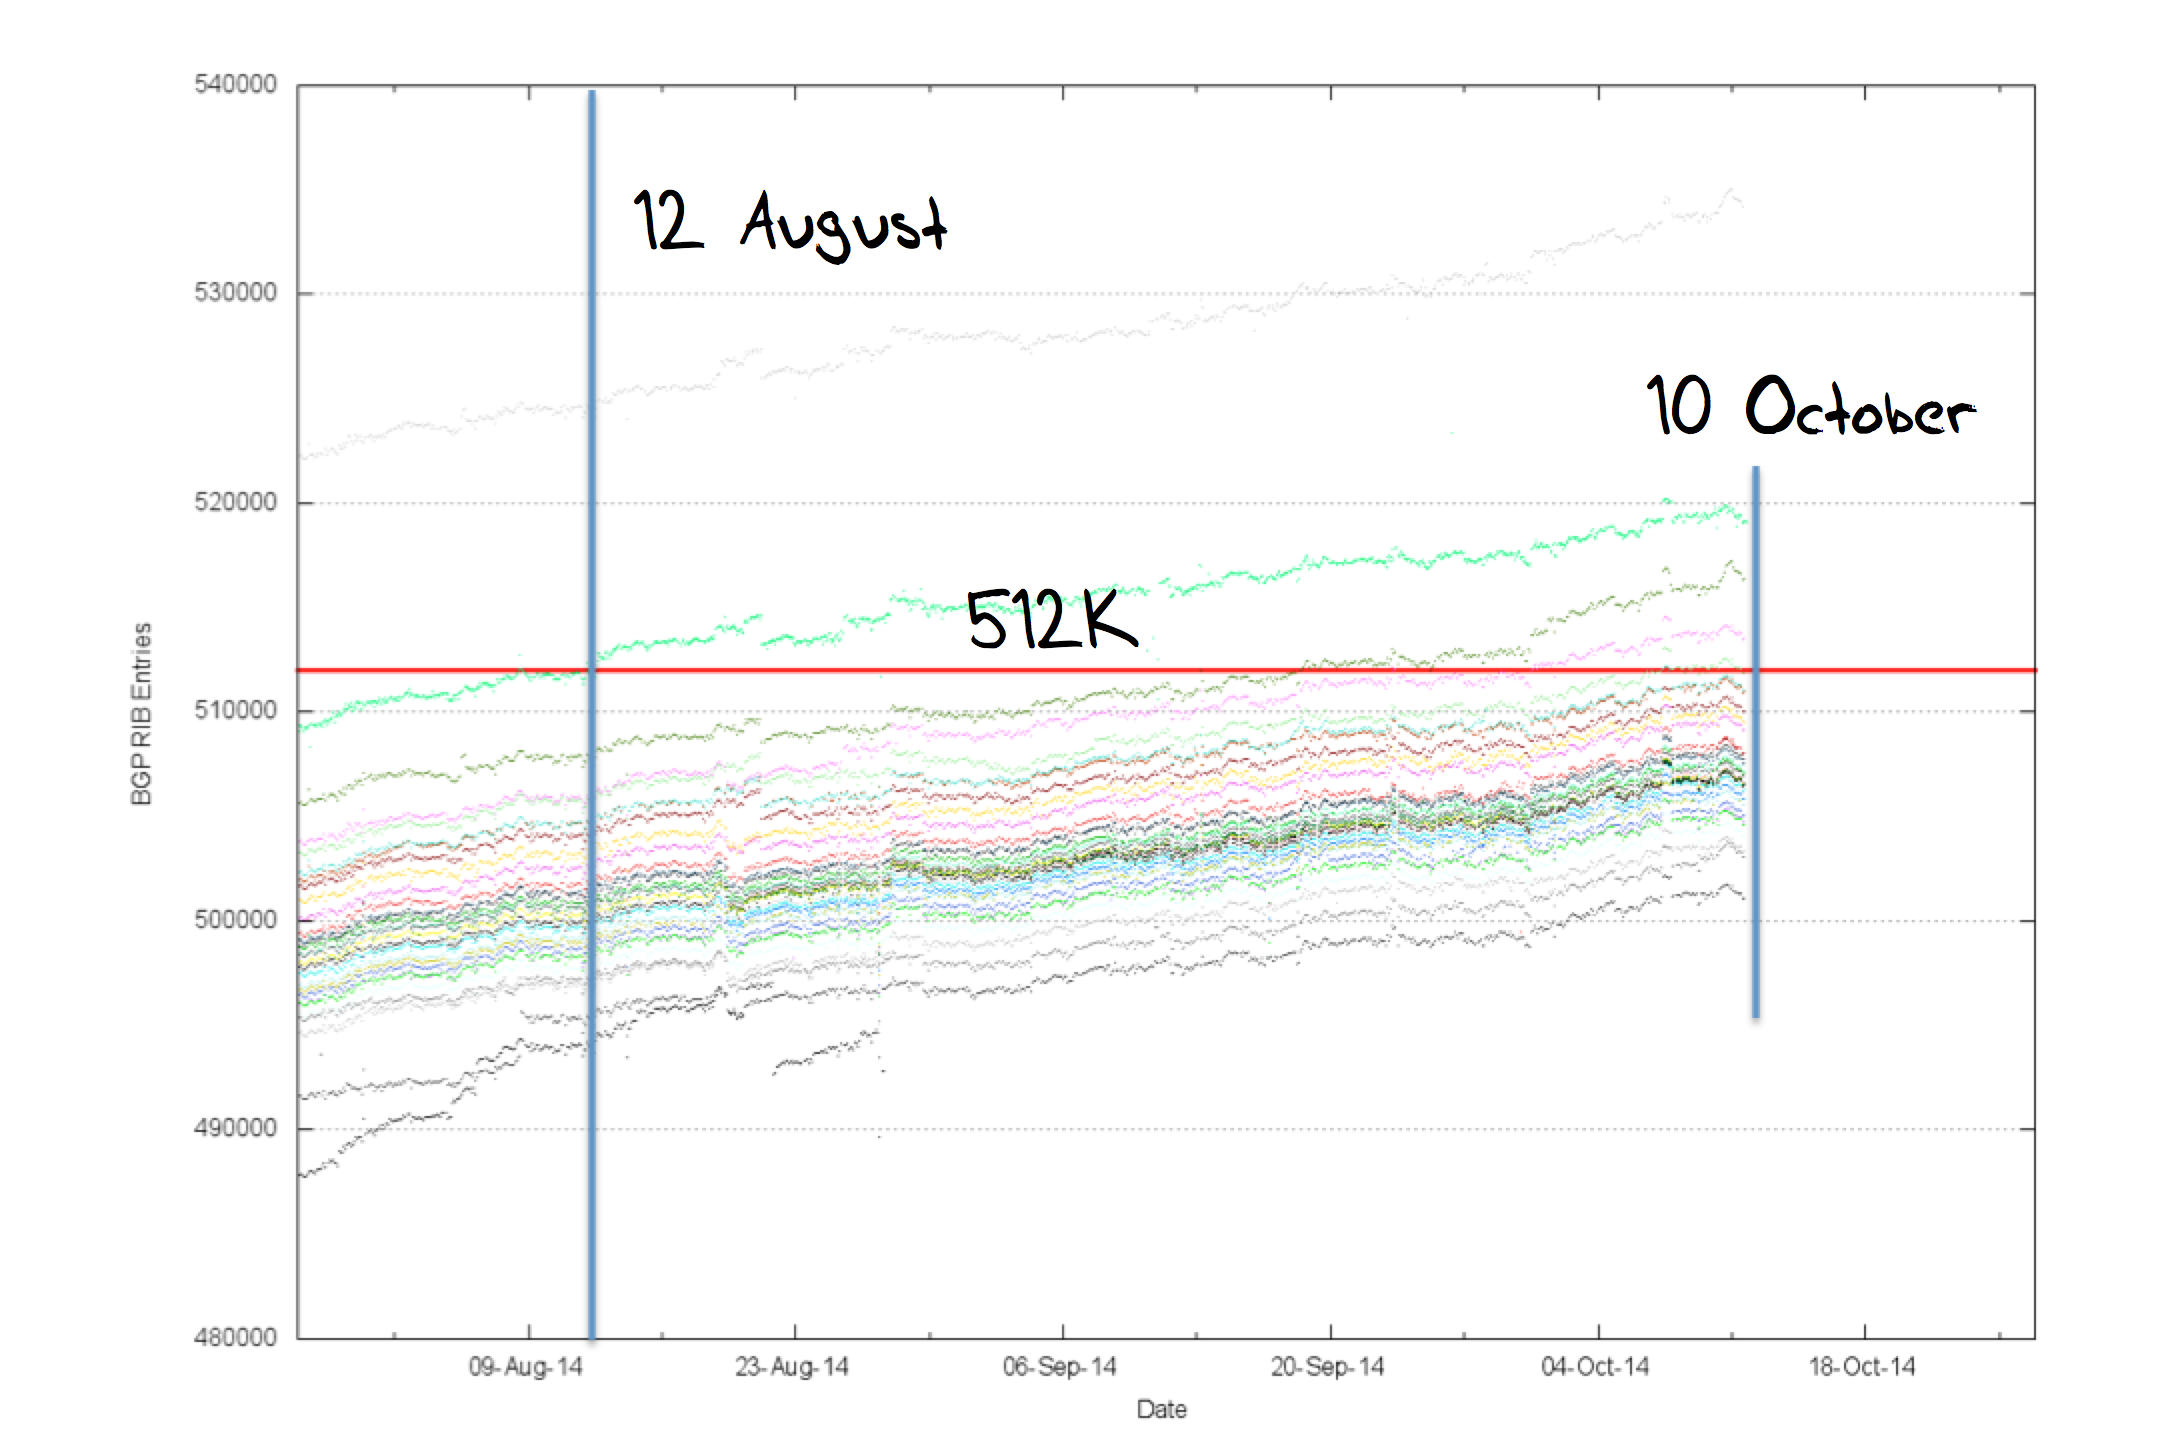
Figure 9: The view of BGP for Route Views’ peers
What is also apparent in Figure 9 is that for many peers of Route Views, their table size on the 12th August was between 495,999 and 508,000, and the median of 500,000. The route leak of 27,000 routes took many AS’s over the 512,000 point, but it quickly receded. However the median routing table size a couple of months later is now at 507,000 routes, and while AS131072 has seen its table pass across this threshold back in August, for others it will be happening over the final quarter of 2014. It could well be that the route leak was a rehearsal for a subsequent time when the steady state BGP table exceeded this threshold. And that subsequent time is coming.
One this about this particular problem is certain. This is not a surprise. But before looking at the dynamics of routing table growth, its useful to ask why is this particular value, 512,000, such a problem for some. And to do that we need to look inside a router.
Router Internals
How do these limits, like 512,000, arise in routing equipment in the first place? Why isn't it possible to design routing equipment that is not arbitrarily limited in this manner?
Lets look inside a high speed high capacity router to see where these limits come from. The internal design of a router can be described in a analogous way to the old mainframe computer architectures; as a set of specialized modules attached by a common backplane (Figure 10). These modules include a controller, a switch fabric card, and a collection of line interface cards.
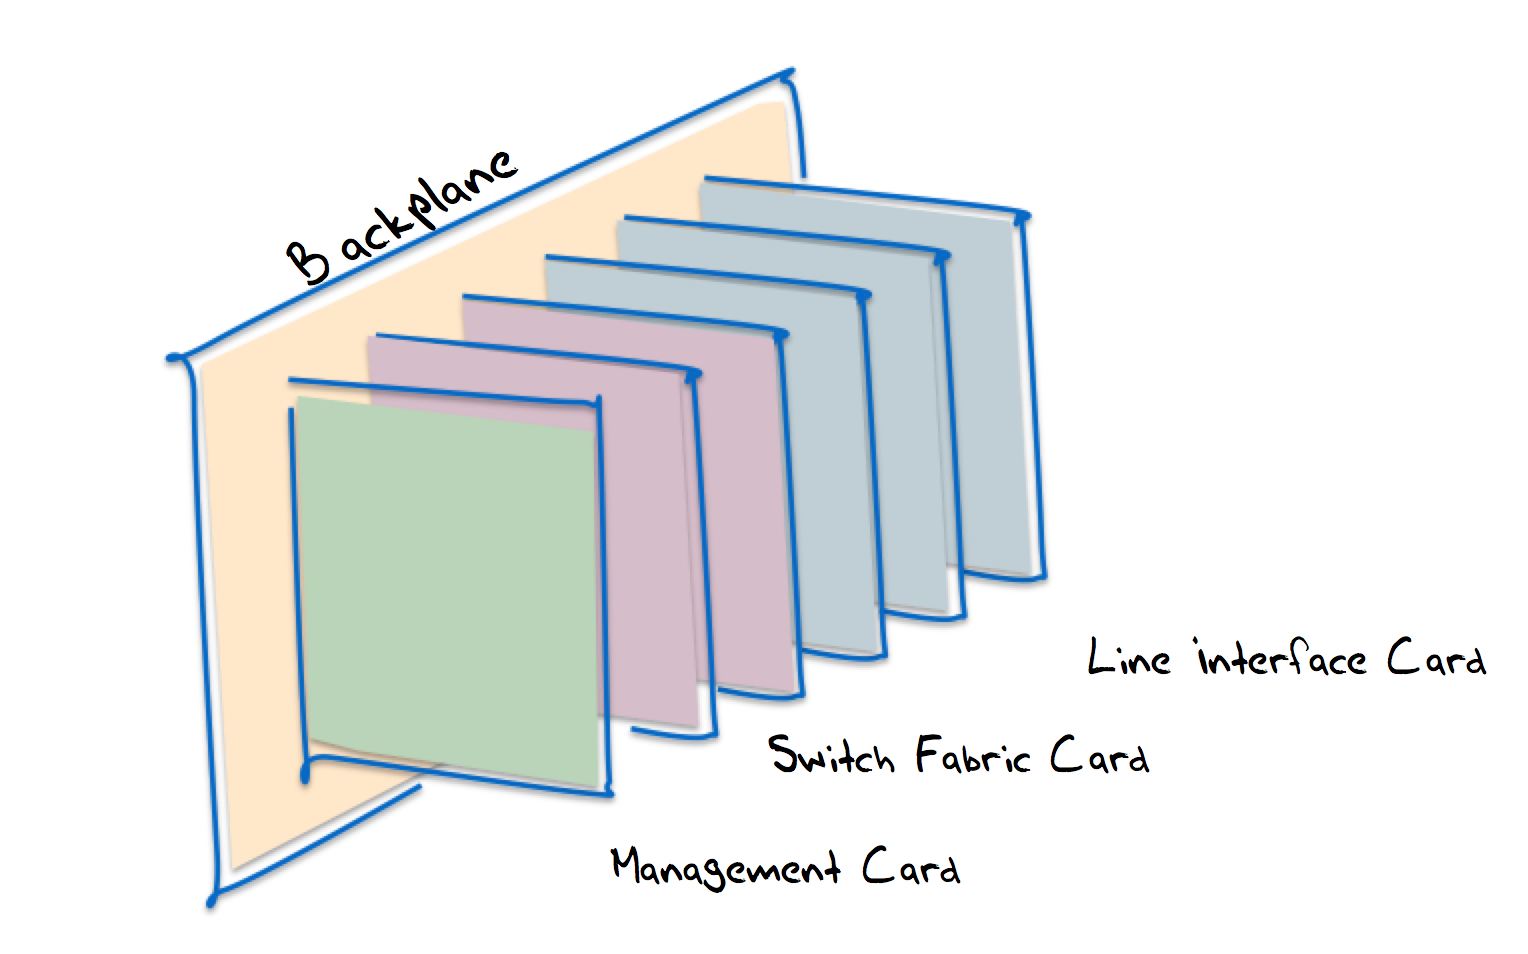
Figure 10 – Internal Structure of a High Speed Router
The purpose of each line interface card is to perform as much as it can in an autonomous manner, and not to impose load on other components of the unit. This means that each line interface card has a number of roles to perform (Figure 11). The Physical Interface unit includes the digital signal processing units that support the interface to the physical media. The interface that the this unit presents to the remainder of the line interface card is essentially one of a data packet. For incoming data packets, the network unit performs the initial part of the switching function, where for each received packet, the line card looks up a local forwarding table, using the destination parameters from the packet as the lookup key.
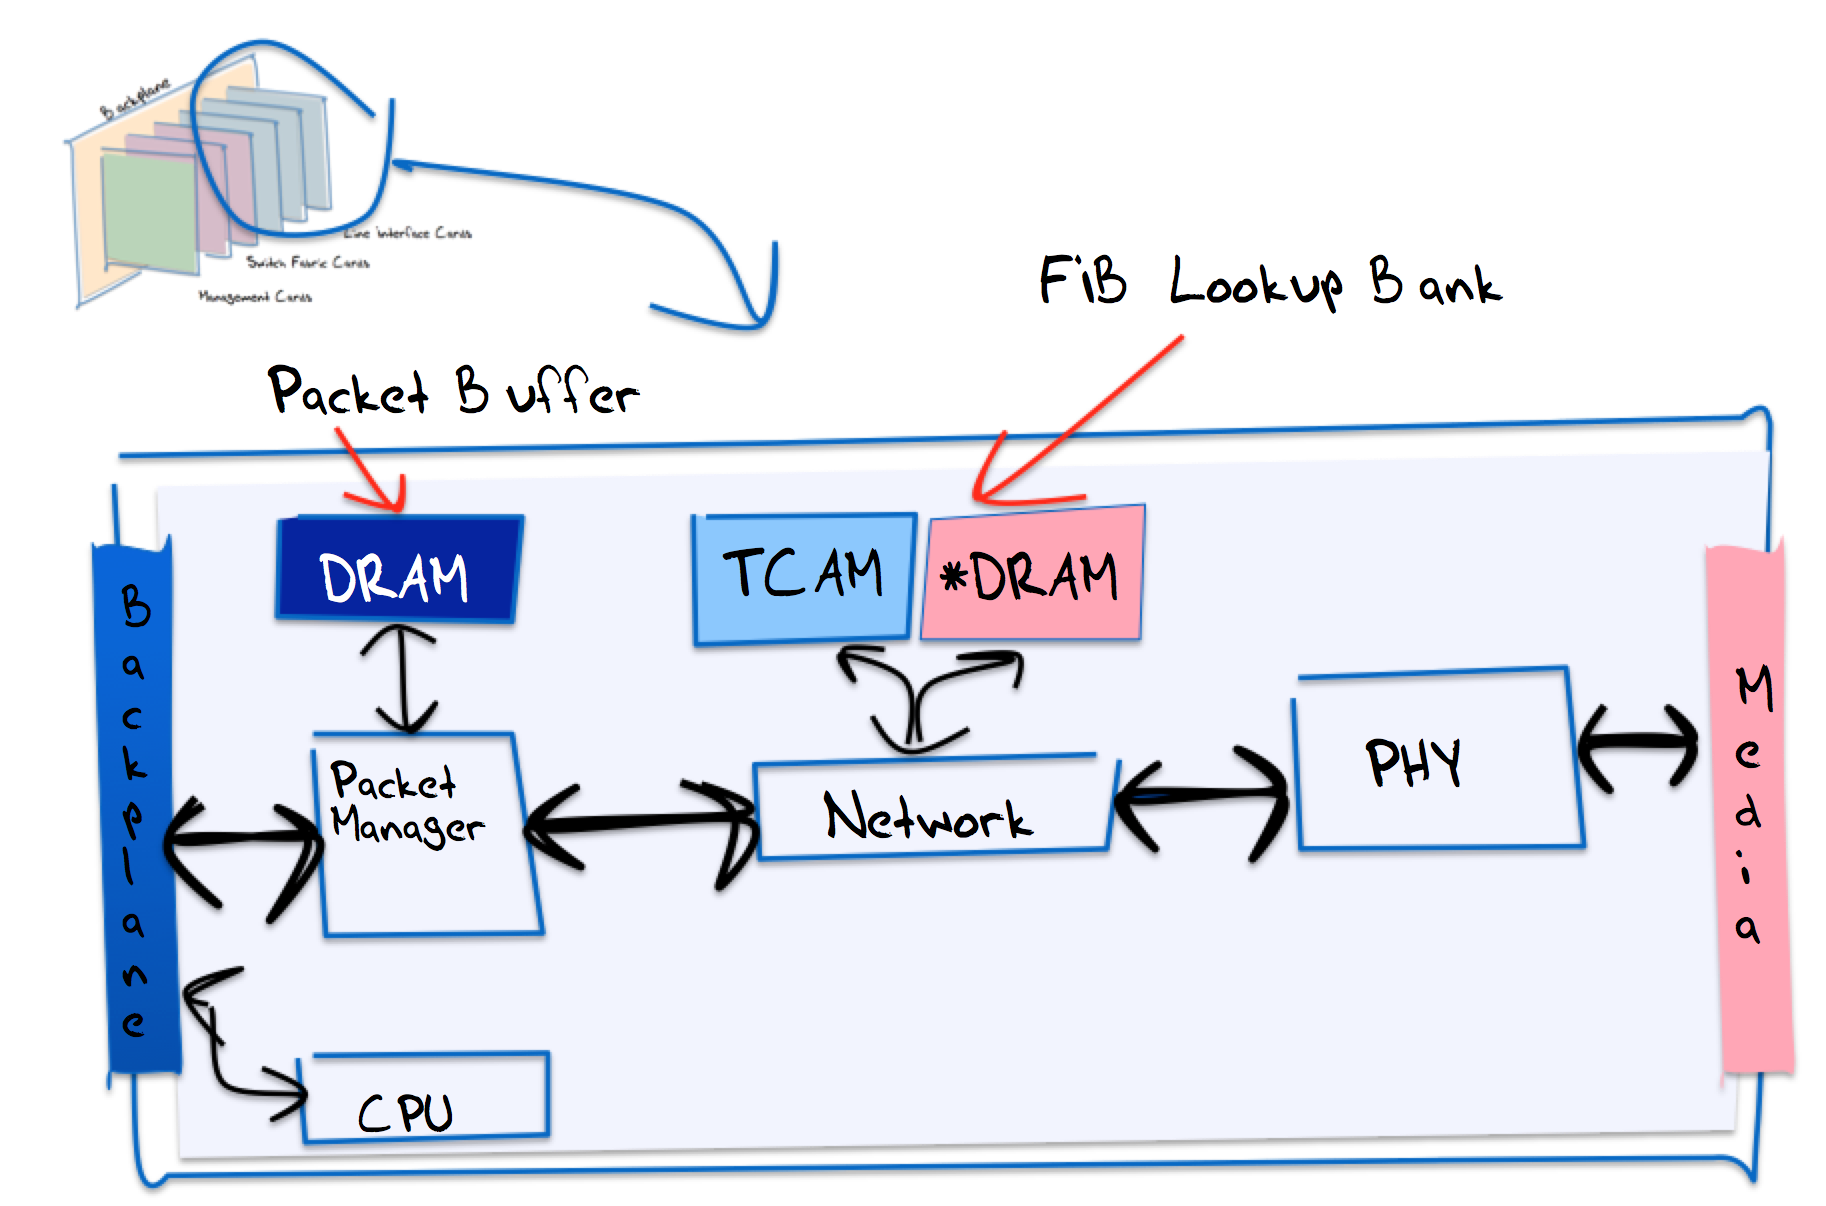
Figure 11 – Logical Structure of a Line Interface Card
The result of the forwarding table lookup is the address of the outgoing interface. If this interface is located on the same line card, then the packet is queued to the output structure associated with that interface. If the interface is located on another card then the packet is pass to the packet manager for transmission along the backplane to the switching unit to the passed to the outbound line interface card.
The critical component on the line interface card is the memory structure used to support the packet lookup. This lookup must be completed within the time defined by the maximal packet arrival rate, so for high speed line cards this memory structure is critical to performance. An approach used in some routers is to use Ternary Content Addressable Memory (TCAM). TCAMs store a routing prefix in each memory “slot”, using a ternary-state representation of the bits within the prefix (1, 0 and ‘don’t care’). When presented with an IP address, the TCAM module returns the address of the slot that is the longest match against the prefix, which can represent the appropriate interface address on the router. The advantage of TCAM is that it is consistent, in that every lookup takes just one TCAM cycle time. However TCAM memory requires a higher gate count per stored bit (up to 24 gates per bit), so TCAM is expensive memory.
An alternate approach is a TRIE lookup using conventional memory and an ASIC front end. The advantage of this approach is that the routing table can be stored in conventional high speed memory, which is cheaper than TCAM, but it does require an ASIC front end. The lookup also requires multiple comparisons, and the number of comparisons to complete an address search is variable, so that this approach does not provide an answer in a consistent time interval. In general the larger the overall table, the slower the lookup, but the exact performance of a TRIE depends on the distribution of prefixes in the table and the choice of TRIE structure and lookup that is used by the ASIC.
The question when designing a line card is how much lookup memory should be provisioned on the card, how fast, and whether to use a TCAM, a TRIE structure. The larger the memory, and the faster the lookup, the higher the cost, so there is a tradeoff being made between provisioning enough memory and fast enough memory for the expected service life of the unit, but at the same time avoiding the cost of over-provisioning.
There are two important questions to be answered when looking at this aspect of router design. How quickly will the routing tables grow in the coming years? And how quickly will transmission speeds grow? The answer to the first will influence the size of the forwarding tables in the line interface cars, and the answer to the second will influence the desired memory cycle time.
Let’s looks at these two questions in further detail.
Predicting Routing Table Growth
Sometimes these table overflow events are unpredictable, and the route leak at 8:00 am that morning certainly falls into the category of an unpredicted event. But a few hours later, when the “normal” route pool exceeded 512,000 entries was an entirely predictable event. It was not only inevitable down to the level of the month when this was going to happen. To see how, its necessary to look back over the past few years of routing table growth.
Since January 2011 the Internet’s routing table has increased from some 348,000 entries to the current level of some 515,000 entries. As can be seen in Figure 12 there is little difference between the linear and polynomial curve fits to this data. What is perhaps of interest here is that during this period 3 of the 5 regional internet registries exhausted their general use pools of IPv4 addresses, yet the momentum of change in the routing table was largely unaffected by these events. We neither saw a massive change to large number of more specific advertisements being added to the routing table, or a marked decline in the number of new prefixes appearing.
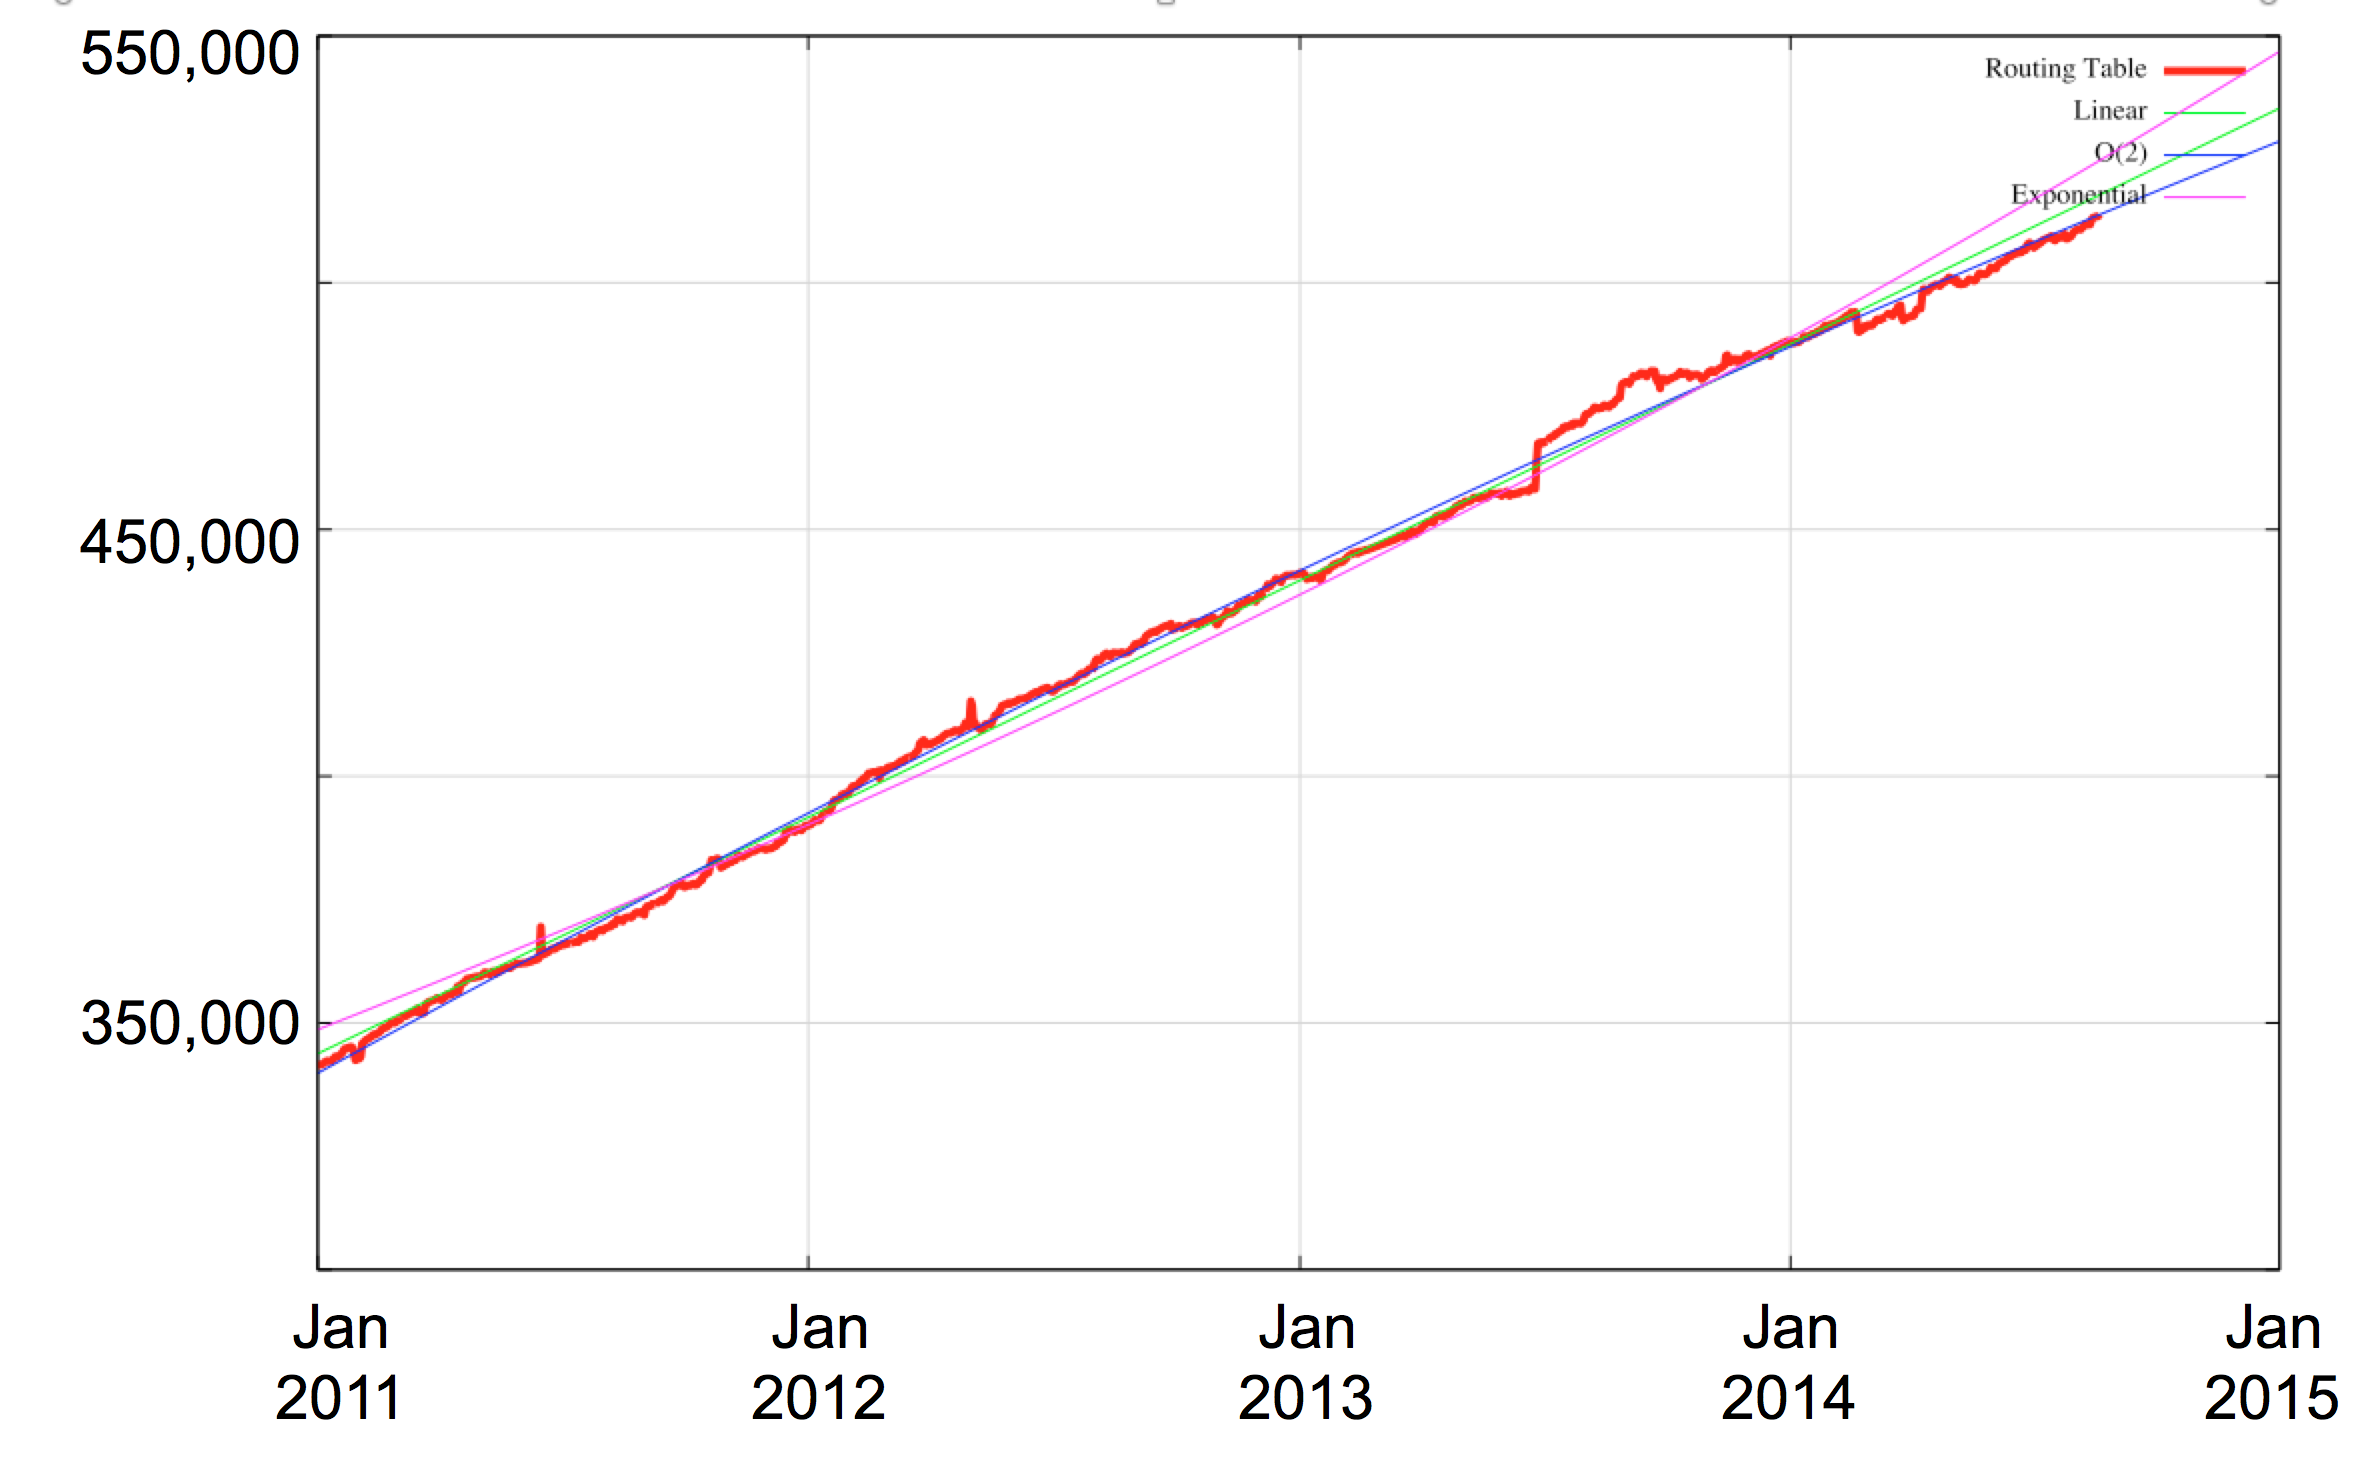
Figure 12: IPv4 BGP Table Growth 2011 - 2014
The overall metrics of Internet IPv4 routing table growth in this period are a modest level of between 8 to 10% per year for most of the basic routing metrics (Table 1). Of course this is the one point where address exhaustion is a little more visible, and the growth in the total span of addresses has grown far a far lower rate of just 2%.
| IPv4 Routing Table | Jan-13 | Aug-14 | Relative Growth (p.a.) |
| Prefix Count | 440,000 | 512,000 | 11% |
| Root Prefixes | 216,000 | 249,000 | 9% |
| More Specifics | 224,000 | 264,000 | 11% |
| Address Span | 156/8s | 162/8s | 2% |
| AS Count | 43,000 | 48,000 | 7% |
| Transit AS’s | 6,100 | 7,000 | 9% |
| Stub AS’s | 36,900 | 41,000 | 7% |
Table 1: IPv4 Routing Metrics 2013 - 2014
These days any consideration of the overall routing environment must also include consideration of the IPv6 network, Since the start of 2010 the IPv6 routing table has expanded five-fold, from some 4,000 entries to 20,000 entries. However, this growth is also predominately a linear growth since 2011, with the table size growing by approximately 4,000 entries per year over this period (Figure 13).
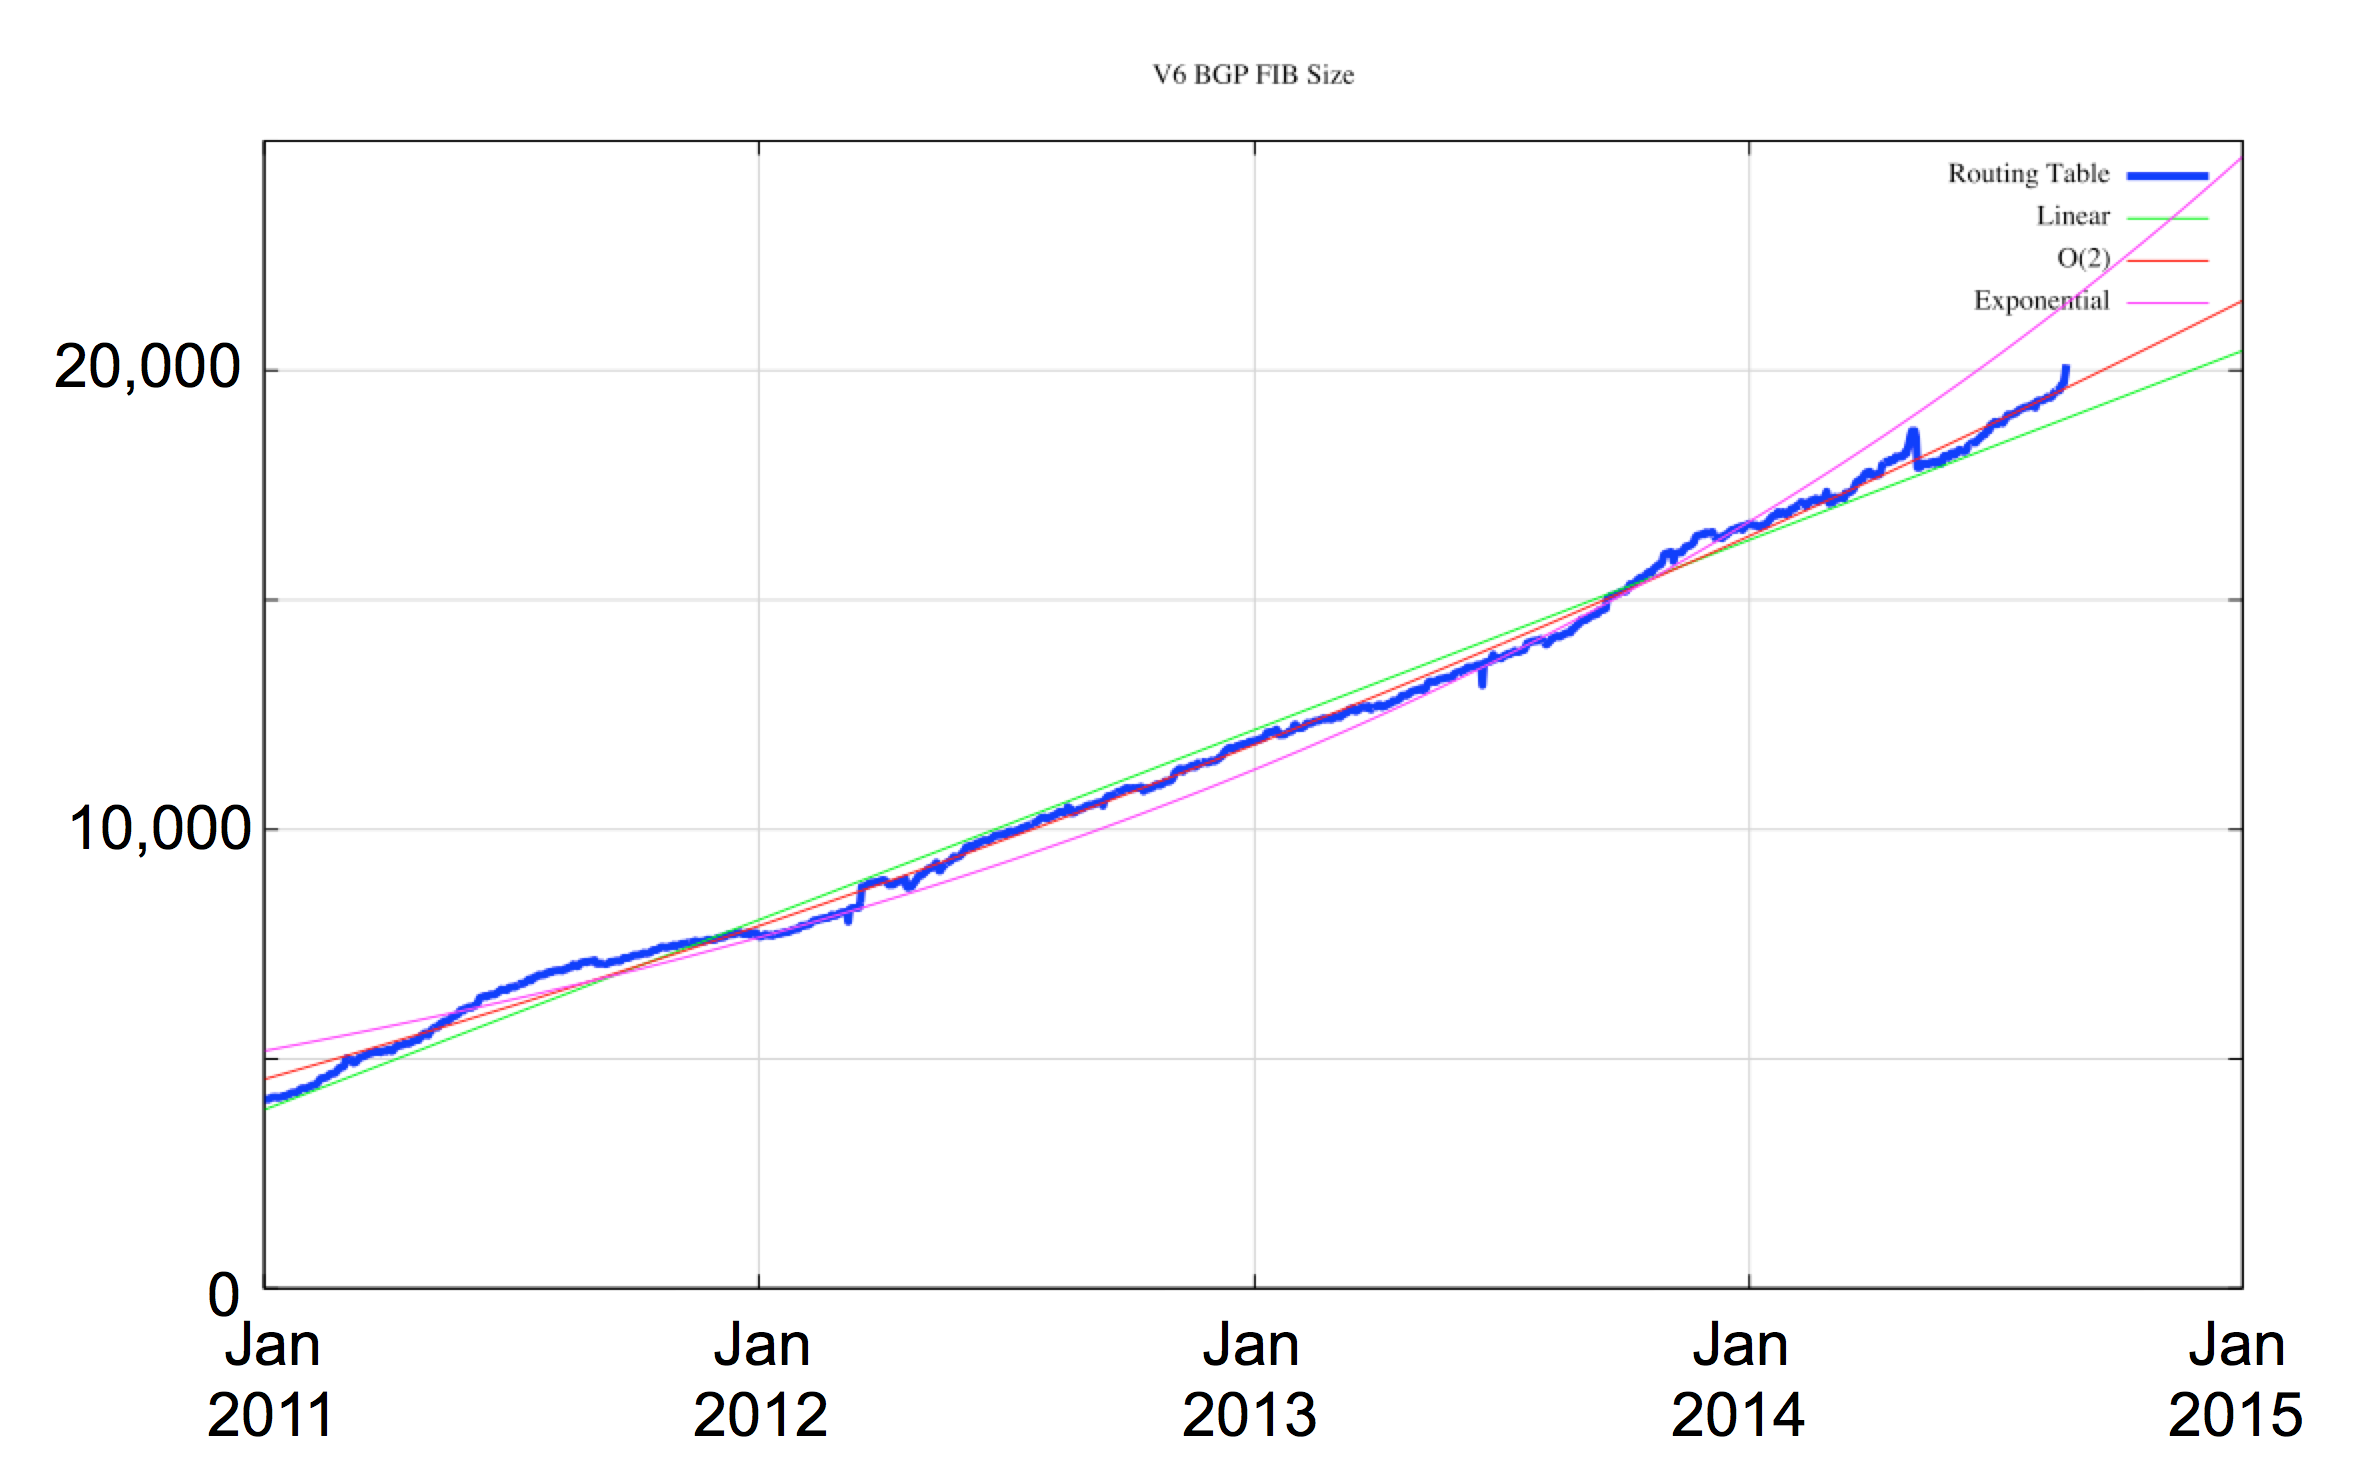
Figure 13: IPv6 BGP Table Growth 2011 - 2014
The overall metrics of growth in the IPv6 routing table since January 2013 are shown in Table 2.
| IPv6 Routing Table | Jan-13 | Aug-14 | Relative Growth (p.a.) |
| Prefix Count | 11,500 | 19,036 | 39% |
| Root Prefixes | 8,451 | 12,998 | 32% |
| More Specifics | 3,049 | 6,038 | 59% |
| Address Span (/32s) | 65,127 | 73,153 | 7% |
| AS Count | 6,560 | 8,684 | 19% |
| Transit AS’s | 1,260 | 1,676 | 20% |
| Stub AS’s | 5,300 | 7,008 | 19% |
Table 2: IPv6 Routing Metrics 2013 - 2014
Over this period, where the IPv4 network added a further 172,000 routing entries, the IPv6 network grew at a somewhat more modest level, at least in absolute terms. The number of routing entries grew from 11,500 routes to 19,000 routes, adding an additional 7,500 prefixes over this period. However, in relative terms this represents an annual growth rate of some 40%, which is considerably higher than the equivalent metric in IPv4.
In predicting routing growth for the Internet in the coming years one of the more informative views is the daily number of added prefixes. The absolute and relative counts of the net growth in the IPv4 routing table is shown in Figure 14.
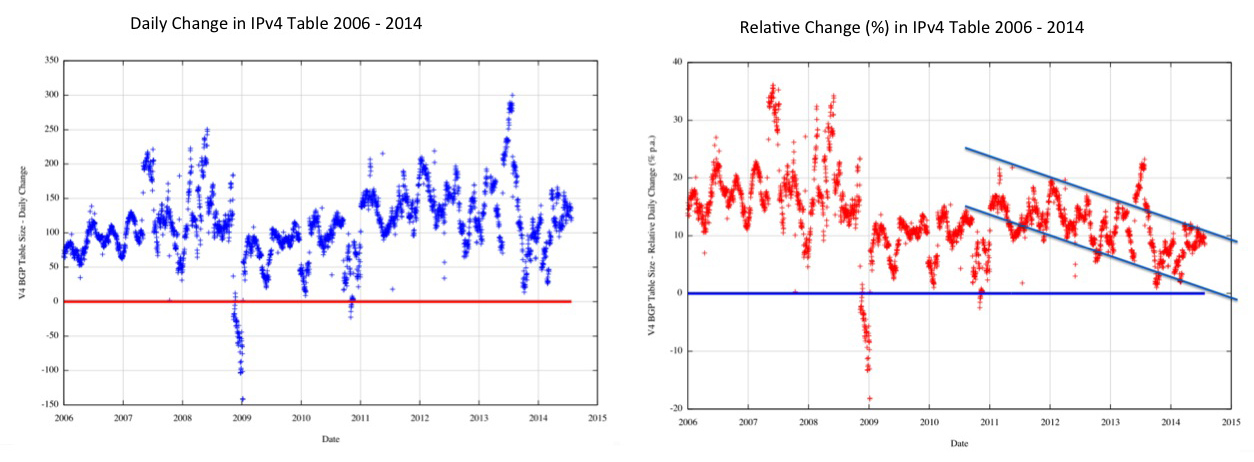
Figure 14: IPv4 Daily change in the Routing Table Size
Since 2011 the average growth of routing entries in the routing table has been relatively consistent at a long term average of some 140 net additional entries per day. In relative terms this represents a steady decline in relative growth, falling from a relative growth rate of some 15% p.a. in 2011 to around 9% my the third quarter of 2014. This slowing down of growth in the IPv4 network could be attributed to market saturation factors in many markets in the developed world, or possibly due to the exhaustion of IPv4 addresses, which has pushed much of the growth activity behind various forms of NATs. What these figures indicate is that the outlook for IPv4 table growth would best modeled on either a simple linear model, looking at a medium term growth rate of some 50,000 additional entries per year. This model implies a prediction of the IPv4 routing table reaching some 750,000 entries five years from now, in 2019.
However, it must be stated that this is just a model, and the model assumes continuity of the environment that drives routing table growth, and of course this is simply not going to be the case. In what I could describe as the most rational direction for the Internet, the momentum of IPv6 adoption gathers pace, and at some stage, within this five year outlook, there will be a critical mass of IPv6 deployment such that an IPv6-only end client will have a seamless experience on using the Internet. At that point the momentum behind further IPv4 growth would taper off, and then we would see the IPv4 network shrink as IPv6 assumed the role of the protocol platform for further growth of the Internet. But such a rational perspective of the medium term future has been constant over the past five years at least, and yet it has not eventuated. We have to recognize the possibility that we continue to use IPv4 over the coming five years, and absorb the growth pressures through more efficient use of addresses. This would imply increasing the pressures in address sharing in Network Address Translators, looking at ways to intensify the use of public address pools across larger populations of served clients, but may also imply the emergence of fine-grained routing advertisements. The current convention of a minimum advertised routing prefix size in the default free zone of the Internet of a /24 is indeed a common convention across network operators, and it is conceivable that the increasing address scarcity pressures may alter this convention. If we move to an Internet that can support the common acceptance of /25 routes, and even /32 routes, the predictions of the resultant routing table size are of course far more uncertain.
A similar exercise can be undertaken for the IPv6 address table, looking at the daily change in the number of routing entries (Figure 15).
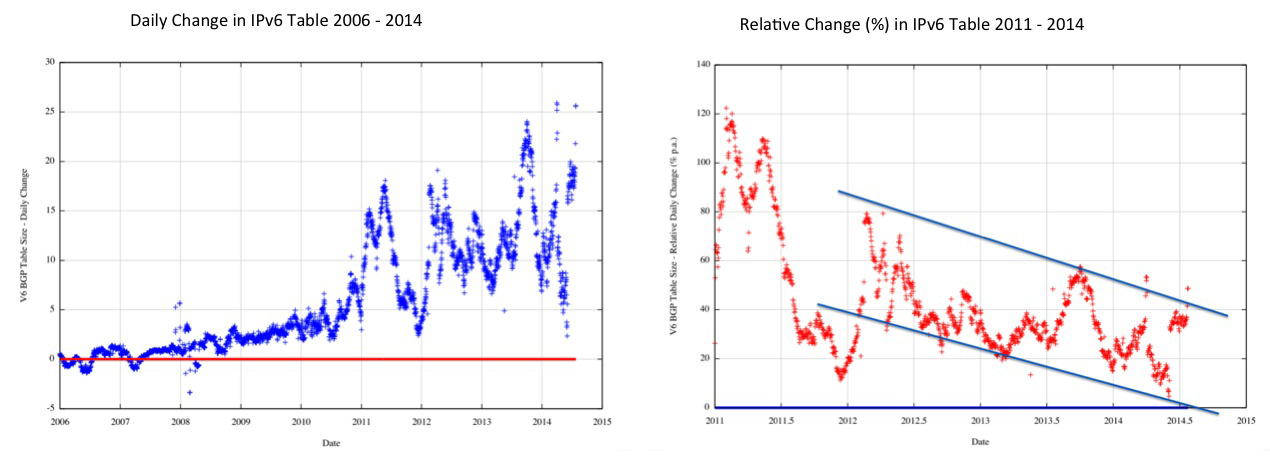
Figure 15: IPv6 Daily change in the Routing Table Size
The growth rates for the IPv6 routing table have increased from an early rate of less than 1 entry per day in 2006 to an average rate of some 12 new entries per day at present, with admittedly a high rate of variance. In relative terms, when this growth is expressed as a proportion of the routing table, the growth rate is slowing down, and the current relative growth rate is somewhere between 20% and 40% p.a. for IPv6.
While the values are small, the daily change in the table size for IPv6 shows an increase from 5 new entries per day in late 2011, to 10 in 2012 and rising toward 20 in late 2014. It may be perhaps optimistic, but one growth model that could fit this data series in an exponential growth model, with the total number of entries in IPv6 doubling every 2 years. Within these parameters of forecast growth we can anticipate an IPv6 table of 55,000 entries in early 2017, and some 120,000 entries in 2019, or some five years out from now.
Within the obvious bounds of uncertainty that accompany any such predictions, these are not particularly alarming numbers in terms of requirements for routing hardware. The routing table is stored in a memory structure, and the capacity and price of memory is related to the number of gates that can be placed into a single integrated circuit. So far Moore’s Law, postulated some 50 years ago, continues to hold sway, and the silicon industry has been able to double the number of gates on a chip every 18 months or so. If the routing space was growing at a faster rater than this then there may be some cause for concern about the future cost effectiveness of routers, but in the IPv4 network this is simply not the case. In IPv4 the linear growth model is far lower than the exponential growth model of Moore’s Law, so there is little cause for concern in that domain.
Of course this is a case where Moore’s “Law” was in fact more along the lines of conjecture and this is one case where past performance is no guarantee of future outcomes. So far the industry has interpreted Moore’s Law as an aspirational target and has managed to achieve in line with this expectation, but, as always, there are warnings that this will not always be the case.
For IPv6 the numbers are a little closer to Moore’s Law, if we take a model of the IPv6 routing table doubling in size every two years, then the IPv6 routing table is growing at a comparable pace. The mitigating factor here is that the absolute size of the IPv6 table is relatively small, and a 5 year growth outlook from 20,000 entries to some 120,000 entries is not an overly concerning prospect.
Predicting BGP Routing Update Growth
Are there other aspects of the growth of the routing system that we should be concerned about? The BGP protocol is a distance vector protocol, and a common weakness of such protocols is that the protocol reaches convergence by a process of repeated iteration of communication of updates between peer BGP speakers. Each time a BGP speaker receives information of a better path to a destination, it will pass this updated information to each of its other peers.
One would expect that as the number of routed entities increases, and as the number of Autonomous Systems (BGP “networks”) increases, then one would expect the number of updates in BGP to increase at a comparable rate. Of course BGP has a number of attributes that damp this growth in updates, including the use of TCP as a transport protocol, that removes the need for periodic flooding updates between peers, the use of a Minimum Route Advertisement Interval (MRAI) timer, that damps the updates between BGP speakers, and the use of the AS Path attribute, that prevents the “count to infinity” problem. However, these measures should not prevent any growth in the number of BGP updates. At best, they might mitigate such growth, but one would expect that, over time, as the Internet grows, the amount of bandwidth and processor capacity devoted to routing should increase as the size of the Internet increases. Over time routers should need faster processors and higher bandwidth to support the operation of BGP. At the same time a larger network with fixed protocol-defined timers should take more time to converge to a stable state. So we should expect to see an increase in the protocol‘s update message counts for each BGP speaker and extended convergence times as the Internet grows.
What do we see?
There is nothing visible in the observed data that supports these expectations. Over the past 8 years the number of entries in the IPv4 routing table has risen from 220,000 to 512,000 entries, yet the number of withdrawals has remained constant at some 10,000 prefix withdrawals per day (Figure 16). The number of prefix updates was relatively constant, averaging some 40,000 prefix updates per day, and since 2013 this has risen to some 80,000 prefixes updates per day. The level of protocol activity. The average time to converge has remained relatively constant at some 70 seconds (Figure 17).
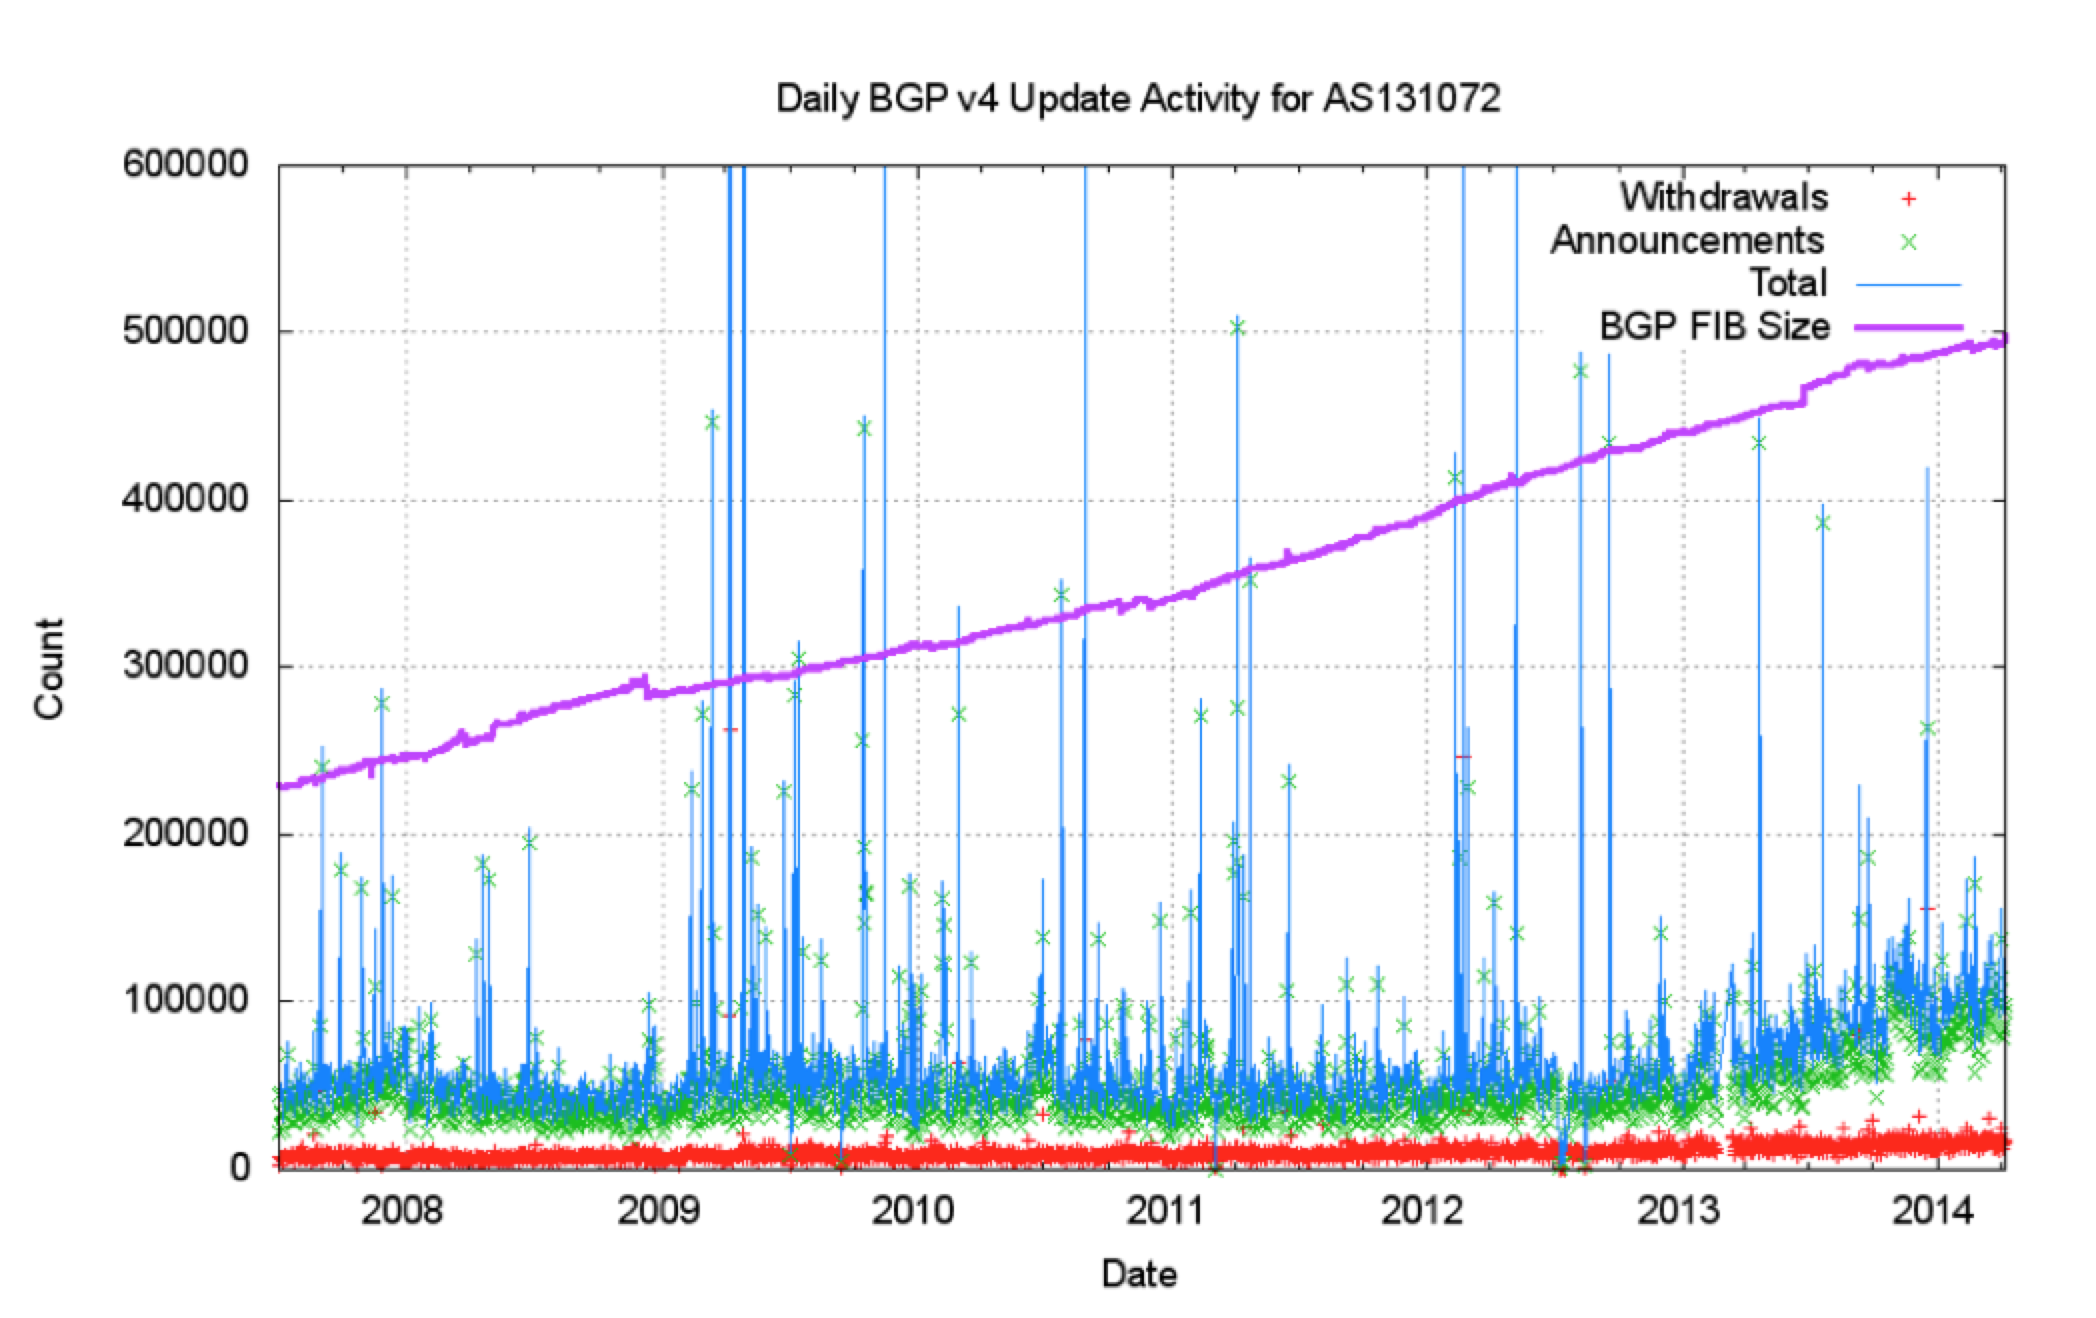
Figure 16: BGP Daily Update Activity for IPv4
The major reason for the observed behavior lies in the overall profile of the inter-AS topology. As the number of AS’s has increased, the additional AS’s all try and cluster towards the core of the Internet, and try and avoid attaching to the periphery. This results in an Internet that, as it grows, it becomes more dense rather than larger, and this increasing density that assists BGP to scale. The most appropriate metric to illustrate is the average AS Path Length, which has remained relatively constant for the past 15 years (Figure 18).
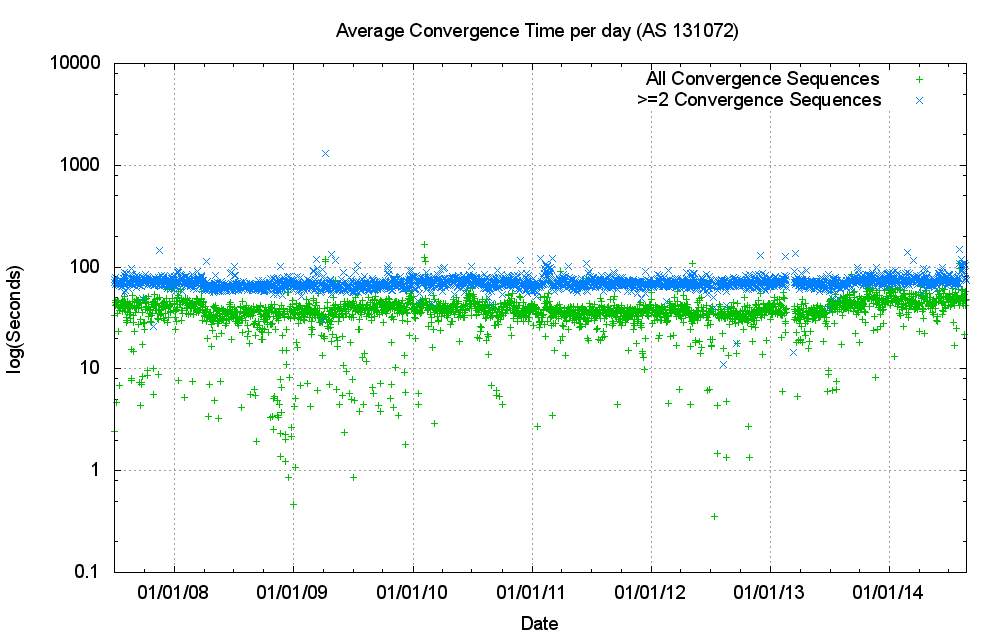
Figure 17: BGP Daily average convergence time for IPv4
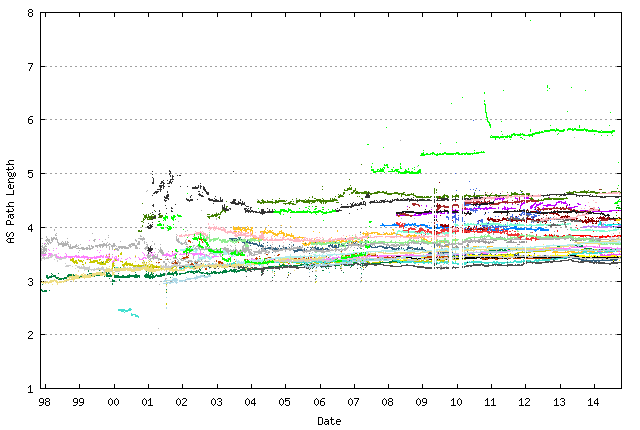
Figure 18: BGP Average AS Path Length for IPv4 (Route Views Peers)
The efforts with local peering, local exchange points, large scale multi-national transit providers all assist in absorbing growth without increasing the AS ‘diameter’ of the Internet, and these efforts have a direct benefit in preserving the performance of the routing protocol itself.
Are the same patterns evident in the IPv6 network?
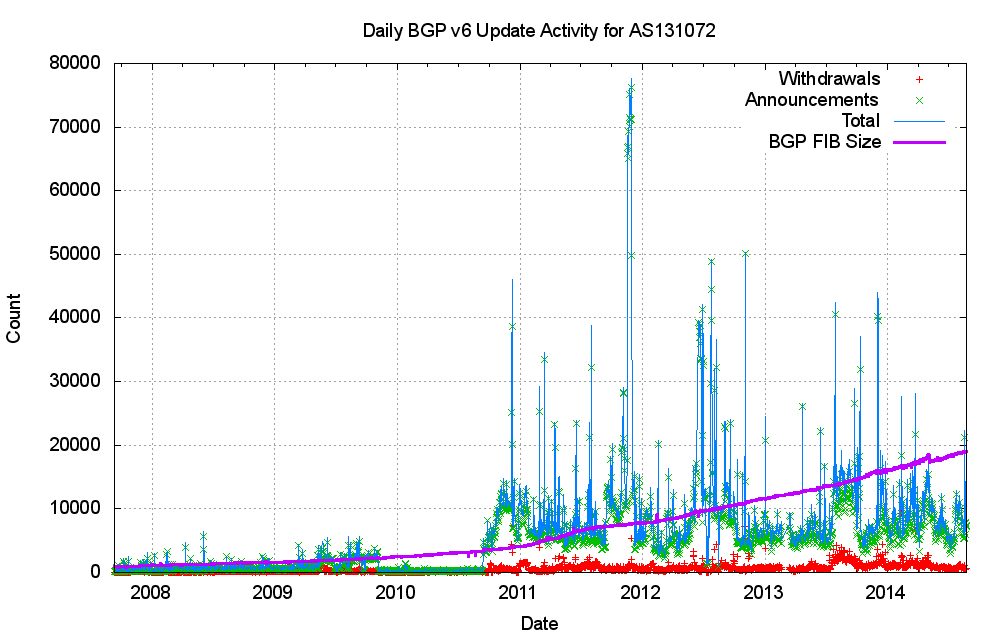
Figure 19: BGP Daily Update Activity for IPv4
It appears what while the IPv6 network is far smaller than the IPv4 network, its dynamic properties are very similar. The number of updates per day appears to be relatively constant, and is not growing in proportion to the size of the routing table (Figure 19). Equally, the convergence times are relatively constant in IPv6 (Figure 20).
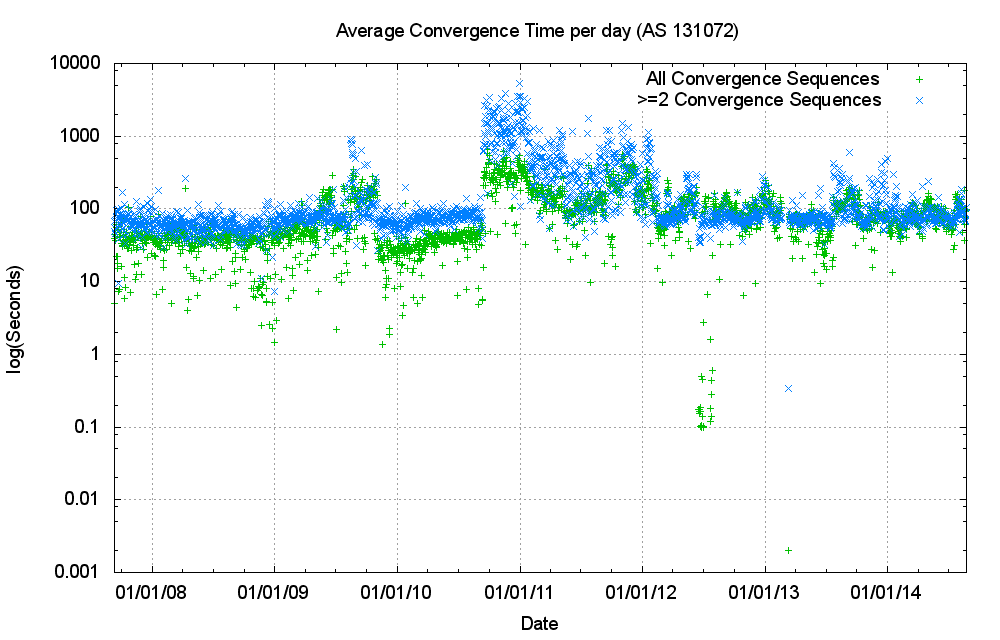
Figure 20: BGP Daily average convergence time for IPv6
Again, the major contributory factor here appears to be a relatively constant AS Path, which illustrates a property in the IPv6 network that is common with the IPv4 network, namely that growth of the Internet is expressed as increased inter-connection density in IPv6 rather than in longer AS paths that would be the result of growth at the periphery of the network.
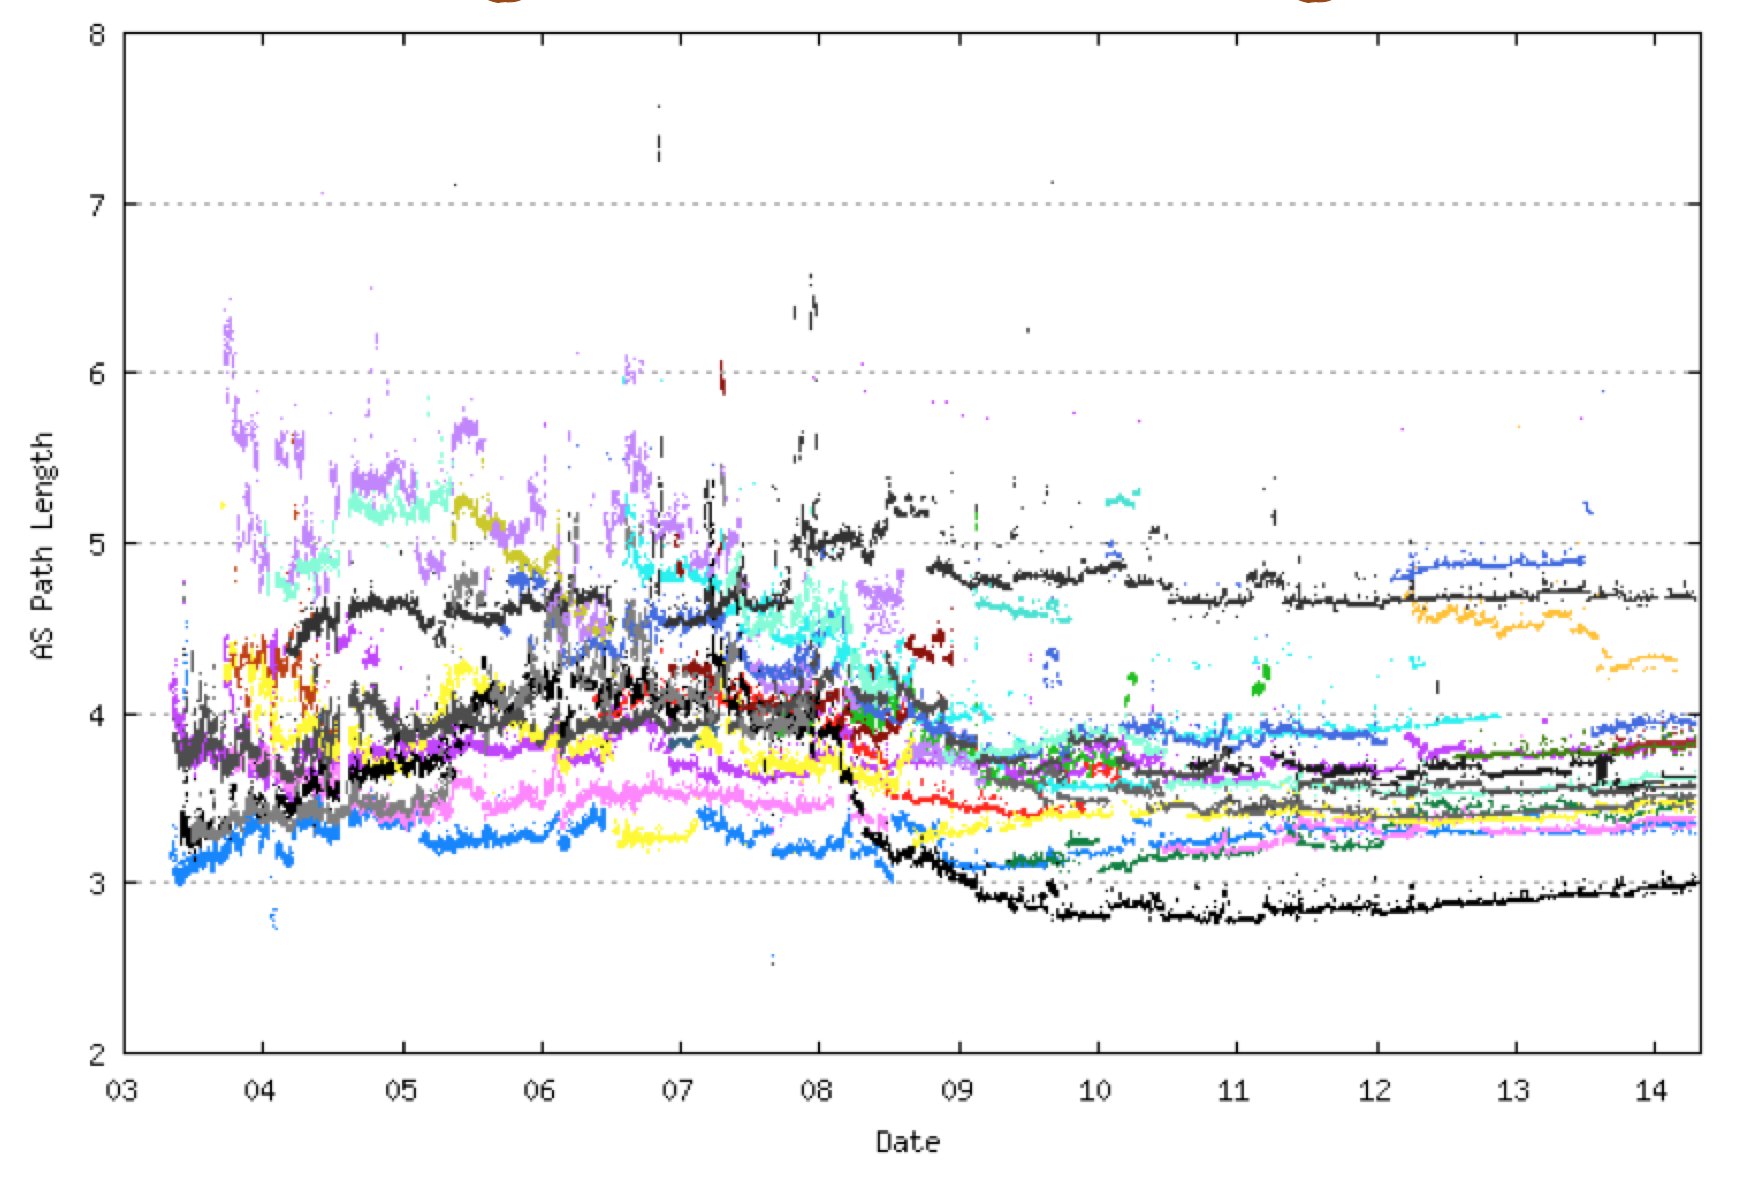
Figure 17: BGP Daily average AS Path Length for IPv6 (from Route Views)
The major conclusion here is that the dynamic growth up updates is also not a cause for significant concern at this time. As long as further growth of the Internet is expressed in terms of increasing the density of the network, and as long as prefix announcements are relatively stable, then the Internet is not placing extraordinary demands on routing equipment.
Predicting Speed
The other important parameter in terms of routing hardware is speed. The unit should be capable of processing each packet, and this implies that in the worst case the amount of processing time available is equal to the time taken for the shortest possible packet to arrive.
In the original 10Mbps Ethernet specification, the minimum packet size is 64 bytes, and the inter-packet gap and frame preamble accounted for a further 20 bytes. This implies that the maximum packet rate is 14,880 packets per second, or one packet every 67useconds. Since the original 10Mbps Ethernet specification was standardized in the early 1980’s the speed of transmission systems has increased dramatically. The pace of change in Ethernet speeds is shown in Figure 18.
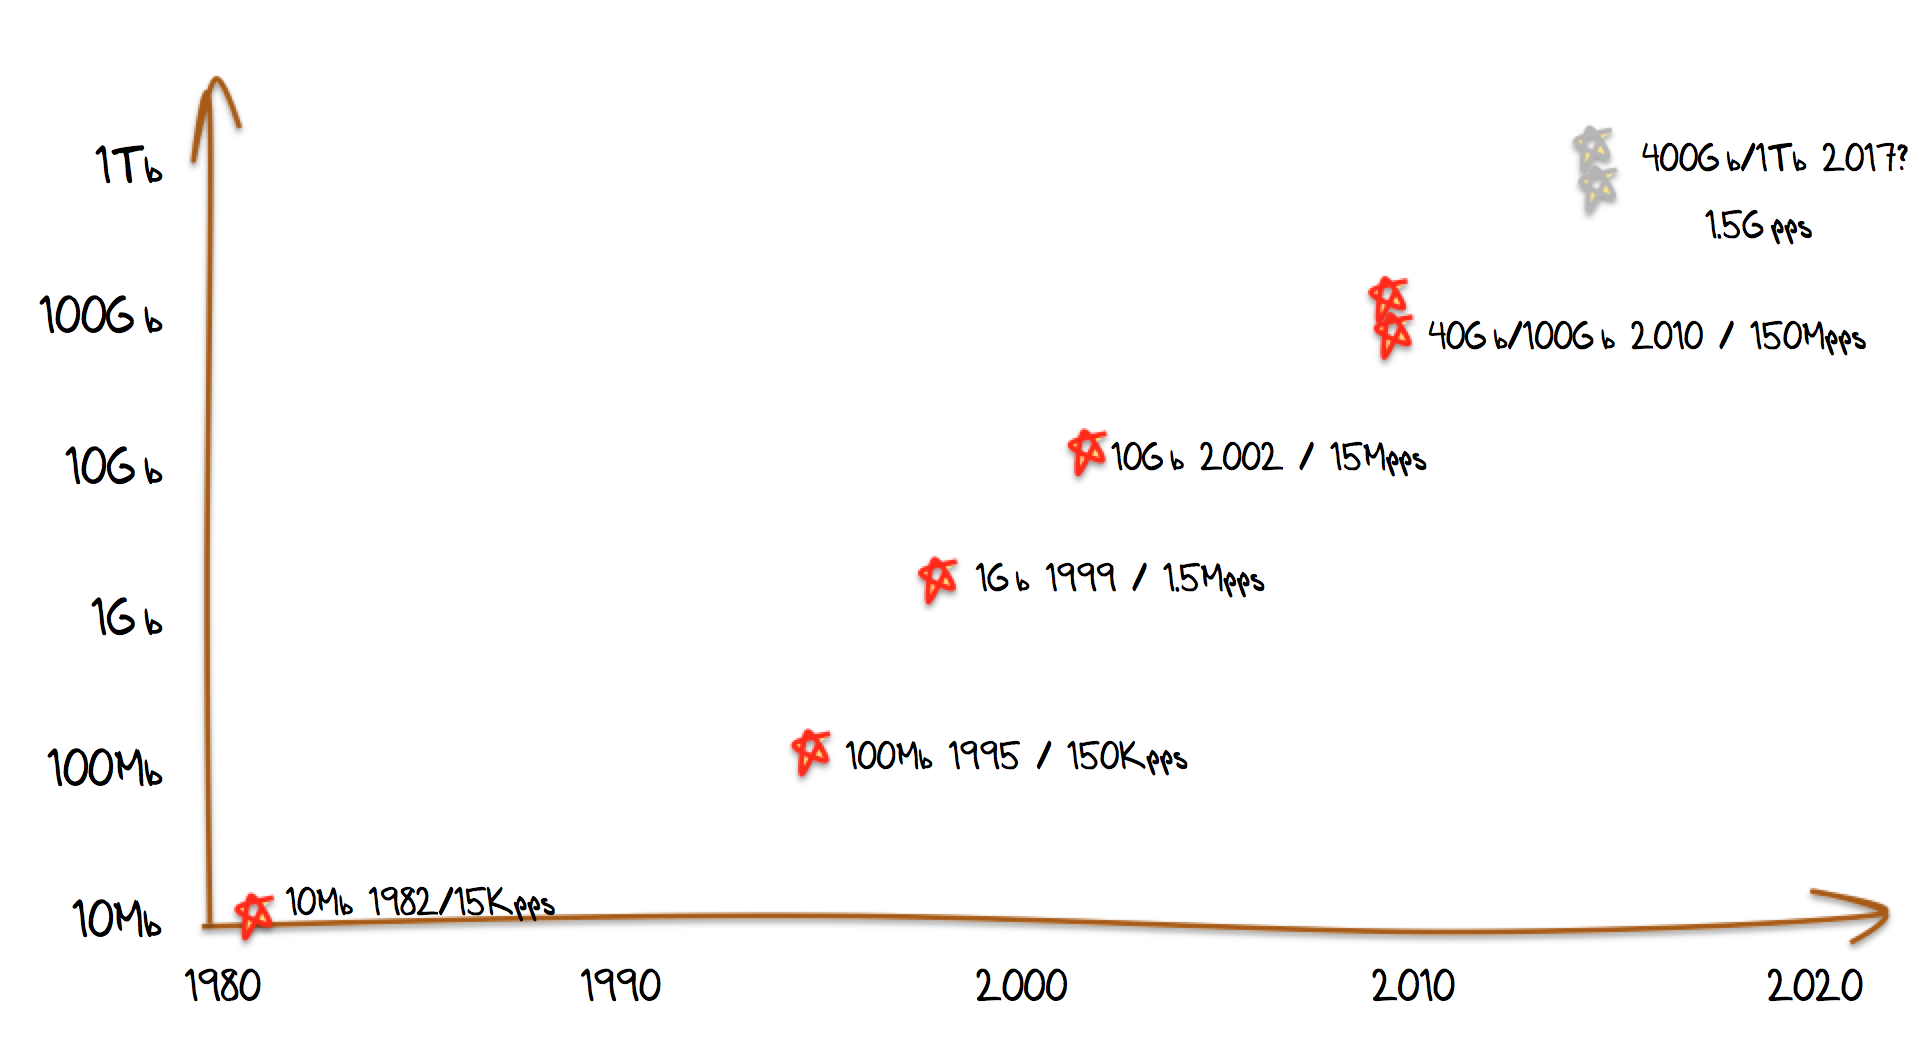
Figure 18: Ethernet Speeds
Across this evolution of carrier speed, the basic unit of the minimum packet size has remained constant at 84 bytes. This implies that for today’s 100G systems the maximal packet rate is some 150M packets per second, and the inter-packet arrival interval is now 6.7ns. Taking this further with the anticipated 1Tbps Ethernet specification, the inter-packet arrival interval would be cut by a further factor of 10 to 0.67 ns.
Beyond this predictions are difficult to make. Between 1995 and 2002 we saw the carriage speed rise from 10Mbps to 10Gbps, a thousand-fold increase in 7 years. But a further 8 years have elapsed until the standardization of the 100Gbps system in 2010. There is a degree of expectation that we will see a 1Tbps standard in 2017, but beyond that there is no visible consensus on where and how any further speed increases may be realized.
Router Specifications
What if you wanted to purchase a router today and wanted it to have a production lifetime of at least 10 years? What are the basic specifications that such a unit would need to meet in order to address the anticipated demands of a ten year service life routing the public Internet using BGP?
The processor speeds are not a major issue in terms of processing BGP routing updates. It appears that the drive from network operators to maximise connectivity has a positive feedback in terms of limiting the growth of network updates, and the processing capability required to keep pace with today’s BGP would not be significantly different from that required in ten years time.
However it’s not the same story in terms of Forwarding Table sizes. At the start of 2014 a TCAM with capacity for 512,000 IPv4 entries and 25,000 IPv6 entries would’ve been adequate, but by the end of the year these numbers are inadequate. Ten years is possibly an adequate amount of time to see the transition to IPv6 through to completion in an optimistic scenario, in which case it may no longer be necessary to provide any residual IPv4 support. But this transition has so far taken longer than anyone would’ve predicted even ten years ago, so perhaps in terms of estimating future needs for routing equipment, a more pessimistic outlook should be taken. That outlook would see further fragmentation of the IPv4 address space, and that pessimistic scenario would see the IPv4 routing table approach 1 million entries in late 2019, and possible 2 million entries by 2024. In addition we need to include consideration of the IPv6 forwarding table. Assuming some form of momentum behind continued uptake of IPv6 in the coming years, we can anticipate the IPv6 routing table growing to some 125,000 entries by 2019. Beyond that it’s more challenging to predict. If one were to predict that we would continue to use fine-grained routing control to perform traffic engineering, and use prefix blocks for network policy discrimination then we could anticipate that the level of routing fragmentation in IPv6 would rise to the same levels we see in IPv4 today. If that’s the case then at the ten year point we can anticipate an IPv6 routing table of some 512,000 entries ten years from now. The implications of these ten year predictions for TCAM and TRIE sizes for Line Interface Forwarding Table memory are shown in Figure 19.
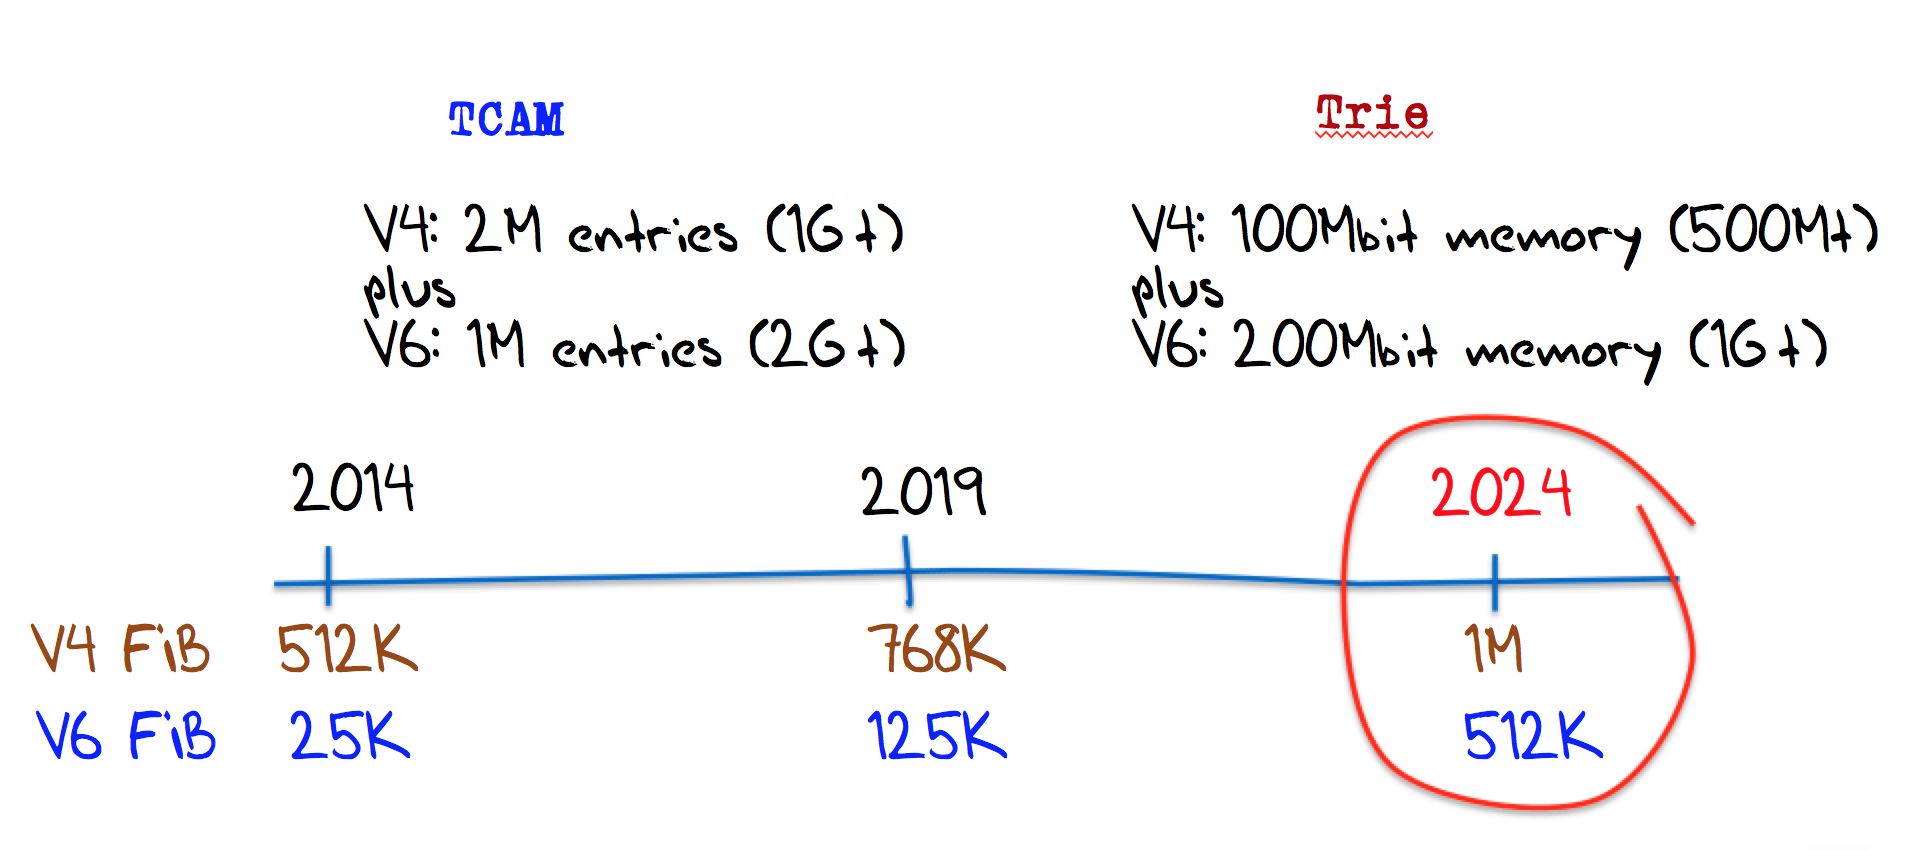
Figure 19: FIB Size Predictions
While Moore’s Law talks about the number of gates in an integrated circuit, it does not make the same prodigious predictions over the speed of the chip’s clock, and clock speeds certainly have not doubled each 1 or 2 years. The fastest available commodity DRAM memory uses a clock cycle time of between 40ns to 50ns, which is far too slow for 100Gbps, let alone 1Tbps. Router memory uses specialist high speed memory, such as DDR3DRAM and RLDRAM, which have clock speeds of up to 9ns and 1.9ns respectively. This is at a speed comparable with a 100Gbps transmission system, and this is the form of memory used in today’s routers.
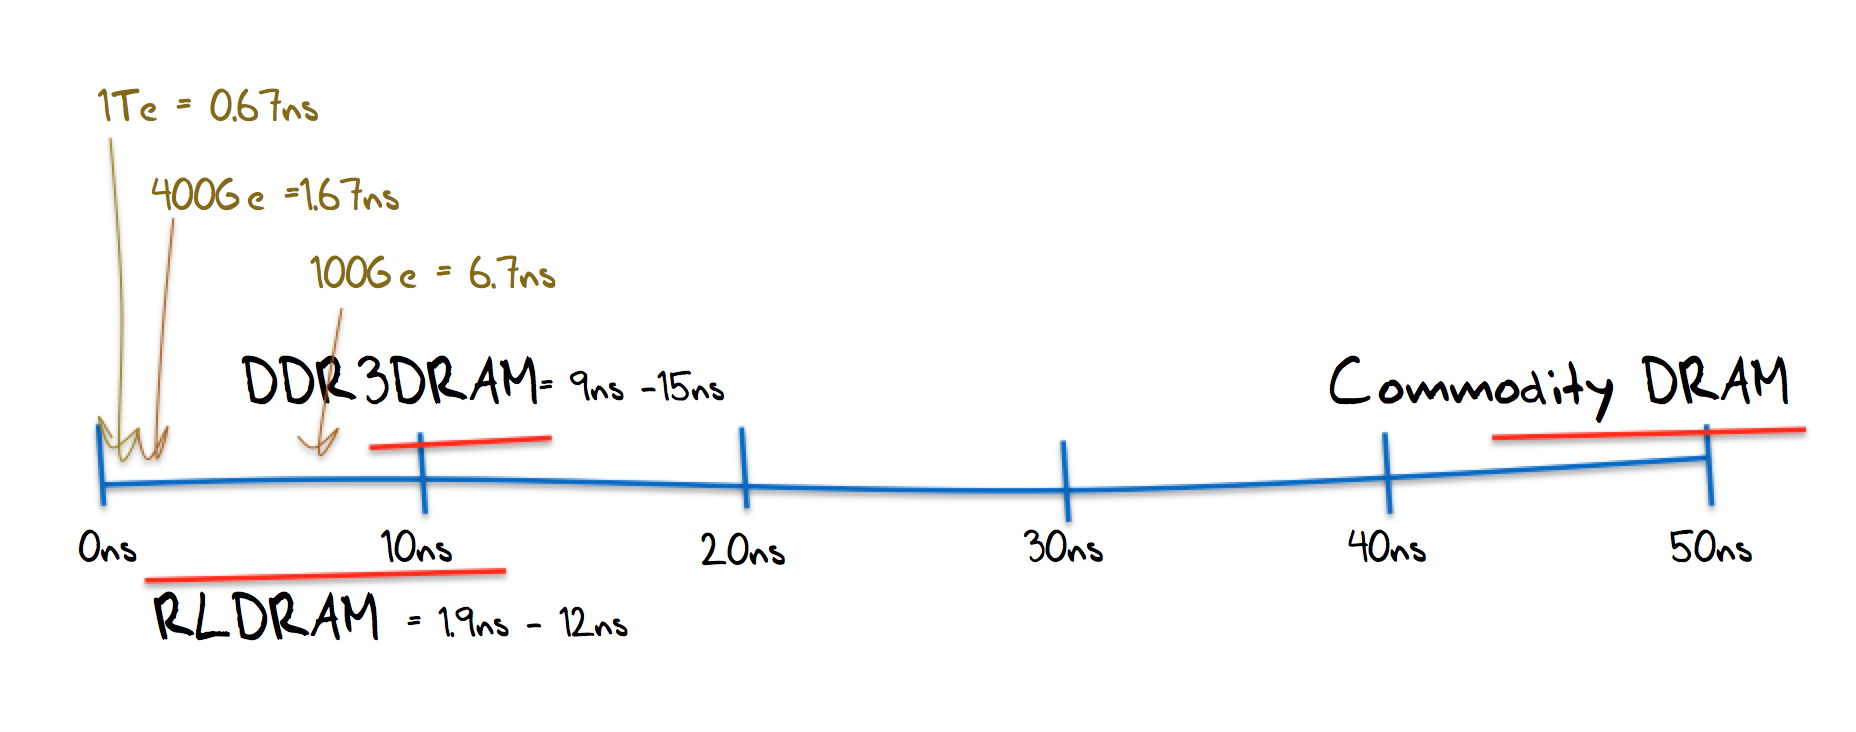
Figure 20: Memory Speeds and Transmission Speed Maximum Packet Rate Intervals
If we want this router to survive a production lifetime of ten years then the line speeds present a challenge. If the network sits on 100G transmission systems over this period then current state of the art high speed memory would be adequate, but that's a rather unrealistic expectation. Within this ten year span we will most likely see the emergence of 1Tbps transmission systems, and it that’s the case then we are going to have to improve the clock speeds in both memory and in the line card’s packet processing engines to operate at a sub-nanosecond clock speeds. I suspect that this clock speed issue may be the harder challenge and this may call for the more imaginative solutions in router design in the continuing effort to meet the demands of an ever-growing Internet.
In the computing world the quest for ever faster computers quickly turned from a quest for faster clock speeds across a giant monolithic system into a quest for ever larger amounts of parallelism. That way the computer industry was able to meet escalating demands for processing capability and throughput without resorting to exotic technologies in order to support extremely high clock speeds. It may be the case that the Internet is on the verge of a similar threshold in the design of transmission and switching systems. To date the effort has been largely one of increasing clock speeds in what is essentially a serial paradigm. BGP is a single best path selection routing protocol and efforts to introduce serialism, such as in equal cost multi-path selection, or other forms of dispersed traffic across multiple paths in parallel have not proved to be all that robust in an inter-AS routing environment. But we can’t rely on turning up the clock speed indefinitely.
At some point we may need to take some of the intra-AS approaches to traffic management across parallel paths, using various forms of path pinning, segment routing, and multi-path routing and apply it to the inter-AS routing space, so that we would be looking at further speed increases through the explicit approach of parallelism.
Of course there is also Plan B. It we really want to reduce the maximal packet rate on high speed transmission systems, we can always contemplate lifting the minimum packet size. If the minimum packet size had kept itself in proportion to carriage speed, a 64byte minimum packet on a 10Mbps system would be a 64,000 bytes minimum packet on a 10Gbps system, and a 1.2Mbyte packet on a 1Tbps system. Maybe seeking to keep the maximum packet rate to some 15,000 packets per second is perhaps a little too ambitious, but perhaps when we contemplate these 1Tbps systems then perhaps we should reserve some time to think about speed and capability and think about whether its time to revise the minimum packet sizes on these ultra high speed systems.
Either way, while the next five years of Internet growth can be predicted with a reasonable degree of certainty, trying to push this range of visibility out to 10 years is a tough ask. The continual pressures of scale and speed don't look as if they are stopping anytime soon, so no doubt sometime in the future we will encounter more Internet “bad hair” days, as deployed equipment trips over further basic limitations in their size and speed in the face of the Internet’s inexorable continuing growth.
![]()
Disclaimer
The above views do not necessarily represent the views of the Asia Pacific Network Information Centre.
![]()
About the Author
GEOFF HUSTON is the Chief Scientist at APNIC, the Regional Internet Registry serving the Asia Pacific region.