|
The ISP Column
A column on things Internet
|
|
|
Other Formats:
|
|
|
|
|
Addressing 2012 - Another One Bites the Dust
January 2013
Geoff Huston
Time for another annual roundup from the world of IP addresses. What happened in 2012 and what is likely to happen in 2013? This is an update to the reports prepared at the same time in previous years, so lets see what has changed in the past 12 months in addressing the Internet, and look at how IP address allocation information can inform us of the changing nature of the network itself.
The Internet is inexorably changing, and the predominate theme of today's network is the dramatic uptake of the mobile device. Whether its an Apple iPhone, or a Samsung Galaxy SIII, a Nokia Lumina, or any one of a myriad of other mobile devices that have transformed the mobile phone onto an Internet device, the sheer volume of deployment of these devices has been the dominant factor in the growth of the Internet in 2012.
In November 2012 Gartner released its estimate of the worldwide mobile device sales for the third quarter for 2012, showing a total sales volume for the quarter of 169 million smartphone devices, a growth of 15.4 million devices over the previous quarter. It will be a few weeks before the figures are out for the final quarter of 2012, but at this rate it appears that we will have purchased a total of 657 million mobile smartphone devices by the end of this year. In terms of market share, Android-based devices account for some 64% of all sales, and Apple's iPhone some 20%.. If you add to this number a further 122 million estimated tablet sales for 2012, the total number of these mobile devices sold during 2012 looks like totalling some 779 million units seeking Internet connectivity in the wireless world.
The growth in the wired world of the Internet is not so dramatic. The large scale deployment exercised for residential broadband has achieved market saturation in many of the more developed parts of the world where the GDP per capita exceeds some $20,000. Where the GDP per capita is lower the levels of broadband penetration are also lower, perhaps because of the higher rural populations and the basic issues of affordability. The estimated total number of Internet users worldwide grew from 2.06 billion at the start of the year to 2.3 billion by the end of the year, a growth of some 240 million million users.
So growth continues, and if one looks at the mobile numbers this is the highest level of growth of the Internet that we've ever witnessed. It would appear that we've added some 850 million new devices to the Internet, and perhaps retired some 200 – 300 million over the same period, leaving a net growth of 500 million new devices.
Where are these devices? How is the Internet changing as a result of this activity? Let's use the lens of address allocation records to see how the Internet fared in 2012.
Growth of the Internet
In terms of the allocation of public address space as a metric, pace of growth of the Internet slowed down substantially in 2012. The allocation of 115 million addresses in 2012 on top of a base of 3,368 million addresses that were already allocated at the start of the year represents a growth rate of 3.4% for the year. This is approximately one half of the growth in 2011, and represents the lowest relative growth rate we've seen in recent years.
I suspect this is due to the exhaustion of available IPv4 address space in Asia throughout the year, and the onset of the same exhaustion state at the RIPE NCC in mid-September, affecting the European and Middle East region. This is compounded by a long-standing economic malaise that has impacted much of the European and North American markets over 2012, which has impacted consumer sentiment and the sales volumes of mobile devices throughout the year.
| 2005 | 2006 | 2007 | 2008 | 2009 | 2010 | 2011 | 2012 | |
| Allocated IPv4 Addresses (Millions) | 174.4 | 168.1 | 203.9 | 203.3 | 189.4 | 248.8 | 201.0 | 114.0 |
| Relative Annual Growth | 8.0% | 7.7% | 8.8% | 8.0% | 6.9% | 8.4% | 6.3% | 3.4% |
Table 1 - IPv4 Allocated Addresses by Year
During 2012 the total number of IPv4 addresses allocated from the RIRs, supporting the growth of the Internet, was one half of record 2010 level. However before leaping to conclusions relating to a dramatic decline in investment in new network infrastructure, its useful to break this number down on a per-RIR basis, to understand the impact of address exhaustion in APNIC relative to the other regions.
Which economies received these addresses? At a regional level its possible to compare the allocations made by each RIR.
| IPv4 Addresses | 2005 | 2006 | 2007 | 2008 | 2009 | 2010 | 2011 | 2012 |
| APNIC | 53.6 | 51.4 | 69.6 | 87.8 | 86.9 | 120.2 | 105.2 | 1.0 |
| RIPE NCC | 61.2 | 55.0 | 60.7 | 44.0 | 43.4 | 56.0 | 43.1 | 40.0 |
| ARIN | 47.2 | 46.5 | 53.0 | 57.1 | 41.1 | 45.2 | 23.5 | 45.0 |
| LACNIC | 10.4 | 10.7 | 14.2 | 12.0 | 10.5 | 13.0 | 24.4 | 21.0 |
| AFRINIC | 0.9 | 2.6 | 5.5 | 1.6 | 5.9 | 8.5 | 9.2 | 7.9 |
Table 2 - IPv4 Allocated addresses (millions) - Distribution by RIR
In 2012 APNIC allocated 1 million addresses, down 99% from the 105 million that were allocated in 2011. APNIC effectively exhausted its general use pool of addresses in April 2011, and since then it has been operating under the terms of a "last /8" policy that limits each allocation to at most 1024 addresses. APNIC recorded some 1,160 individual address allocations in 2012, with an average allocation size of 869 addresses per allocation.
The RIPE NCC also exhausted its general use pool of addresses in mid-September 2012. The RIPE NCC allocated some 40 million addresses in 2012, of which 39.3 million addresses were allocated in the first 9 months of the year, and some 700,000 addresses were allocated in the ensuing three months. The average allocation size in the first nine months of the year was 8,876 addresses (over a total of 4,426 allocations) while in the last three months the average allocation size was 1,138 addresses (over a total of 606 allocations). The address allocation rate post-exhaustion stands at 5% of the pre-exhaustion address allocation rate.
But what of the other regions? In the case of ARIN the total allocated address count has doubled from 2011 levels, and it now at the same level as 2010, In South America and the Caribbean the count of allocated addresses is only slightly lower than the 2011 level, which, at 20 million addresses per year, is approximately double the 2005 – 2010 allocation rate. A similar jump in address allocation rates was experienced by Afrinic in 2010, and the 2012 address allocation rate is similar to the past 2 years.
Which economies are leading this continued growth in IPv4 services?
| IPv4 Addresses (/32s, Millions) | ||||||||||||
| Rank | 2007 | 2008 | 2009 | 2010 | 2011 | 2012 | ||||||
| 1 | USA | 48.47 | USA | 53.79 | China | 50.67 | China | 45.2 | China | 53.07 | USA | 28.2 |
| 2 | China | 37.29 | China | 46.49 | USA | 38.55 | USA | 42.32 | USA | 21.21 | Canada | 16.7 |
| 3 | France | 13.38 | Japan | 10.06 | Japan | 11.04 | Rep.Korea | 25.73 | Japan | 16.91 | Brazil | 8.4 |
| 4 | Germany | 11.22 | Rep.Korea | 7.96 | Rep.Korea | 10.95 | Japan | 10.02 | Rep.Korea | 7.68 | Russia | 5.3 |
| 5 | Rep.Korea | 7.73 | Germany | 7.29 | Russia | 5.46 | Australia | 9.63 | Indonesia | 7.09 | Iran | 4.5 |
| 6 | Japan | 7.14 | Brazil | 6.29 | Brazil | 4.19 | India | 9.43 | Brazil | 6.29 | Germany | 3.4 |
| 7 | UK | 6.41 | Russia | 6.12 | UK | 4.19 | UK | 8.13 | India | 6.01 | South Africa | 3.4 |
| 8 | India | 5.61 | Italy | 5.85 | Italy | 4.16 | Germany | 6.97 | France | 5.39 | Italy | 3.3 |
| 9 | Mexico | 5.24 | India | 4.23 | France | 3.85 | Russia | 6.46 | Russia | 5.02 | Colombia | 2.6 |
| 10 | Italy | 5.09 | Taiwan | 4.18 | Germany | 3.6 | Brazil | 6.29 | Germany | 4.92 | Romania | 2.6 |
Table 3 - IPv4 Allocated addresses - Top 10 Economies 2007 - 2012
With the exhaustion of IPv4 addresses in the Asia Pacific region China, Korea, Japan and India no longer are in the top 10 countries for IPv4 address allocations, and the Europe and Middle East economies,, namely Russia, Germany, Italy and Romania will be listed here for the last time.
Running out at RIPE: was there last minute panic?
In the Asia Pacific region there was a strong element of panic visible in the address consumption figures for the period January – April 2011. The average number of addresses allocated per week by APNIC across 2010 was some 2.3 million addresses per week, whereas the first 14 weeks of 2011 saw the volume of allocations triple to an average of some 6.9 million addresses per week. Figure 1 shows the week-by-week allocated address volume comparing 2010 (green) with 2011 (red). The surge in address allocations in weeks 8 – 20 in 2011 in APNIC is clearly evident here.
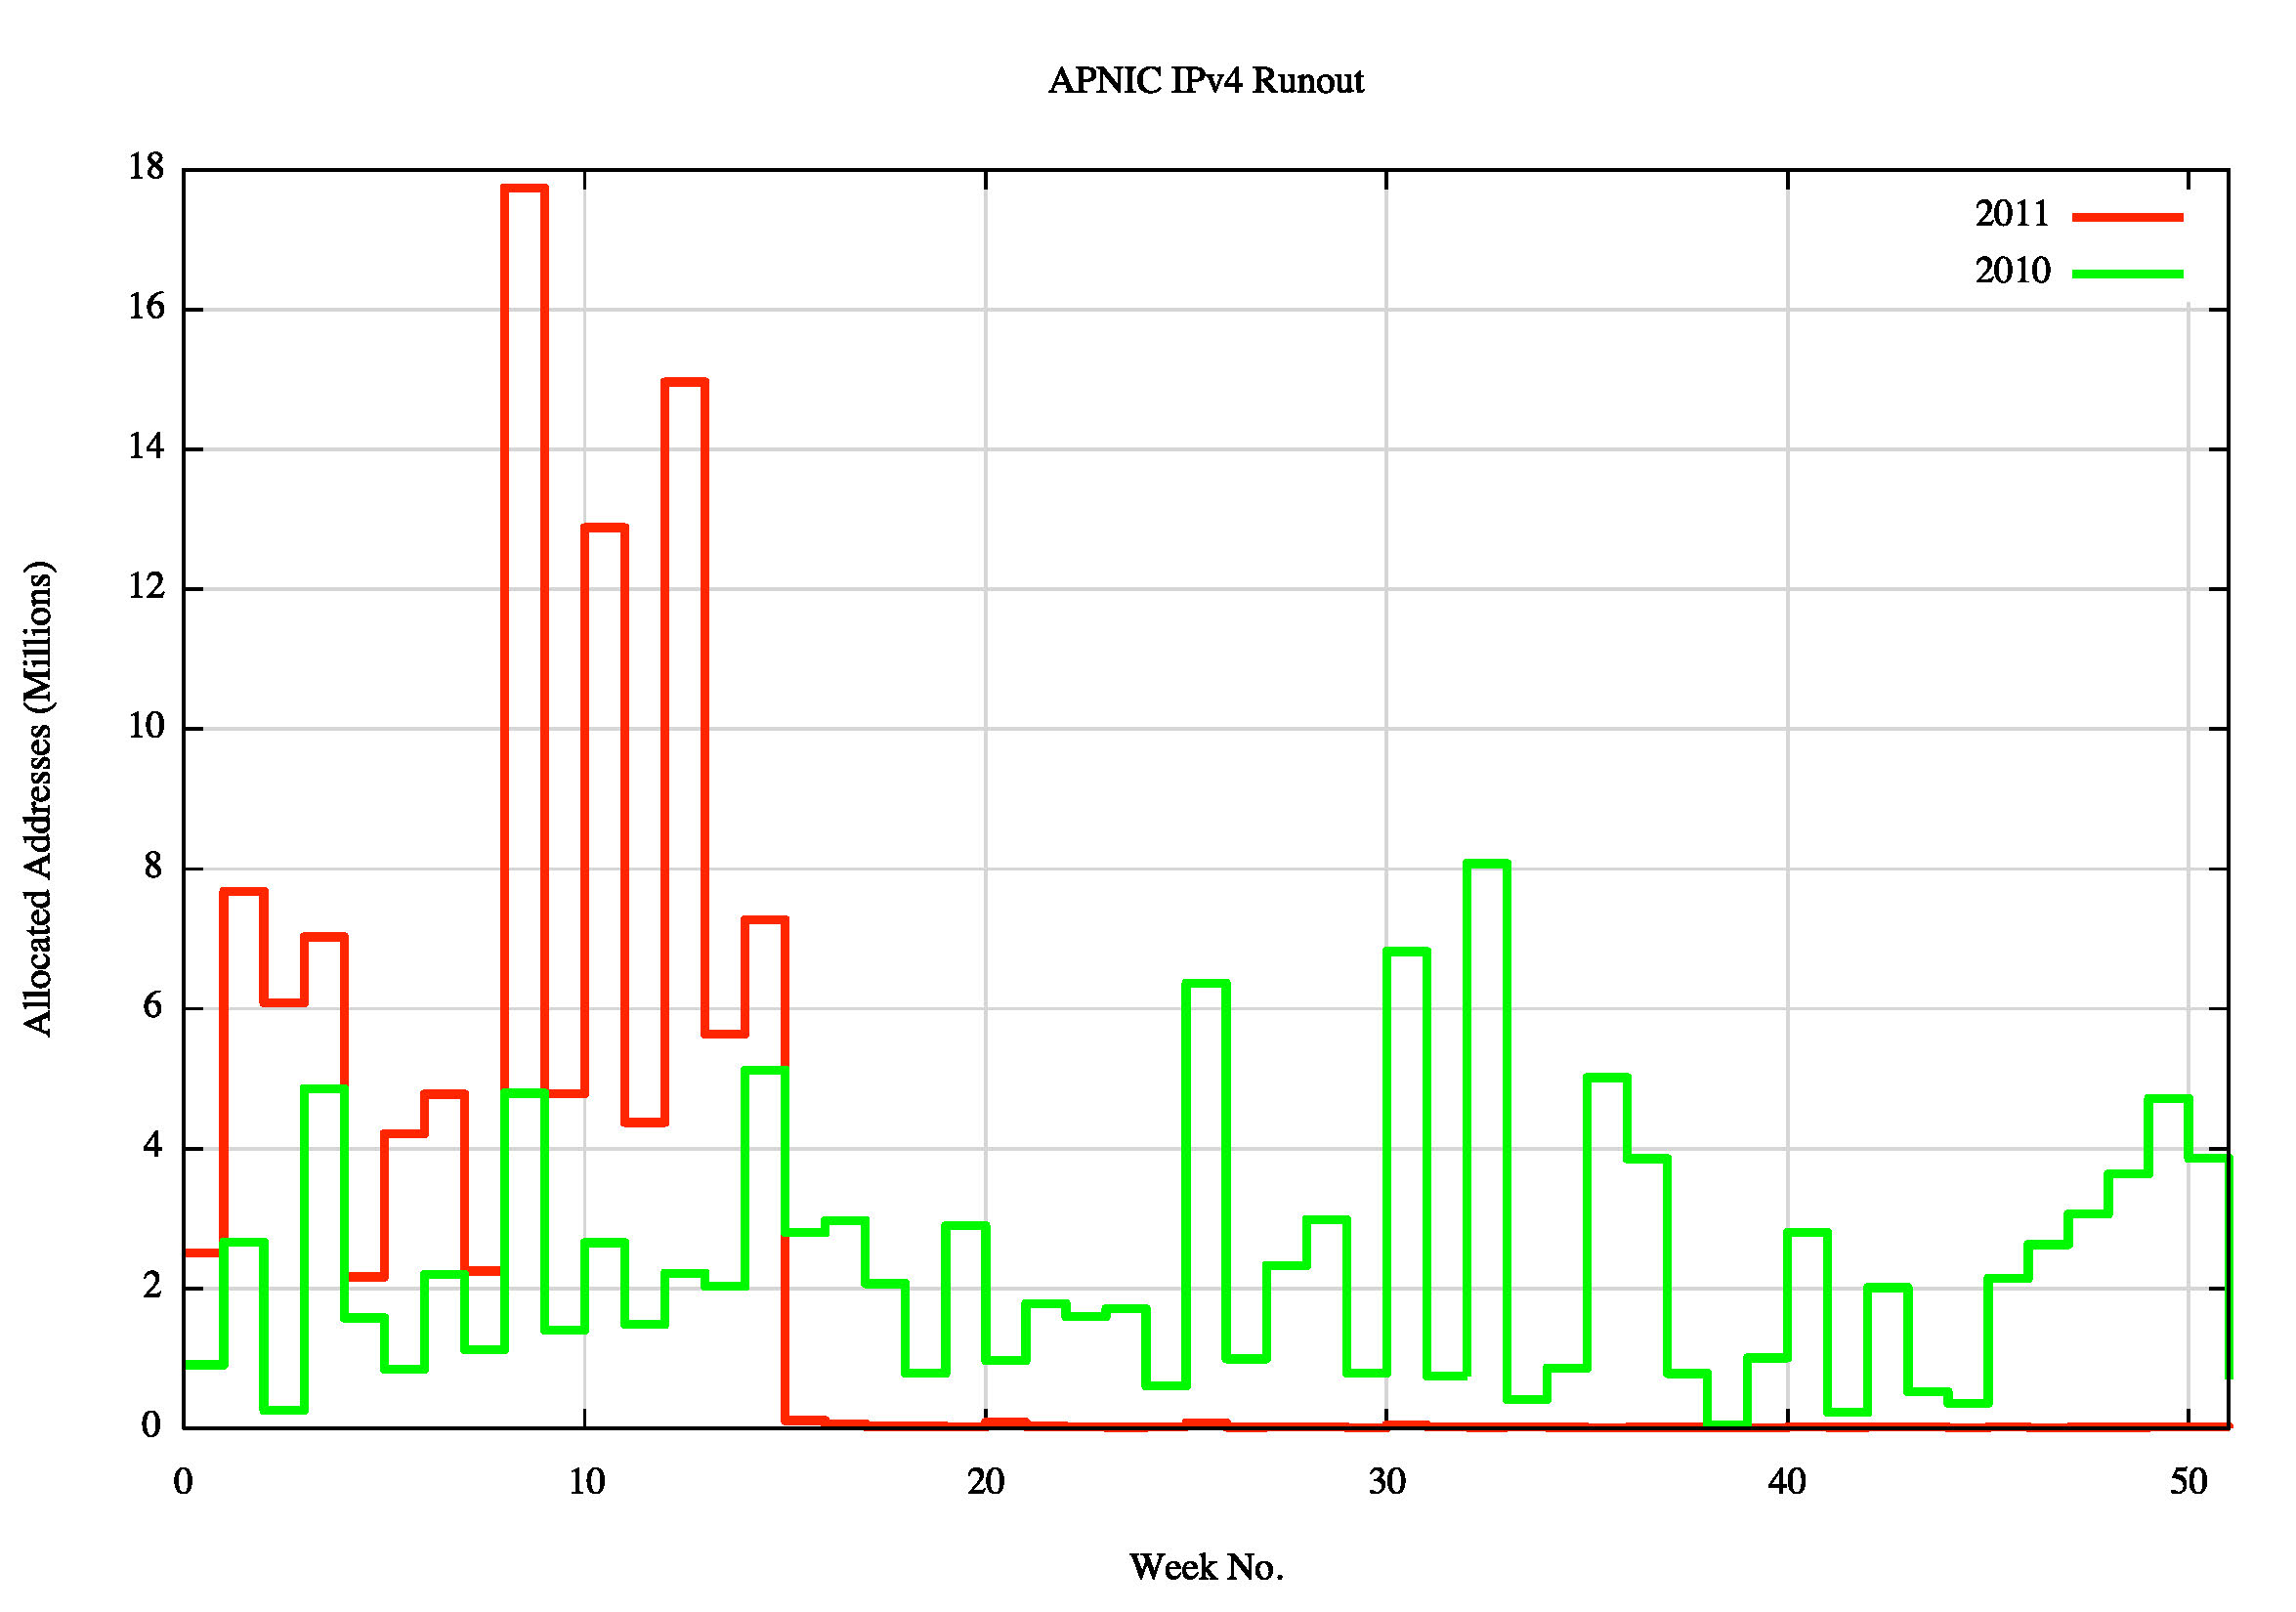
Figure 1 APNIC Weekly Address Allocation Levels: 2010 - 2011
The RIPE NCC did not experience the same level of a last minute "rush" at the registry. Through 2011 the average weekly address allocation vole was some 828,000 addresses per week. For the first 37 weeks of 2012 the average address allocation rate rose by some 25% to 1.05 million addresses per week, a far lower rise than that experienced by APNIC. Figure 2 shows a similar week-by-week comparison for the RIPE NCC, comparing 2011 with 2012. While the final two weeks in September 2012 saw the RIPE NCC distribute more than 2 million addresses per week, this is not that unusual, in that this weekly allocation volume had been reached twice earlier in 2012 and three times in 2011.
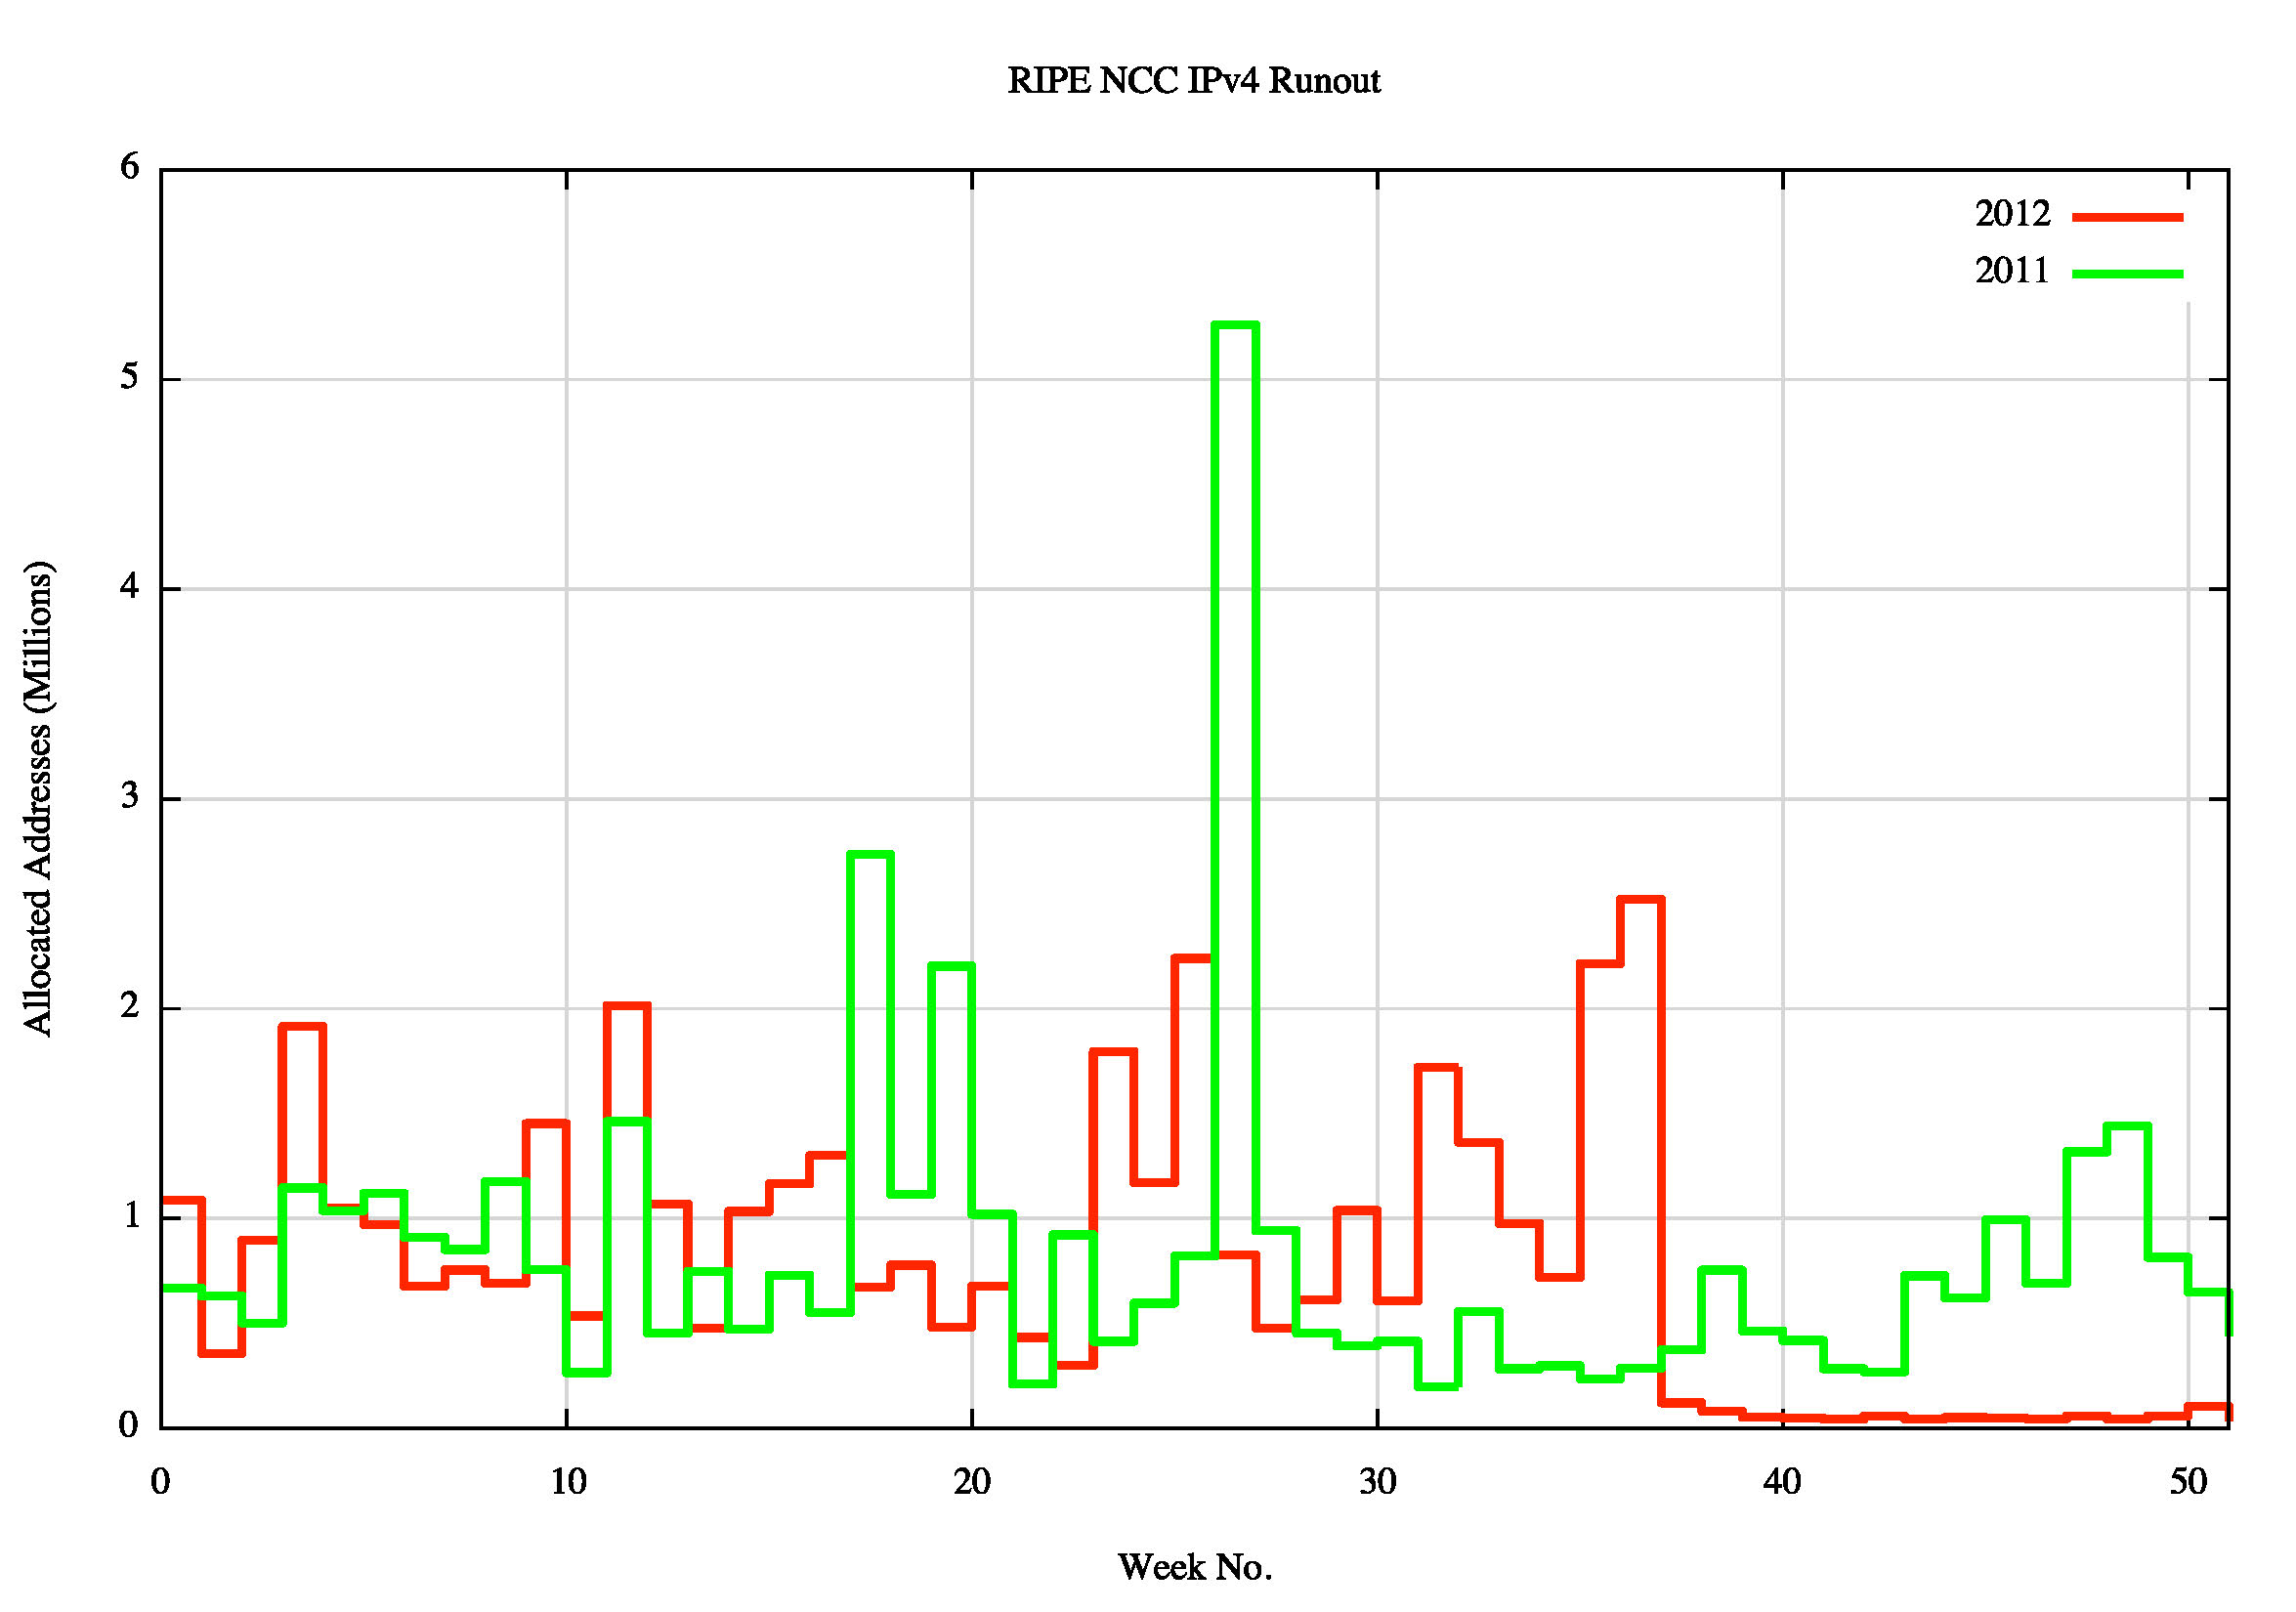
Figure 2 RIPE NCC Weekly Address Allocation Levels: 2011 - 2012
The data for RIPE shows that in this region there was no last minute rush of IPv4 address applications being lodged at the registry. The registries actions in informing the industry actors in the region of the evolving situation and the timeline to exhaustion appears to have averted much of the last chance panic that was evident in the Asia Pacific region.
A similar set of figures for the other four registries, comparing 2011 with 2012 in a week by-week basis are shown in Figure 3.
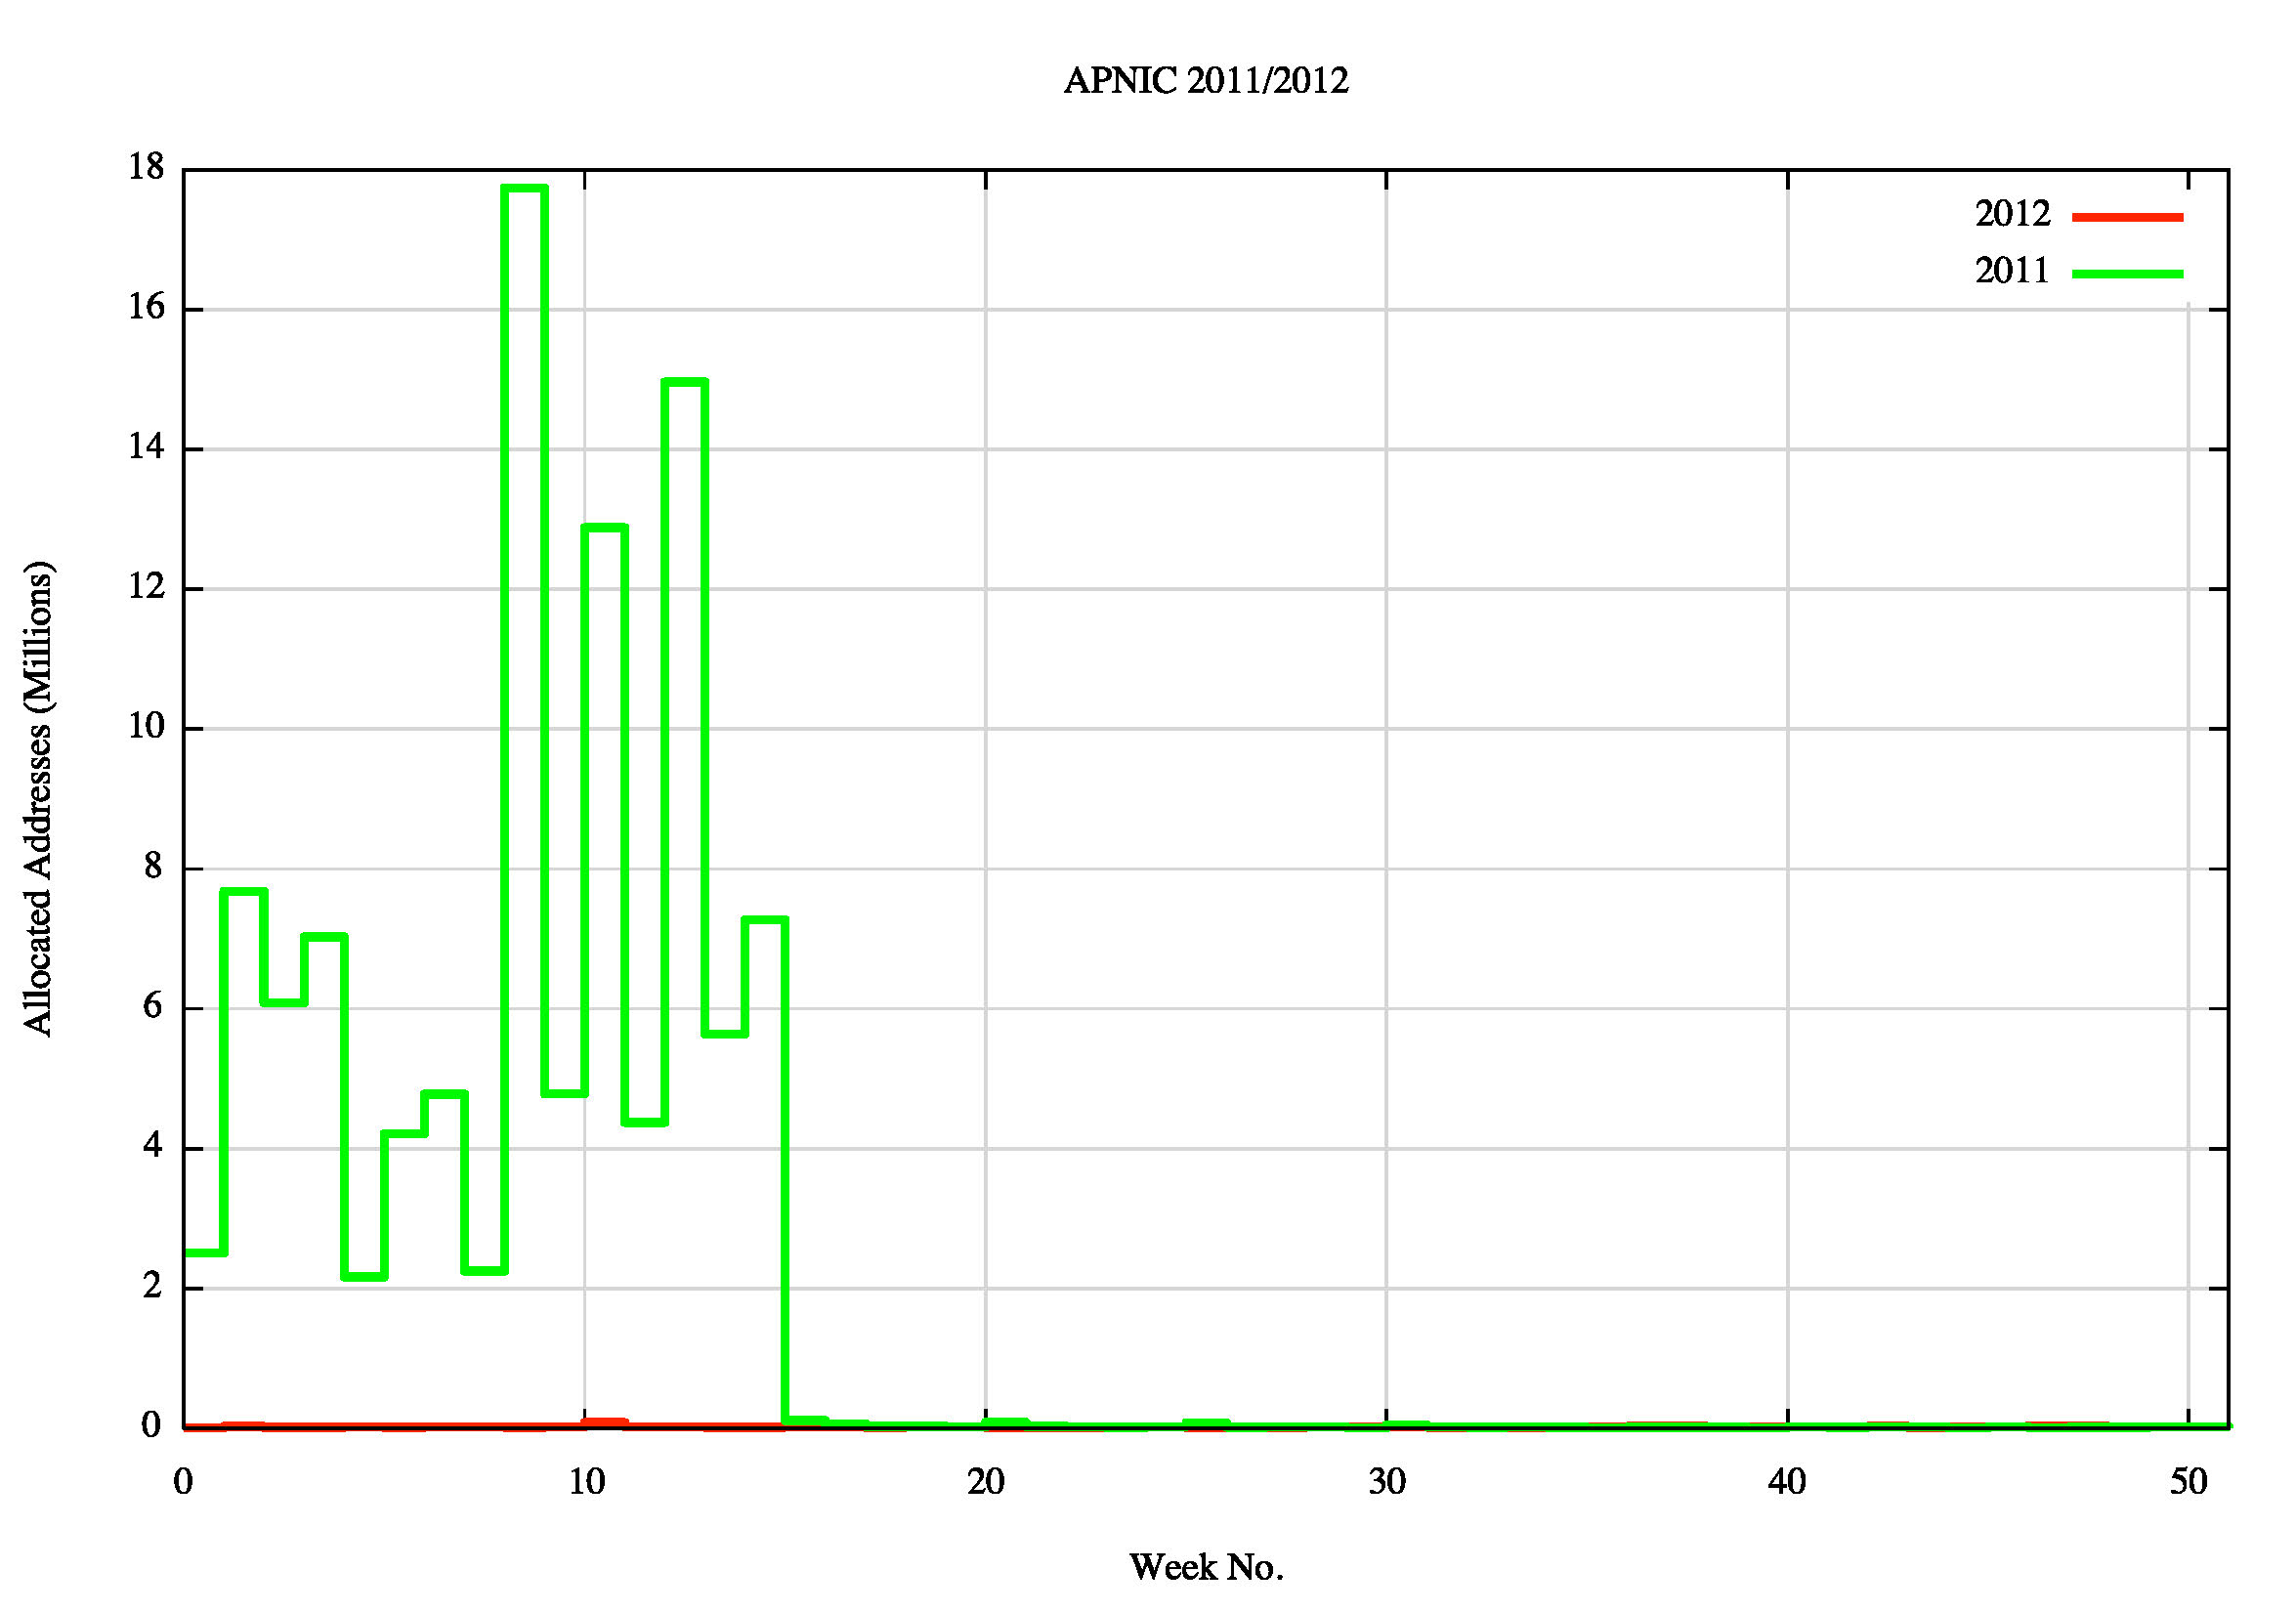
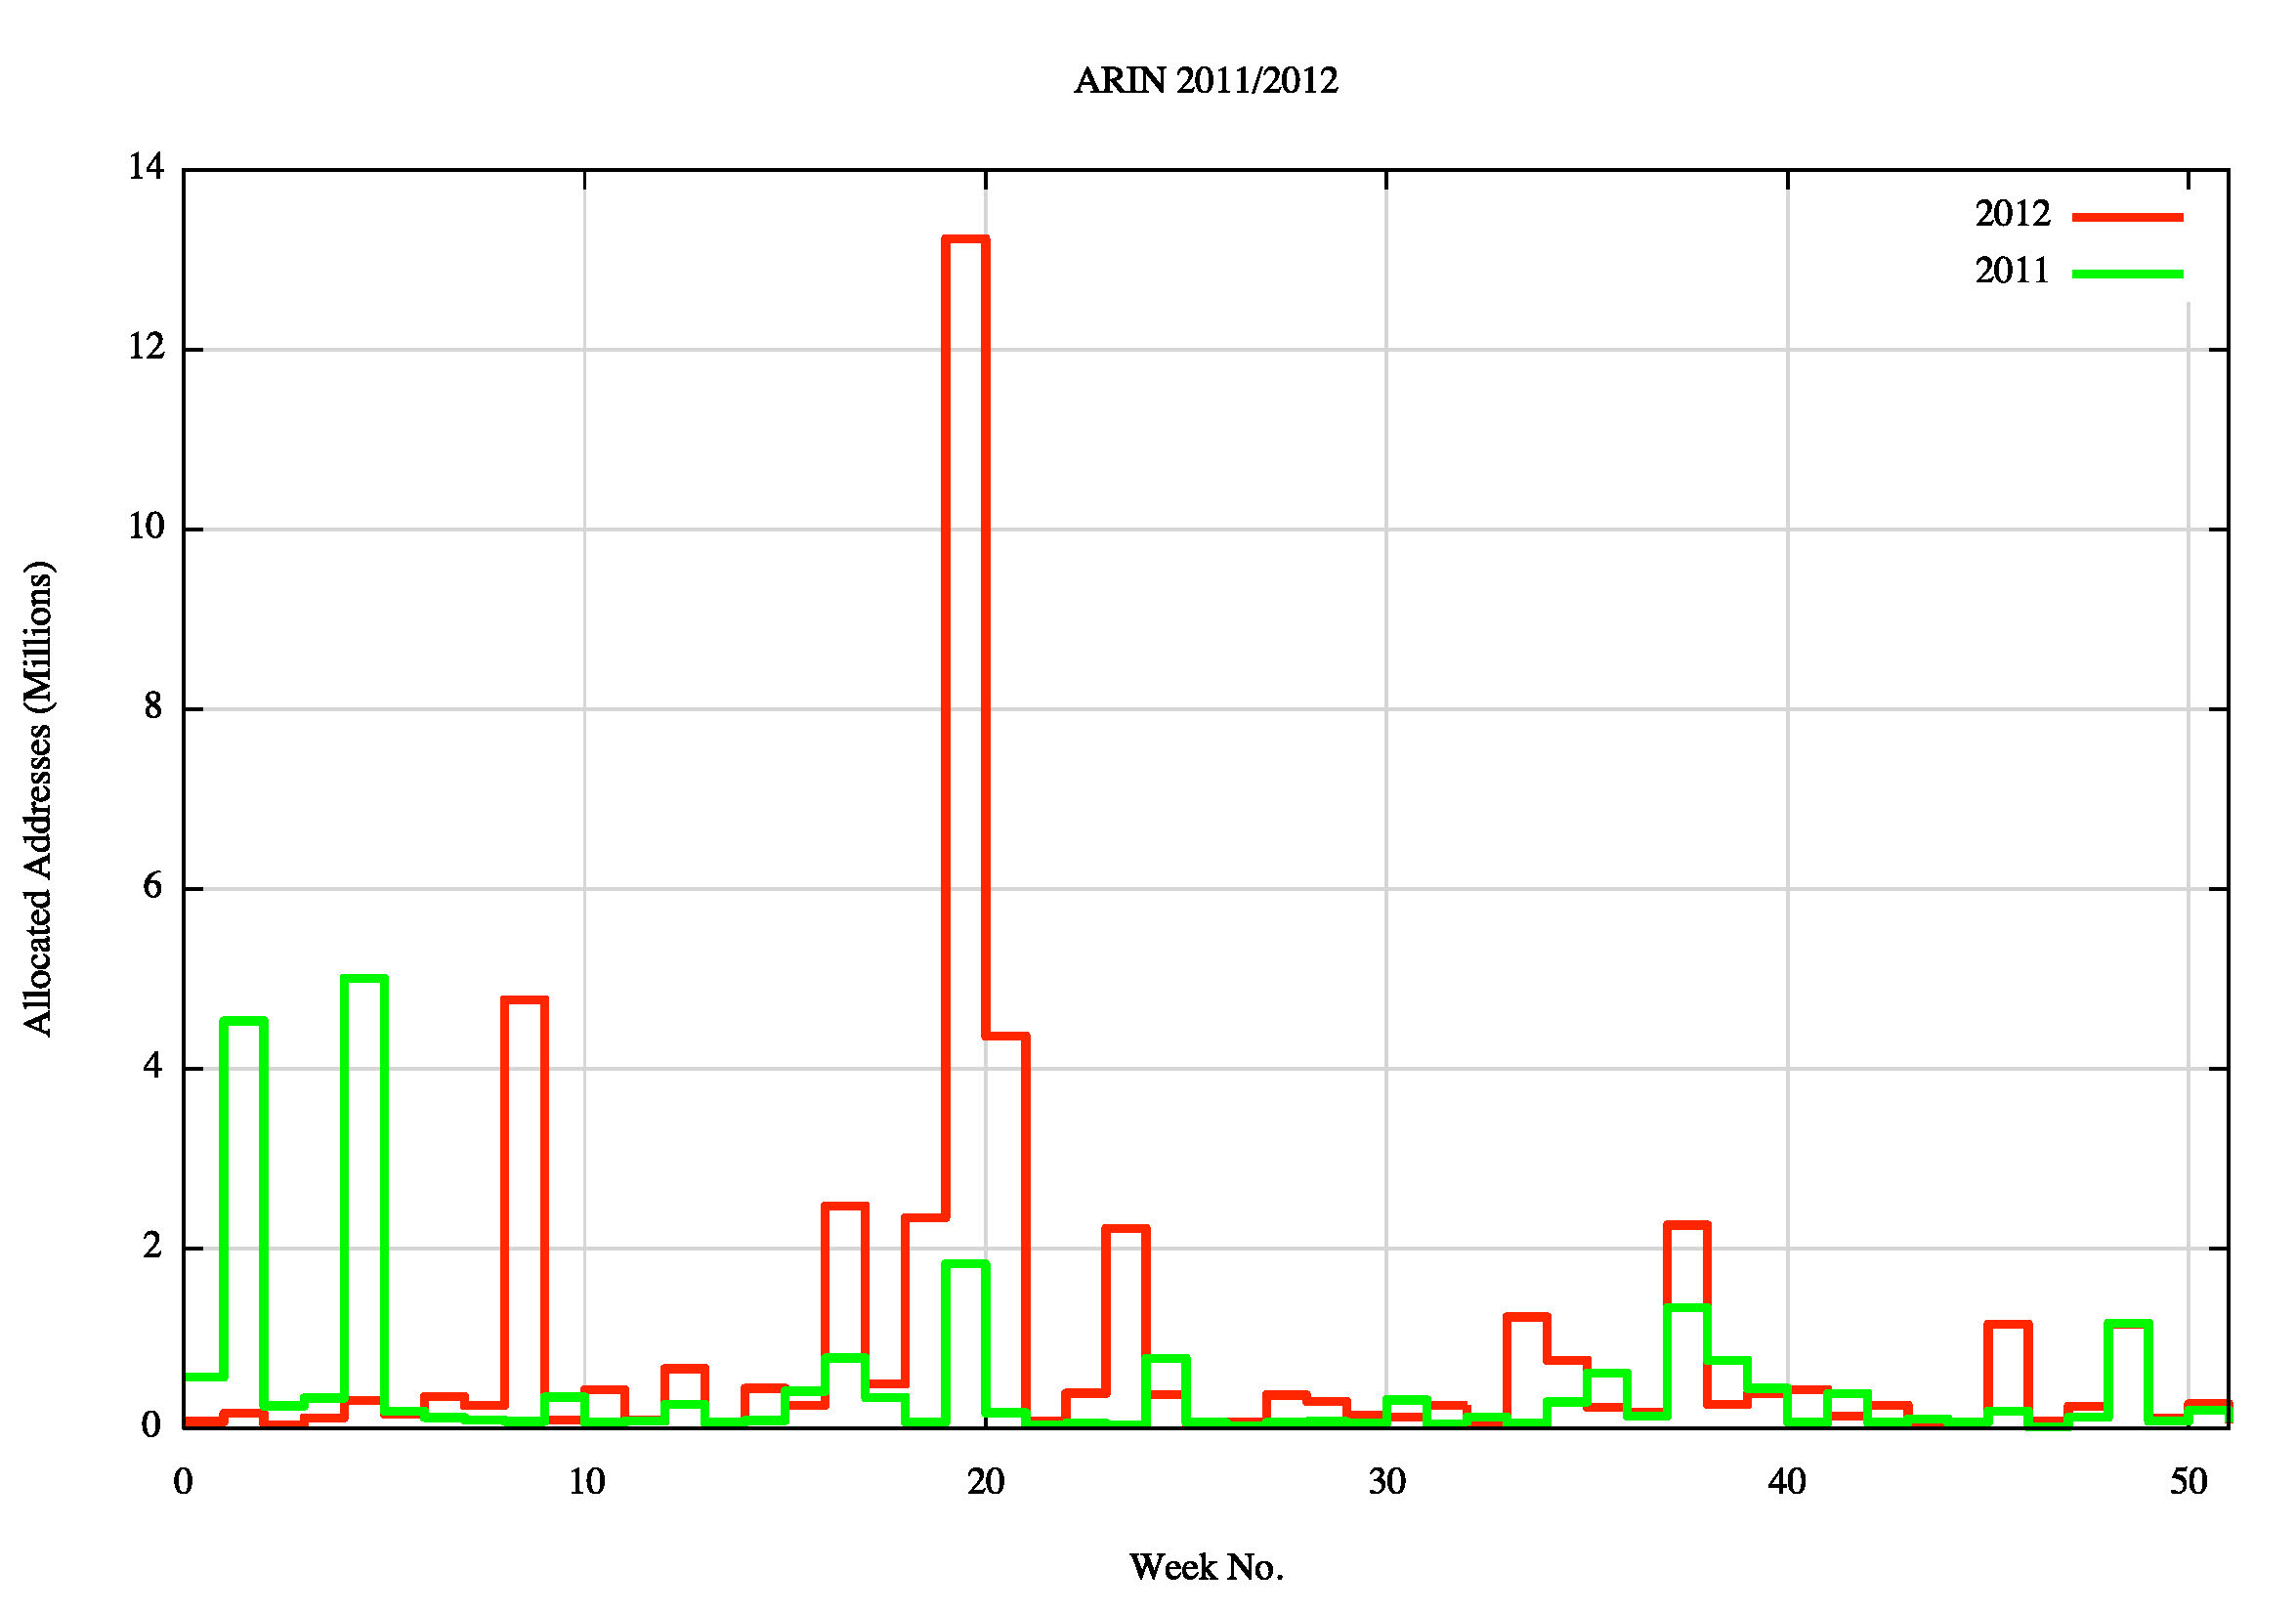
APNIC Allocations ARIN Allocations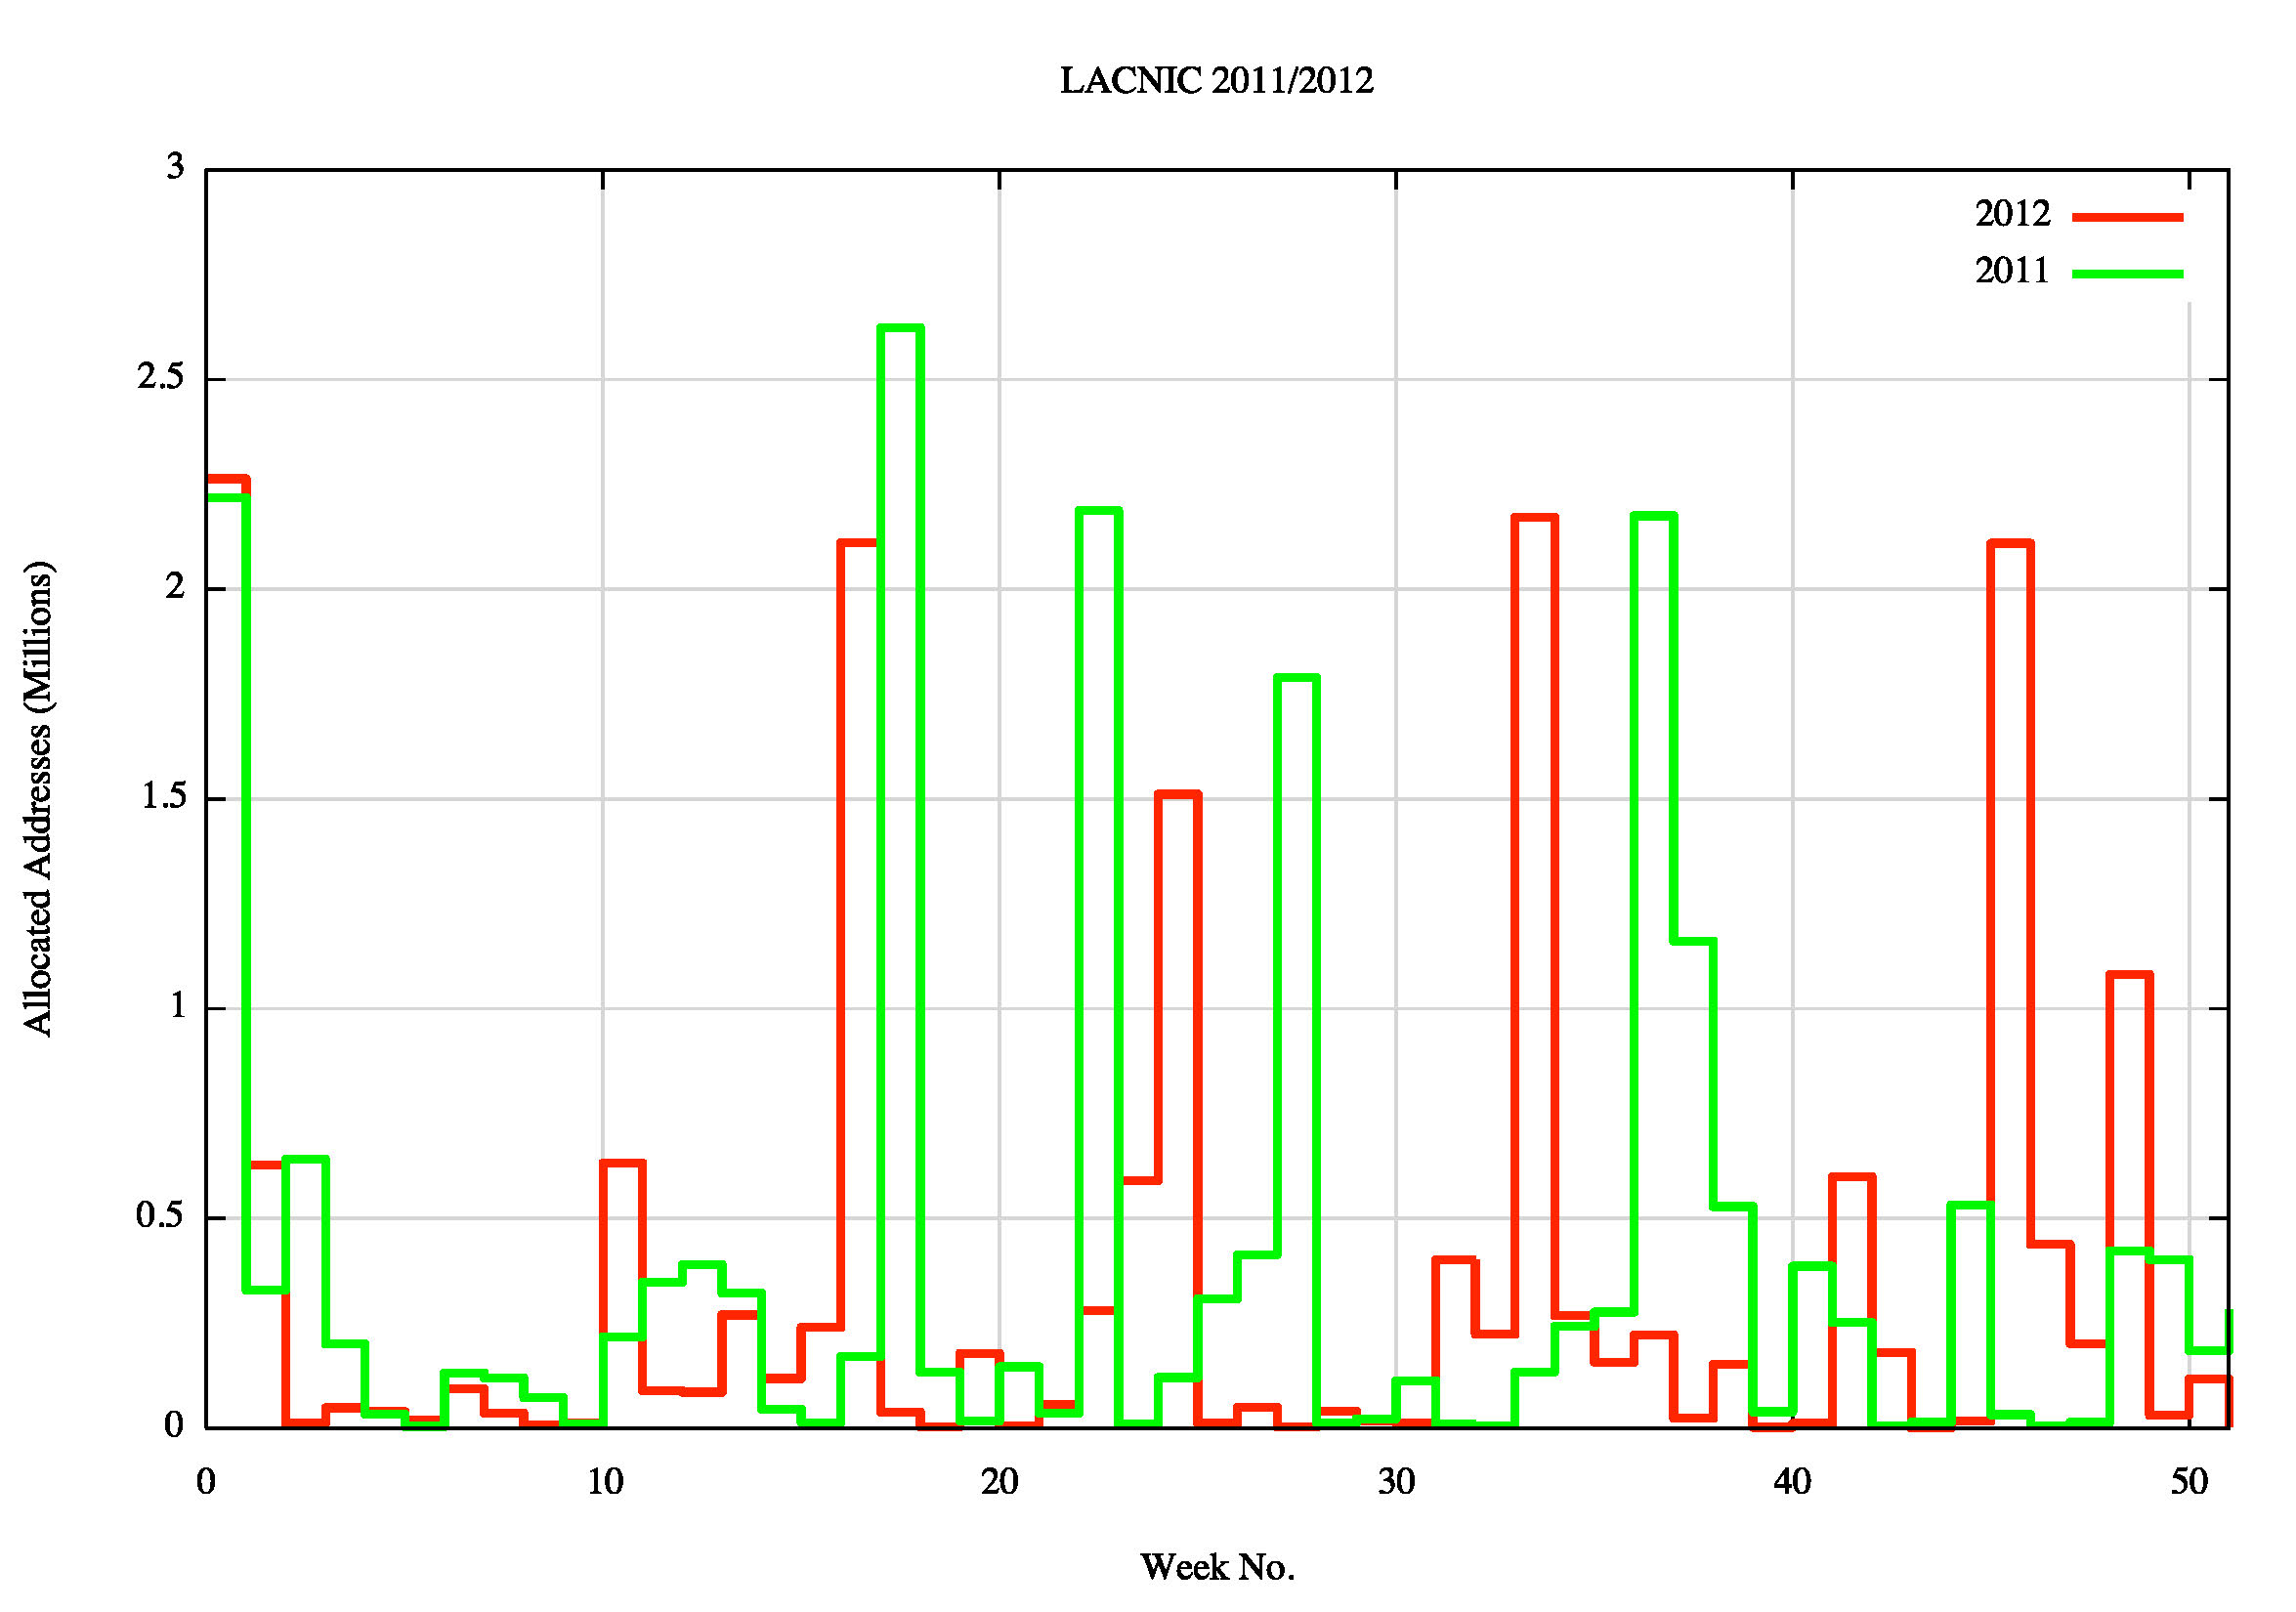
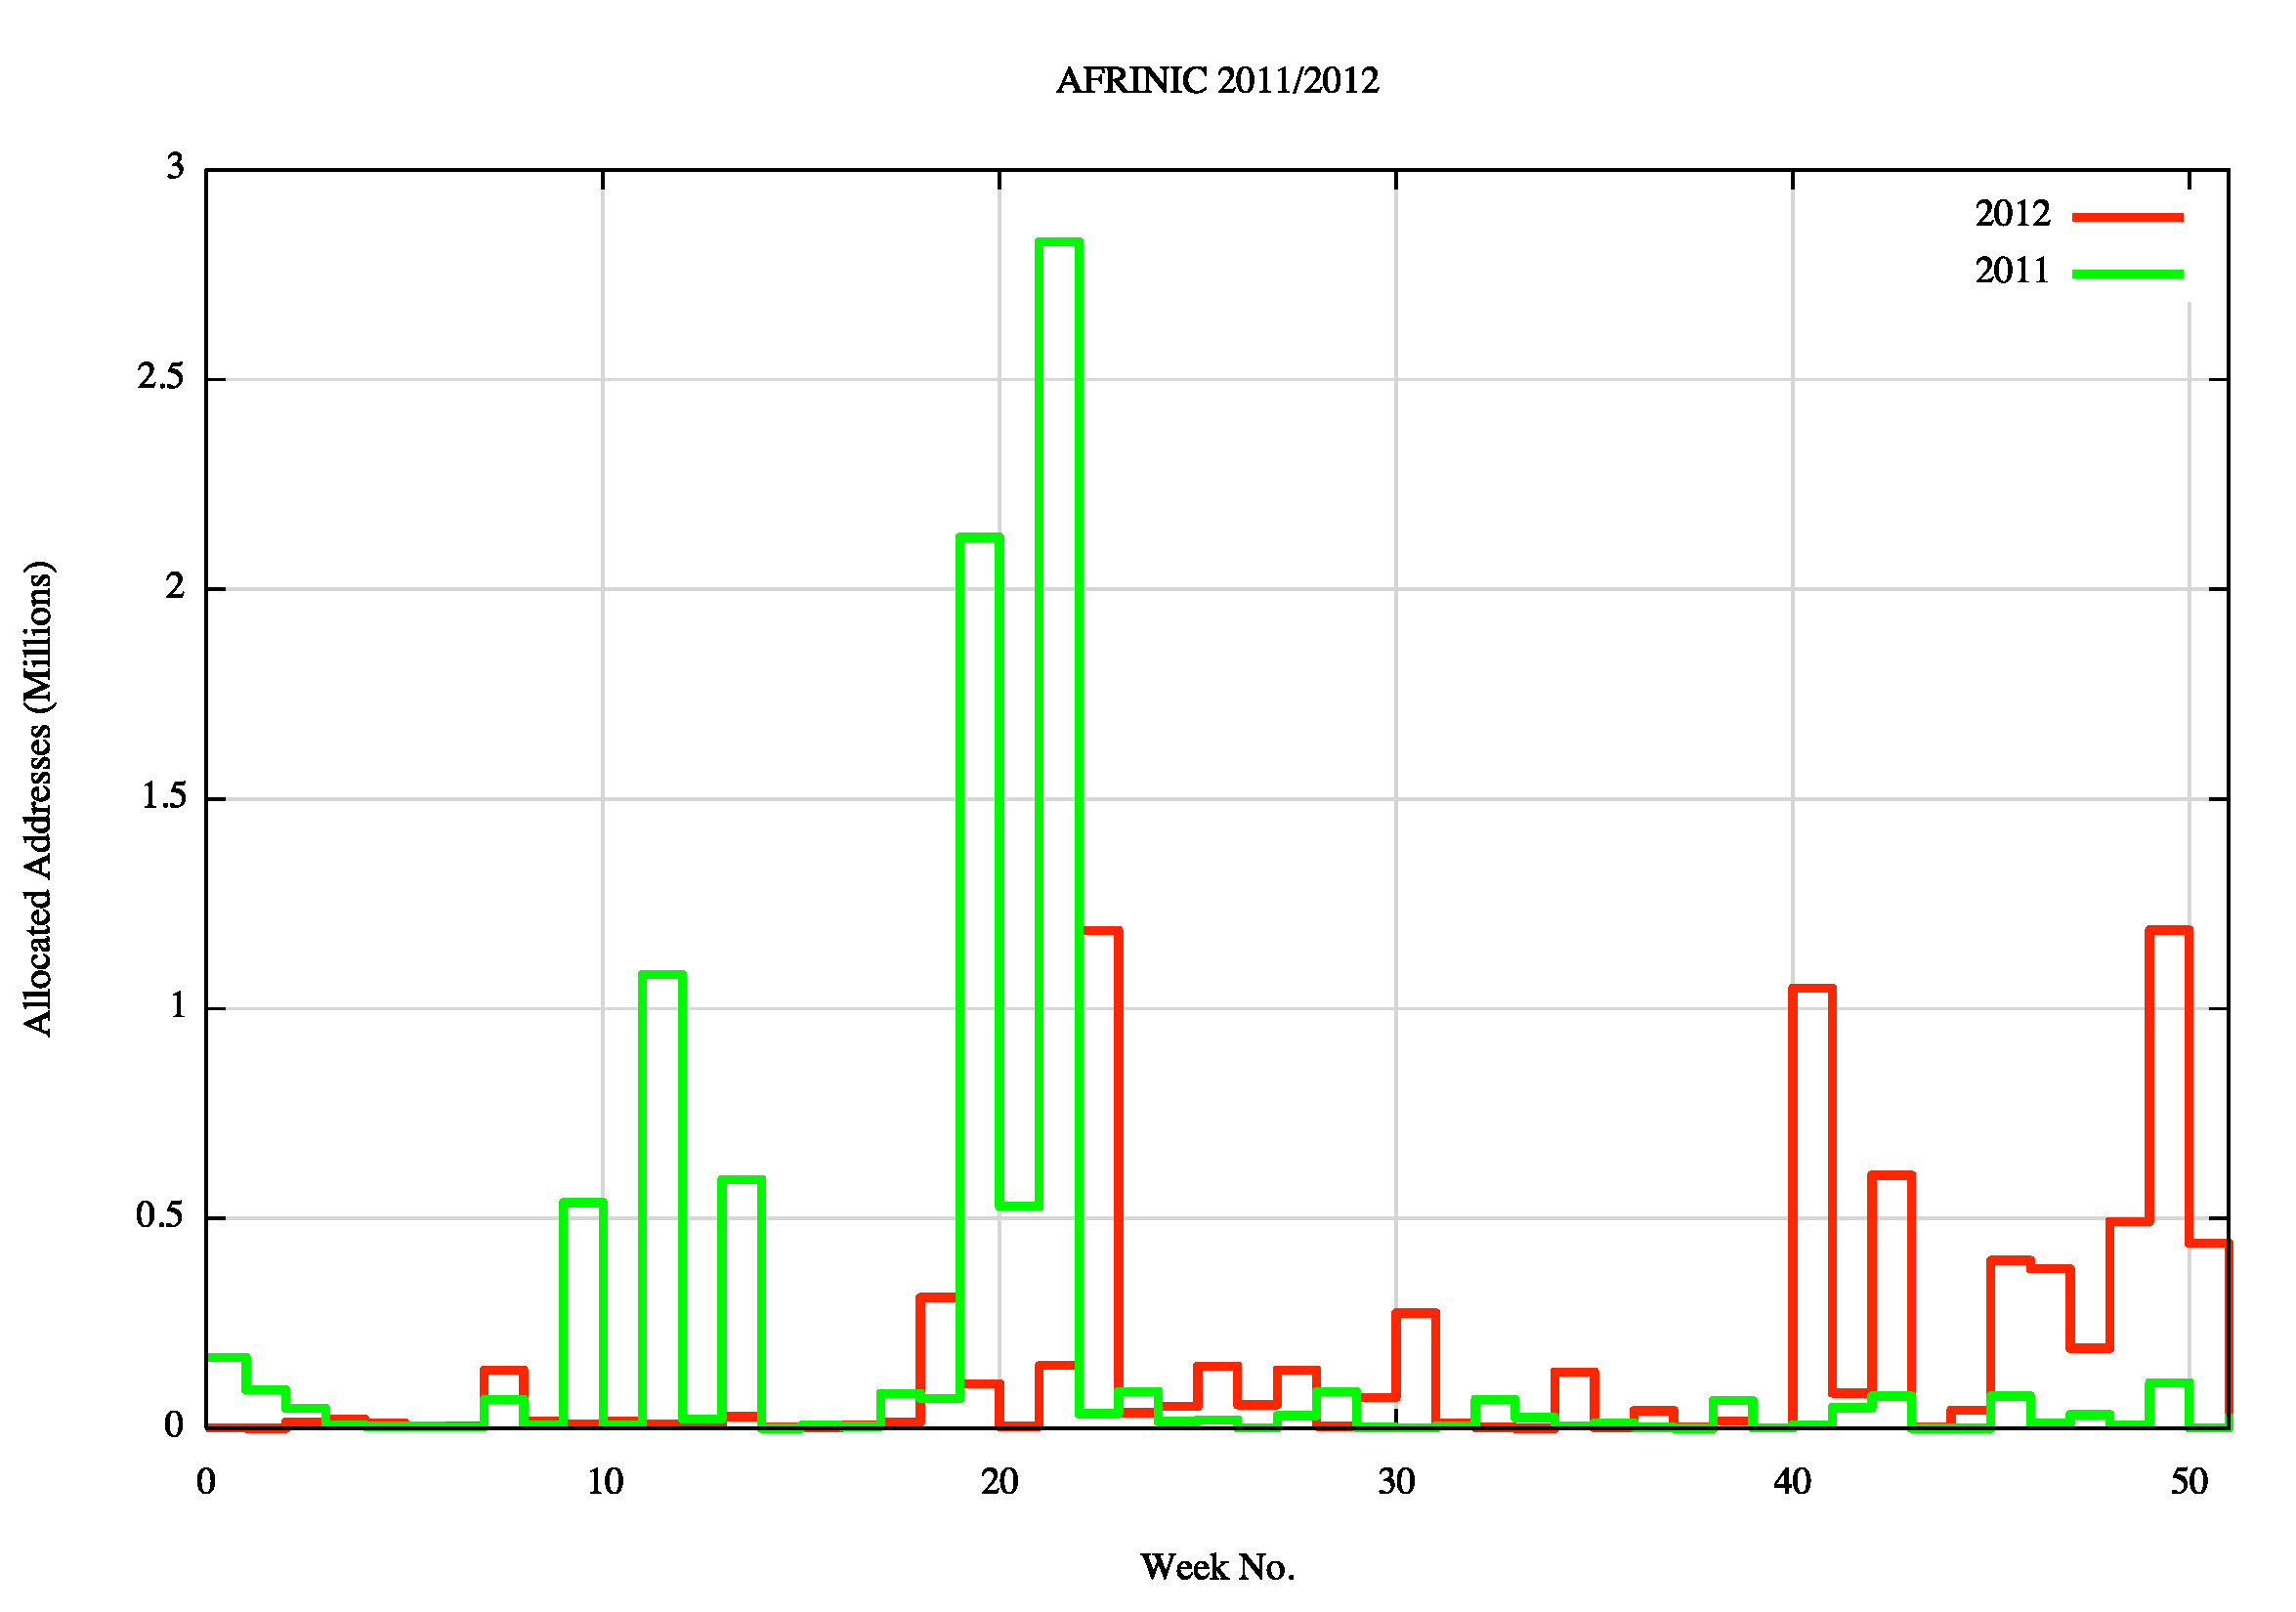
LACNIC Allocations AFRINIC Allocations
Figure 3 Weekly Address Allocation Levels: 2011 - 2012
The major notable allocation events in 2012 are a set of allocations totalling some 13 million addresses in week 20 by ARIN, and a rising average allocation rate at AFRINIC at the end of 2012, rising to an average of 0.5 million addresses per week with 2 weeks with more than 1 million allocated addresses. However, there is no clear signs of a "last minute" rush on the three RIRs that still have available IPv4 addresses to distribute.
Address Distribution
Another way to look at the address distribution is in terms of "skew". If the Internet is populated by a largely homogenous population of service providers then the distribution of address allocations would be relatively uniform, such that the group of largest allocations would not be vastly larger than the group of smallest allocations. On the other hand , if the service provider population is skewed such that there is a small number of very large providers that service the bulk of the user population, then we would expect to see the bulk of addresses being allocated to a small number of providers. One way to look at the level of skew is to use a cumulative distribution plot, comparing the number of allocations to the amount of address space, shown below.
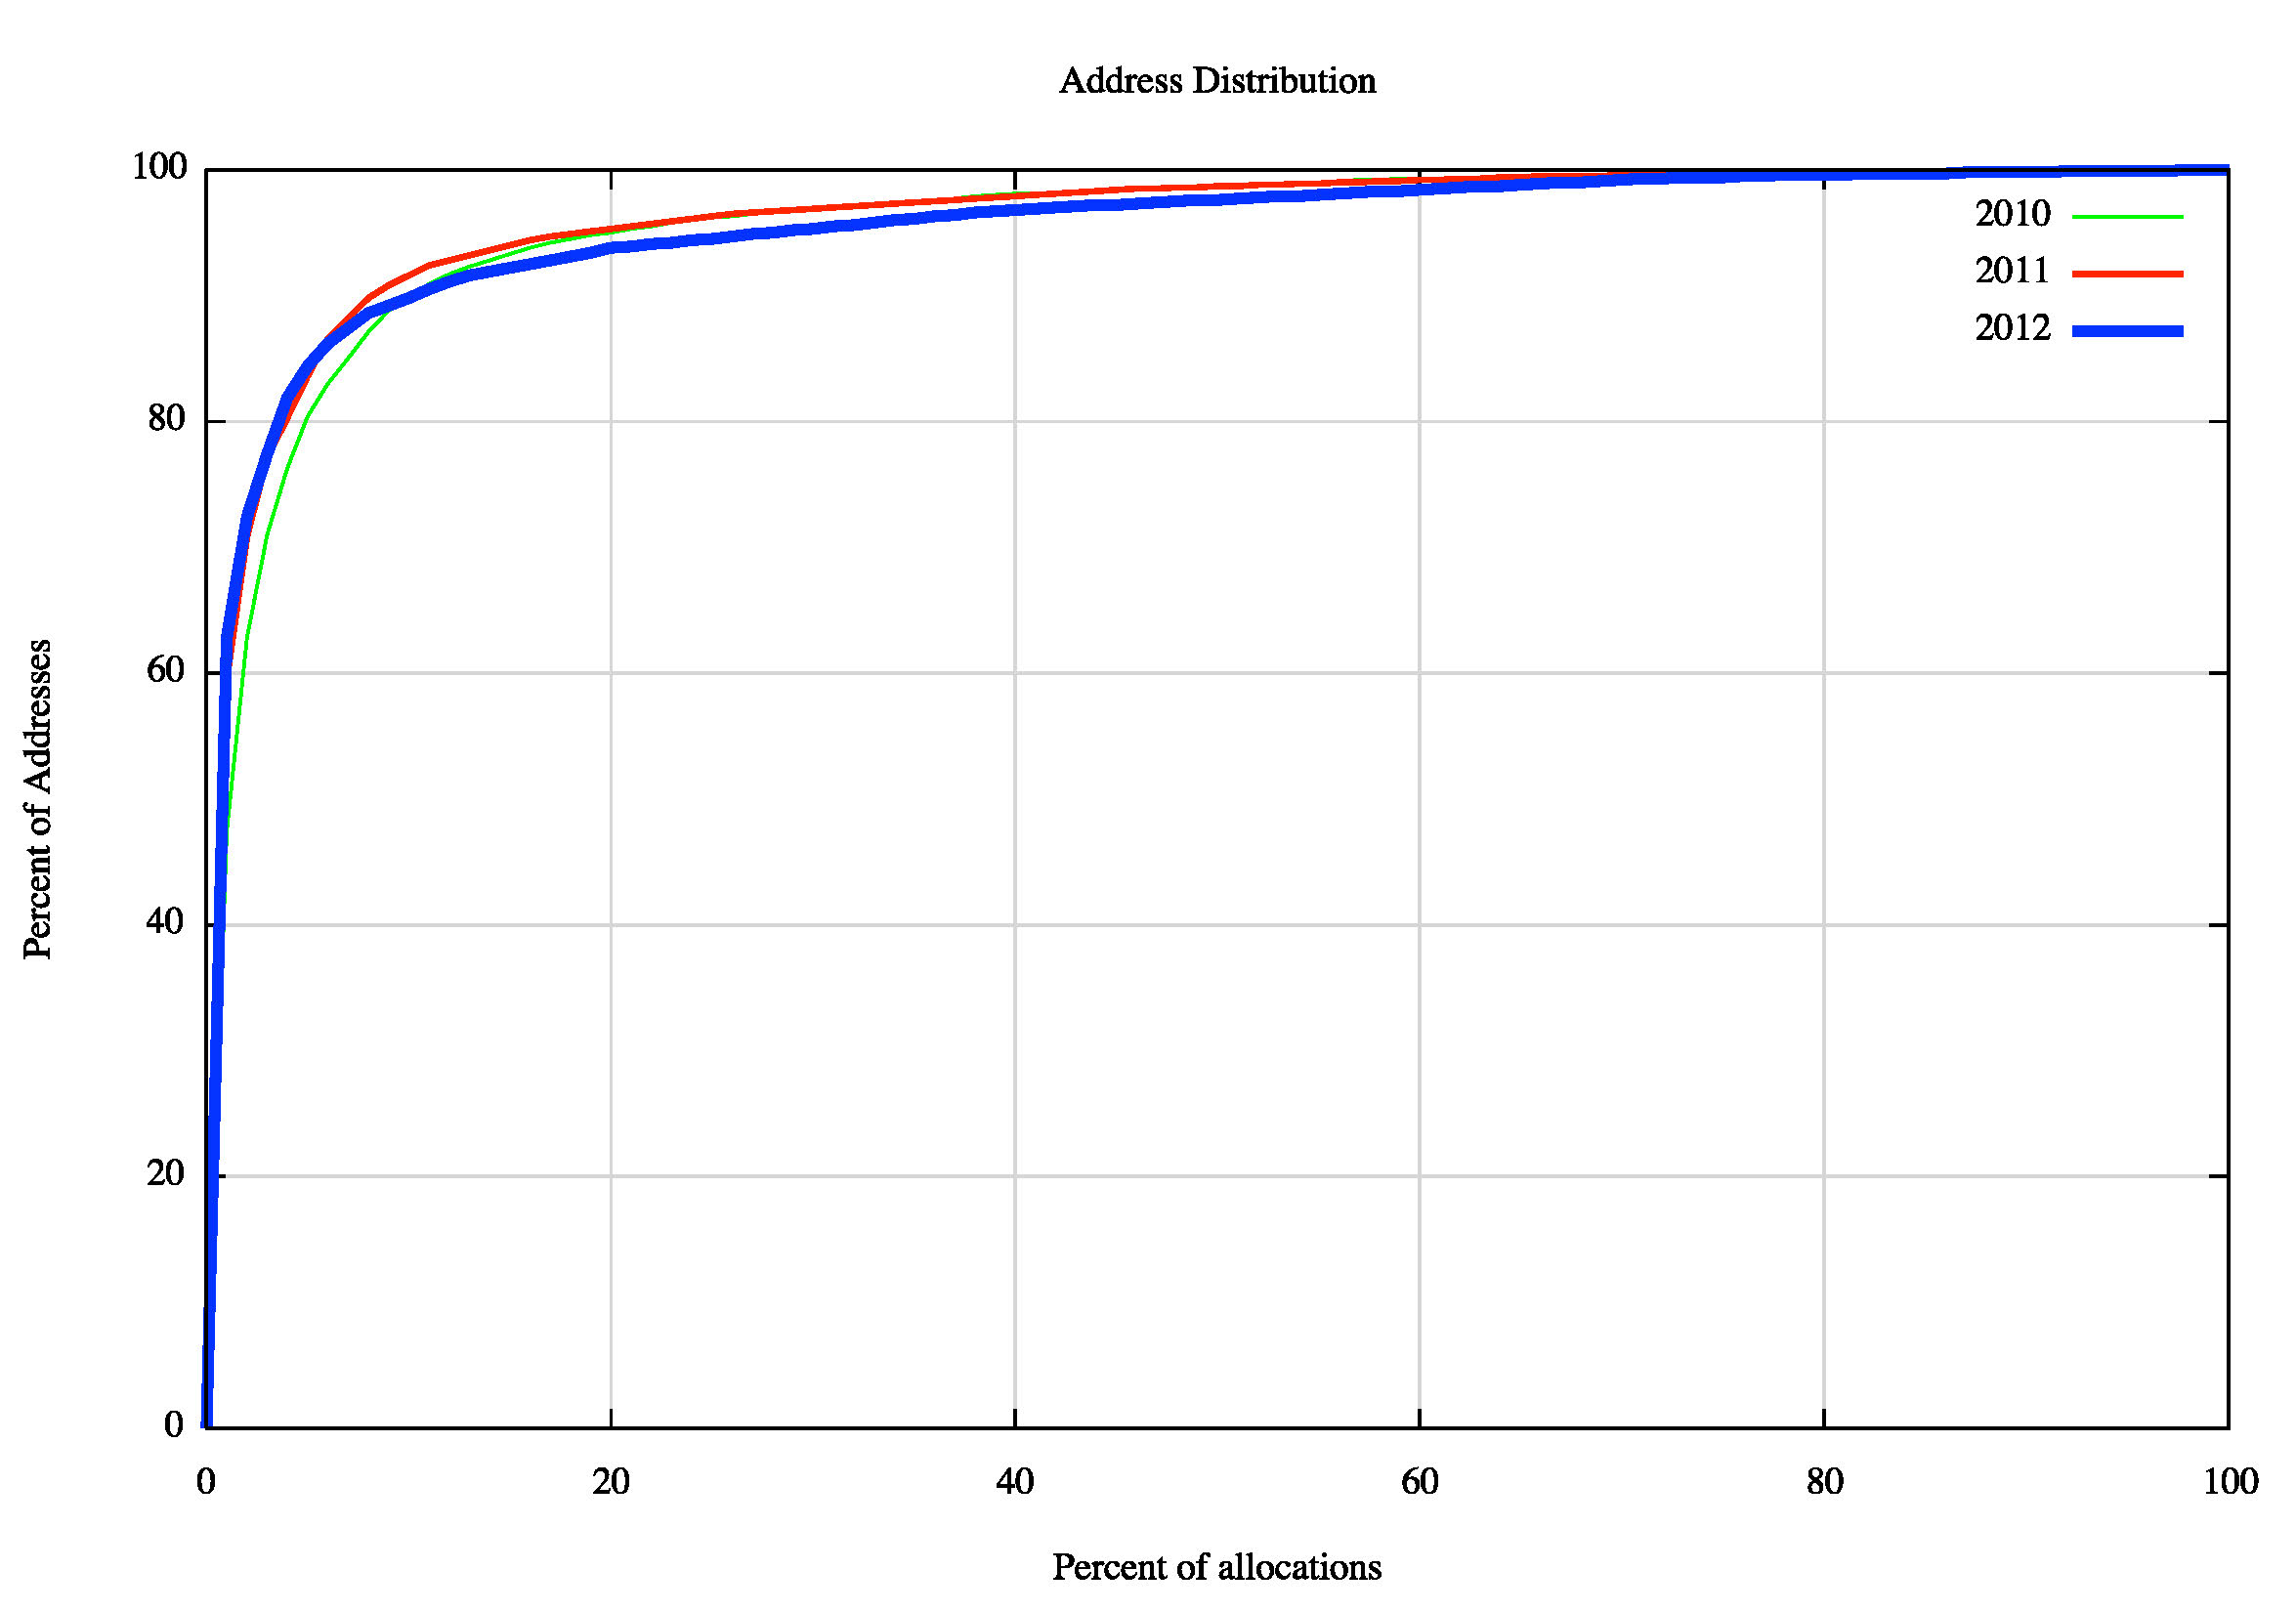
Figure 4 - IPv4 Allocation Distribution CDF 2010-2012
Figure 4 shows the address distribution for 2010 (green), 2011 (red) and 2012 (blue). The shift from 2010 to 2011 showed an increase in the proportion of address space being allocated to the larger providers. The largest 10% of allocations in 2010 received, 89.8% of the total allocated address space, while this rose slightly to 91.6% in 2011. The impact of address exhaustion in APNIC was evident in 2012, as the largest 10% of allocations received 89.8% of all addresses, the same level as 2010.
Who received the largest of these allocations in 2012?
| Rank | Economy | Organization | Addresses (M) |
| 1 | United States | NTT Communications Corporation | 9.7 |
| 2 | Brazil | Comite Gestor da Internet no Brasil (Brazil NIR) | 8.4 |
| 3 | United States | AT&T Internet Services | 3.1 |
| 4 | United States | Rogers Cable | 3.1 |
| 5 | Iran | Iran Cell and Communication | 1.0 |
| 6 | Iran | Gostaresh Ertebatat Mabna | 1.0 |
| 7 | Germany | Telekom Deutschland | 1.0 |
| 8 | France | Free Mobile SAS | 1.0 |
| 9 | United States | Windstream | 1.0 |
| 10 | United States | Amazon | 1.0 |
| 11 | South Africa | MTN Business | 1.0 |
| 12 | South Africa | Vodacom | 1.0 |
| 13 | Argentina | Telecom Argentina | 1.0 |
| 14 | Colombia | Comcel | 1.0 |
| Total | 33.8 |
Table 4 - IPv4 Allocated Addresses - Top 14 allocations for 2012
Of note here is the inclusion of a number of new economies in this list, notably Iran and South Africa.
This "heavy tail" distribution of the largest allocations has not always been the case. In looking at the distribution of IPv4 allocations over the past decade the following table shows the percentage of address space that were allocated to the 1% largest individual allocations and the lower half of the individual allocations.
| IPv4 Allocations | 2001 | 2002 | 2003 | 2004 | 2005 | 2006 | 2007 | 2008 | 2009 | 2010 | 2011 | 2012 |
| Top 1% | 30% | 39% | 38% | 38% | 51% | 45% | 51% | 47% | 50% | 49% | 60% | 63% |
| Lower 50% | 5% | 5% | 4% | 3% | 1% | 2% | 1% | 1% | 1% | 1% | 1% | 2% |
Table 5 - IPv4 Allocated addresses
What appears to have happened across the period 2000 - 2005 was a marked phase of aggregation in this industry, where the economies of scale in a mass market for Internet services started to exercise significant influence over the deployment of services on the Internet. This picture has remained relatively consistent since 2005, and the largest 100 Internet enterprises across the world appear to undertake at least one half of the volume of deployment of new Internet services. To the extent that the Internet on the 1990's was a poster child of a strongly competitive environment and highly diverse supply industry in the communications sector, the 2000's has seen the Internet progress into an environment which is dominated by economies of scale and large scale supplier enterprises. A marketplace that is strongly influenced by a small number of larger enterprises is often not as agile in areas of technical and service innovation, and competitive pressures are not as strong a factor when one or two providers assume a dominant market position.
The distribution of addresses in the IPv4 Internet paints a picture of an industry that has now completed a process of aggregation, and the pressures that will lead to further evolution of the Internet in the coming years will probably be different to those that drove the Internet of some years ago.
IPv4 Address Exhaustion
One further milestone occurred in 2012 on the path to IPv4 address exhaustion, namely the exhaustion of its general use address pool, by the RIPE NCC in September 2012.
The Internet continues to rely very heavily on IPv4, and the consumption of a further 114 million addresses in 2012 leaves 219 million addresses in the pool of unallocated addresses, or a total of some 23 months if we were able to access these addresses at the same rate as we have been to date. However this is not the case.
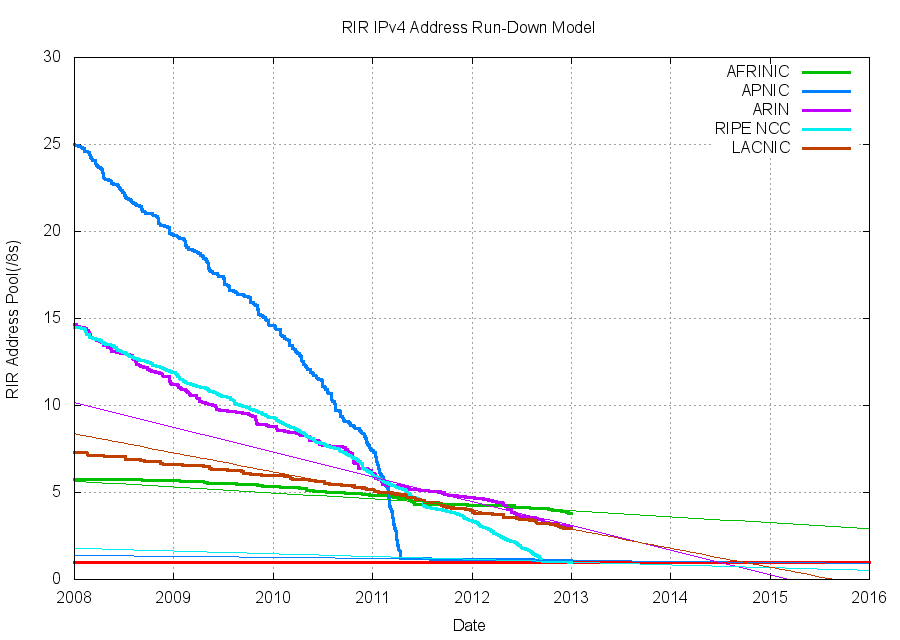
Figure 4 – RIR Address Exhaustion Model
APNIC holds some 15 million addresses, but at this stage has is operating under an allocation policy where each entity can receive a maximum of 1024 addresses. The RIPE NCC holds some 16 million addresses and is managing this pool under a policy that is similar to APNIC's.
At the end of 2012 ARIN holds some 50.4 million addresses. At this point in time the average monthly address consumption rate for ARIN is 1.9 million addresses per month, and if this rate remains steady, then ARIN's pool of addresses will last a further 1 ½ years before ARIN reaches a low threshold of 16,777,216 addresses (or the equivalent of a /8 address block) remaining.
LACNIC holds 48 million addresses at the end of 2012. The average address consumption rate for LACNIC is some 1.5 million addresses per month, which implies the LACNIC will reach its final /8 of address holdings in some 1½ years from now, in September 2014.
AfriNIC holds some 64 million addresses, and have an average address consumption rate of some 0.47 million addresses per month.. At this rate AfriNIC will reach its final /8 in some 9 years from now.
IPv6 in 2012
IPv6 uses a somewhat different address allocation methodology than IPv4, and it is a matter of choice for a service provider as to how large an IPv6 address prefix is assigned to each customer. The original recommendations published by the IAB and IESG in 20012 (RFC3177) envisaged the general use of a /48 as an end site prefix. Subsequent consideration saw a more flexible approach being taken with the choice of the end site prefix size being left to the service provider, and today's IPv6 environment has some providers using a /60 end site allocation unit, some use a /56, and other providers use a /48. This variation makes a comparison of the count of allocated IPv6 addresses somewhat misleading, as an ISP using /48's for end sites will require 256 times more address space to accommodate the same customer base as a provider who uses a /56 end site prefix, and 65,000 times more address space than an ISP using a /60 end site allocation.
So for IPv6 let's use both the number of discrete IPv6 allocations and the total amount of space that was allocated to see how IPv6 fared in 2011.
Comparing 2011 to 2012 the number of individual allocations of IPv6 address space curiously fell slightly, from 3,587 to 3,304. What is perhaps surprising is the absence of a sharp uptake of IPv6 in 2012.
| Allocations | 2005 | 2006 | 2007 | 2008 | 2009 | 2010 | 2011 | 2012 |
| IPv6 | 240 | 234 | 475 | 860 | 1,236 | 2,436 | 3,587 | 3,304 |
| IPv4 | 4,774 | 5,646 | 6,312 | 6,969 | 6,701 | 7,758 | 10,061 | 8,619 |
Table 6 - Number of individual Address Allocations, 2005 - 2012
The amount of IPv6 address space distributed in 2012 is comparable to the volume of 2011. If one was searching for evidence that there is a concerted effort to deploy IPv6 across the entire Internet in the coming months, then these figures would not assist. It seems that the level of interest in IPv6 remains at a level that is somewhere between lackadaisical and slight in the Internet at large.
| Addresses | 2005 | 2006 | 2007 | 2008 | 2009 | 2010 | 2011 | 2012 |
| IPv6 (/32s) | 26,991 | 9,792 | 6,678 | 80,996 | 1,064 | 5,835 | 15,018 | 17,756 |
| IPv4 (/32s)(M) | 174.4 | 168.1 | 203.9 | 203.3 | 189.4 | 248.8 | 201.0 | 114.9 |
Table 7 – Volume of Address Allocations, 2005 - 2012
In terms of the number of individual allocations 2012 was not a big year for IPv6. Indeed in ARIN (North America), APNIC (Asia Pacific) and AFRINIC )Africa) the number of IPv6 address allocations fell in 2012. The numbers for the RIPE CC (Europe and the Middle East) are only slightly higher than the 2011, and it is only in LACNIC (Latin America and the Caribbean) that the number of IPv6 allocations almost doubled in 2012, although this was from a small base to start with.
| Allocations | 2005 | 2006 | 2007 | 2008 | 2009 | 2010 | 2011 | 2012 |
| RIPE NCC | 93 | 89 | 158 | 427 | 622 | 1,042 | 1,647 | 1,756 |
| ARIN | 59 | 69 | 210 | 227 | 378 | 623 | 1,038 | 611 |
| APNIC | 54 | 43 | 63 | 161 | 190 | 666 | 641 | 599 |
| LACNIC | 31 | 16 | 25 | 29 | 33 | 50 | 132 | 253 |
| AFRINIC | 3 | 17 | 19 | 16 | 13 | 55 | 129 | 83 |
| 240 | 234 | 475 | 860 | 1,236 | 2,436 | 3,587 | 3,302 |
Table 8 - IPv6 allocations by RIR
The assignment data tells a slightly different story. Table 9 shows the number of allocated IPv6 /32's per year (Table 9) and dividing addresses by allocations gives the average IPv6 allocation size in each region (Table 10). Of note is the jump in average allocation size in AFRINIC and LACNIC in 2012, and a fall in the average allocation size in APNIC. The overall average allocation size is slightly larger than a /30. The difference here point to some differences in IPv6 allocation policies between the regions, as well as some difference in the IPv6 applicants (large scale core infrastructure vs edge networks) between the regions.
| IPv6 Addresses (/32s) | 2005 | 2006 | 2007 | 2008 | 2009 | 2010 | 2011 | 2012 |
| RIPE NCC | 17,495 | 6,481 | 1,251 | 606 | 602 | 1,867 | 2,425 | 3,729 |
| ARIN | 57 | 52 | 137 | 14,488 | 249 | 579 | 2,280 | 1,675 |
| APNIC | 9,373 | 3,226 | 5,237 | 141 | 174 | 3,239 | 9,506 | 3,807 |
| LACNIC | 53 | 16 | 39 | 65,749 | 30 | 46 | 652 | 4,325 |
| AFRINIC | 3 | 17 | 14 | 12 | 9 | 104 | 155 | 4,203 |
| 26,981 | 9,792 | 6,678 | 80,996 | 1,064 | 5,835 | 15,018 | 17,739 |
Table 9 - IPv6 address allocation volumes by RIR
| Average IPv6 Allocation (/32s) | 2005 | 2006 | 2007 | 2008 | 2009 | 2010 | 2011 | 2012 |
| RIPE NCC | 188.12 | 72.82 | 7.92 | 1.42 | 0.97 | 1.79 | 1.47 | 2.12 |
| ARIN | 0.97 | 0.75 | 0.65 | 63.82 | 0.66 | 0.93 | 2.20 | 2.74 |
| APNIC | 173.57 | 75.02 | 83.13 | 0.88 | 0.92 | 4.86 | 14.83 | 6.36 |
| LACNIC | 1.71 | 1.00 | 1.56 | 2,267.21 | 0.91 | 0.92 | 4.94 | 17.09 |
| AFRINIC | 1.00 | 1.00 | 0.74 | 0.75 | 0.69 | 1.89 | 1.20 | 50.64 |
| 112.42 | 41.85 | 14.06 | 94.18 | 0.86 | 2.40 | 4.19 | 5.37 |
Table 10 – Average IPv6 address allocation size by RIR
| Rank | 2008 | 2009 | 2010 | 2011 | 2012 | |||||
| 1 | United States | 211 | United States | 349 | United States | 556 | United States | 924 | United States | 549 |
| 2 | Germany | 67 | Germany | 86 | Australia | 146 | Australia | 176 | United Kingdom | 199 |
| 3 | United Kingdom | 34 | United Kingdom | 66 | Germany | 124 | Germany | 160 | Germany | 187 |
| 4 | Russia | 33 | Netherlands | 56 | United Kingdom | 106 | United Kingdom | 150 | Russia | 186 |
| 5 | Netherlands | 33 | Australia | 53 | Russia | 102 | Russia | 147 | Netherlands | 124 |
| 6 | Switzerland | 33 | Russia | 46 | Netherlands | 86 | France | 110 | Australia | 113 |
| 7 | Australia | 30 | Japan | 32 | China | 86 | Canada | 107 | France | 111 |
| 8 | Japan | 28 | France | 29 | Indonesia | 72 | Netherlands | 107 | Sweden | 90 |
| 9 | Italy | 22 | Czech Rep. | 29 | Japan | 62 | Sweden | 96 | Argentina | 78 |
| 10 | Vietnam | 22 | Sweden | 27 | France | 60 | Czech Rep. | 88 | Poland | 77 |
Table 11 - IPv6 allocations by Economy
Table 12 shows the amount of IPv6 address space assigned on a per economy basis for the past 5 years (using units of /32s). In 2012 the major allocations were /20 address blocks to entities in Argentina and Egypt. The address space allocated to the United States was down on 2011 levels, as was the IPv6 address allocations to China.
| Rank | 2008 | 2009 | 2010 | 2011 | 2012 | |||||
| 1 | Brazil | 65,728 | United States | 225 | Japan | 2,518 | China | 8,997 | Argentina | 4,178 |
| 2 | United States | 14,478 | Germany | 143 | Germany | 600 | United States | 2,205 | Egypt | 4,098 |
| 3 | Sweden | 143 | United Kingdom | 61 | United States | 523 | Spain | 641 | China | 3,136 |
| 4 | France | 82 | Australia | 45 | China | 339 | United Kingdom | 384 | United States | 1,346 |
| 5 | Germany | 66 | Netherlands | 44 | Belgium | 270 | Venezuela | 262 | Italy | 635 |
| 6 | United Kingdom | 34 | Russia | 43 | France | 181 | Mexico | 261 | Russia | 414 |
| 7 | Switzerland | 33 | Japan | 33 | Australia | 100 | Netherlands | 229 | Germany | 380 |
| 8 | Russia | 33 | France | 24 | Sweden | 94 | Germany | 187 | United Kingdom | 353 |
| 9 | Netherlands | 32 | Czech Rep. | 21 | Russia | 94 | Russia | 146 | Canada | 325 |
| 10 | China | 26 | Sweden | 21 | United Kingdom | 94 | Australia | 124 | Japan | 283 |
Table 12 - IPv6 Address Allocation Volumes by Economy
The major IPv6 allocations in 2012 by end entity are shown in Table 13.
| Rank | Country | Organisation | Address Count (/32s) |
| 1 | Argentina | Cablevision | 4,096 |
| 2 | Egypt | Link Egypt | 4,096 |
| 3 | China | China Unicom | 3,072 |
| 4 | Italy | Wind Telecomunicazioni SPA | 512 |
| 5 | Japan | Softbank | 256 |
| 6 | United States | Cable One | 256 |
| 7 | United States | U.S. Department of Agriculture | 256 |
| 8 | United States | Start Communications | 256 |
| 9 | United States | Charter Communications | 256 |
| 10 | United States | U.S. Department of Veterans Affairs | 256 |
| 11 | India | Indian Ministry of Communication & IT | 64 |
| 12 | Switzerland | UPC Cablecom GmbH | 32 |
Table 13 – Largest IPv6 Address Allocations in 2012 by Organisation
Notable here are two large allocations of a /20 prefix to ISPs in Argentina and Egypt, and three assignments to public agencies (2 in the US and 1 on India)
The Outlook for the Internet
The past five years has shown that the Internet is now an integral part of the portfolio of conventional business activity across the world, and the deployment of internet services and the opening up of markets through deployment of Internet services is subject to the same economic opportunities and constraints as any other business activity. Those economies that were adversely impacted by the global financial situation saw a drop in the expansion of new Internet services and a drop in their demands for IP address allocations across 2009-2012, while other economies that managed to avoid the worst impacts of a financial recession continued to see growth in new Internet markets across the year.
The past three years has been dominated by the mass marketing of mobile internet services, and the growth rates for 2012 perhaps might have been the highest so far recorded were it not for the exhaustion of the IPv4 address pools in the Asia Pacific region and Europe and the Middle East. In address terms this growth is being masked by the use of Carrier Grade NATs in the mobile service provider environment, so that the resultant demands for public addresses in IPv4 are quite low. In theory there is no such requirement for IPv6 to use NATS, and if the mobile world were deploying dual stack ubiquitously then this would be evident in the IPv6 address allocation data. Unfortunately no such deployment was visible in the address statistics for 2012. This points to a mobile Internet that is almost completely reliant on NATs, and this, in turn, points to some longer term elements of concern for the continued ability of the Internet to support further innovation and diversification in its portfolio of applications and services.
We are witnessing an industry that is no longer using technical innovation, openness and diversification as its primary means of propulsion. The widespread use of NATs limit the technical substrate of the Internet to a very restricted model of simple client/server interactions using TCP and UDP. The use of NATs force the interactions into client-initiated transactions, and the model of an open network with considerable flexibility in the way in which communications took place is no longer being sustained. Today's internet is serviced by a far smaller number of very large players, each of whom appear to be assuming a very strong position within their respective markets. The drivers for such larger players tend towards risk aversion, conservatism and increased levels of control across their scope of operation. The same trends of market aggregation are now appearing in content provision, where a small number of content providers are exerting a dominant position across the entire Internet.
This changing makeup of the Internet industry has quite profound implications in terms of network neutrality, the separation of functions of carriage and service provision, investment profiles and expectations of risk and returns on infrastructure investments, and on the openness of the Internet itself.
![]()
Disclaimer
The views expressed are the author’s and not those of APNIC, unless APNIC is specifically identified as the author of the communication. APNIC will not be legally responsible in contract, tort or otherwise for any statement made in this publication.
![]()
About the Author
GEOFF HUSTON B.Sc., M.Sc., has been closely involved with the development of the Internet for many years, particularly within Australia, where he was responsible for the initial build of the Internet within the Australian academic and research sector. He is author of a number of Internet-related books, and has been active in the Internet Engineering Task Force for many years.