|
The ISP Column
A column on things Internet
|
|
|
Other Formats:
|
|
|
|
|
Addressing 2011 – One Down, Four to Go!
January 2012
Geoff Huston
It's January again, and being the start of another year, it's as good a time as any to look at the last 12 months and see what the Internet was up to in 2011. This is an update to the reports prepared at the same time in previous years, so lets see what has changed in the past 12 months in addressing the Internet, and look at how IP address allocation information can inform us of the changing nature of the network itself.
A little over a decade ago, at the height of the first Internet boom, the confident prediction was made that the annual doubling of the size of the Internet would be a constant, akin in some ways to the underlying optimism in technology that sits behind Moore's Law. That particular Internet bubble burst a decade ago, and the wildly optimistic predictions of the continued growth of the Internet were tempered somewhat. There was, however, the continuation of an underlying view that the Internet would just continue to grow and just when we thought that the world of humans represented a market space that would reach saturation sometime soon there was the "internet of Things" to keep us going for many decades to come. So, once again, by the late 2000's the Internet was portrayed as a form of economic miracle that would defy conventional cycles of business activity.
The global financial crash of late 2007 and its continuing repercussions have had a negative effect on the wildly optimistic assumptions of future growth. However, at least from the Internet's perspective this was not a major crash, and could at best be termed a "mild correction". The effects of this economic downturn have been short-lived in the Internet, and 2010 saw the network expand at the highest rate seen so far. The market in mobile devices, fuelled in no small part by Apple's iPhone product, and the various competitive offerings that make use of the Google's Android platform have created an invigorated market in mobile Internet services that continued to drive growth across much of the world. In addition, the inexorable process of development in China in particular has now reached into the area of consumer electronics and communications services, and the process of deploying broad-based Internet connectivity into a country with a population of 1.3 billion has itself represented a large element of Internet growth.
But 2011 saw a new shadow appear over the Internet, namely that of the exhaustion of the pool of unallocated IPv4 addresses. The central registry, the Internet Assigned Numbers Authority (IANA) handed out the last of its store of available IPv4 address blocks in February 2011, and in April the first of the Regional internet Registries (RIRs), APNIC, reached a threshold of one remaining block of 16.7 million addresses and ceased performing general use IPv4 address allocations.
So lets see how the Internet fared in 2011.
Growth of the Internet
In terms of address space as a metric, pace of growth of the Internet slowed down substantially in 2011. The allocation of 201 million addresses in 2011 on top of a base of 3,193 million addresses that were already allocated at the start of the year represents a growth rate of 6.3%. This is the lowest relative growth rate we've seen.
I suspect this is due to a combination of two factors: namely the exhaustion of IPv4 address space in the fastest growing sector of the market in the regional market of Asia, and the long-standing economic malaise that has impacted much of the European and North American markets over 2011. The relationship between address allocations and overall economic activity is a direct one, as the deployment of new services into the consumer market calls for an associated investment in infrastructure and related services,. The constraints on capital borrowings over the past couple of years, and over 2011 in particular has impacted the rate of expansion of the Internet in 2011.
| 2005 | 2006 | 2007 | 2008 | 2009 | 2010 | 2011 | |
| Allocated IPv4 Addresses (Millions) | 174.4 | 168.1 | 203.9 | 203.3 | 189.4 | 248.8 | 201.0 |
| Relative Annual Growth | 8.0% | 7.7% | 8.8% | 8.0% | 6.9% | 8.4% | 6.3% |
Table 1 - IPv4 Allocated Addresses by Year
During 2011 the total number of IPv4 addresses allocated from the RIRs, supporting the growth of the Internet, was 16% lower than 2010. However before leaping to conclusions relating to a dramatic decline in investment in new network infrastructure, its useful to break this number down on a per-RIR basis, to understand the impact of address exhaustion in APNIC relative to the other regions.
Which economies received these addresses? At a regional level its possible to compare the allocations made by each RIR.
| IPv4 Allocations | 2005 | 2006 | 2007 | 2008 | 2009 | 2010 | 2011 |
| APNIC | 31% | 31% | 34% | 44% | 46% | 48% | 53% |
| RIPE NCC | 35% | 33% | 31% | 22% | 23% | 22% | 22% |
| ARIN | 27% | 28% | 26% | 28% | 22% | 18% | 11% |
| LACNIC | 6% | 7% | 7% | 6% | 6% | 6% | 10% |
| AFRINIC | 1% | 2% | 3% | 1% | 3% | 3% | 5% |
Table 2 - IPv4 Allocated addresses - Distribution by RIR
In 2011 APNIC allocated 105 million addresses, down 12% from the 120 million that were allocation in 2010. However the bulk of these addresses were allocated in the first four months of 2011, with a peak allocation rate of 41 million addresses in March 2011. Once APNIC reached its "final /8" of addresses each allocation is limited to at most 1024 addresses, and the monthly allocation rate for the remainder of 2011 was between 60,000 to 130,000 addresses per month. It seems evident that in the Asia Pacific region the spectre of imminent unavailability trigged a last minute panic in the local industry and an entire year of conventional address allocations was compressed into the first three and a half months of the year.
But what of the other regions? Here was a mixed story, which is reflective of the broader relative economic conditions in the various regions of the world in 2011. In Europe we saw a protracted series of financial crises as a number of national economics faced problems in their ability to service their burgeoning national debt, and capital markets were placed under significant pressure as a result. The RIPE NCC allocated some 56.3 million addresses in 2010, and this fell to 43.3 million address in 2011, down by 23%. These adverse economic conditions were also felt in the United States, which saw unemployment levels head upwards and consumer spending fall, and there the fall in address allocations was more dramatic, declining from 45 million addresses in 2010 to 22.4 million addresses in 2011, or a relative fall of some 50%.
There was also a change in allocation practices in both of these regions, where addresses were allocated on the basis of a 3 month demonstrated need, as distinct from a 12 month need in pervious years. In theory this should not alter the overall consumption rates, as the result would be that an entity experiencing continuous growth in demand would return to the RIR 4 times in the year for its annual address allocation. However it is hard to assess the impact of this change in address allocation policy on overall address consumption levels because of the additional economic factors which have also influenced address consumption levels during the year.
Afrinic saw address allocations rise by 8%, from 8.5 million addresses in 2010 to a total of 9.2 million addresses in 2011. More startling is LACNIC, which serves Latin America and the Carribean which saw a jump from 12.9 million addresses allocated in 2010 to 20.3 million addresses in 2011, a rise of some 57%.
Which economies are leading this continued growth in IPv4 services?
| IPv4 Addresses (/32s, Millions) | ||||||||||
| Rank | 2007 | 2008 | 2009 | 2010 | 2011 | |||||
| 1 | USA | 48.47 | USA | 53.79 | China | 50.67 | China | 45.2 | China | 53.07 |
| 2 | China | 37.29 | China | 46.49 | USA | 38.55 | USA | 42.32 | USA | 21.21 |
| 3 | France | 13.38 | Japan | 10.06 | Japan | 11.04 | Rep.Korea | 25.73 | Japan | 16.91 |
| 4 | Germany | 11.22 | Rep.Korea | 7.96 | Rep.Korea | 10.95 | Japan | 10.02 | Rep.Korea | 7.68 |
| 5 | Rep.Korea | 7.73 | Germany | 7.29 | Russia | 5.46 | Australia | 9.63 | Indonesia | 7.09 |
| 6 | Japan | 7.14 | Brazil | 6.29 | Brazil | 4.19 | India | 9.43 | Brazil | 6.29 |
| 7 | UK | 6.41 | Russia | 6.12 | UK | 4.19 | UK | 8.13 | India | 6.01 |
| 8 | India | 5.61 | Italy | 5.85 | Italy | 4.16 | Germany | 6.97 | France | 5.39 |
| 9 | Mexico | 5.24 | India | 4.23 | France | 3.85 | Russia | 6.46 | Russia | 5.02 |
| 10 | Italy | 5.09 | Taiwan | 4.18 | Germany | 3.6 | Brazil | 6.29 | Germany | 4.92 |
Table 3 - IPv4 Allocated addresses - Top 10 Economies 2007 - 2011
Within the Asia Pacific region China received 53.1 million IPv4 addresses in 2011, which represents 26% of the total IPv4 address allocations performed over the past 12 months. This appears to point to the strong pace of internet expansion in both broadband and wireless services within China, despite the structures of address exhaustion for the latter nine months of the year.
Panic? Was there a Panic?
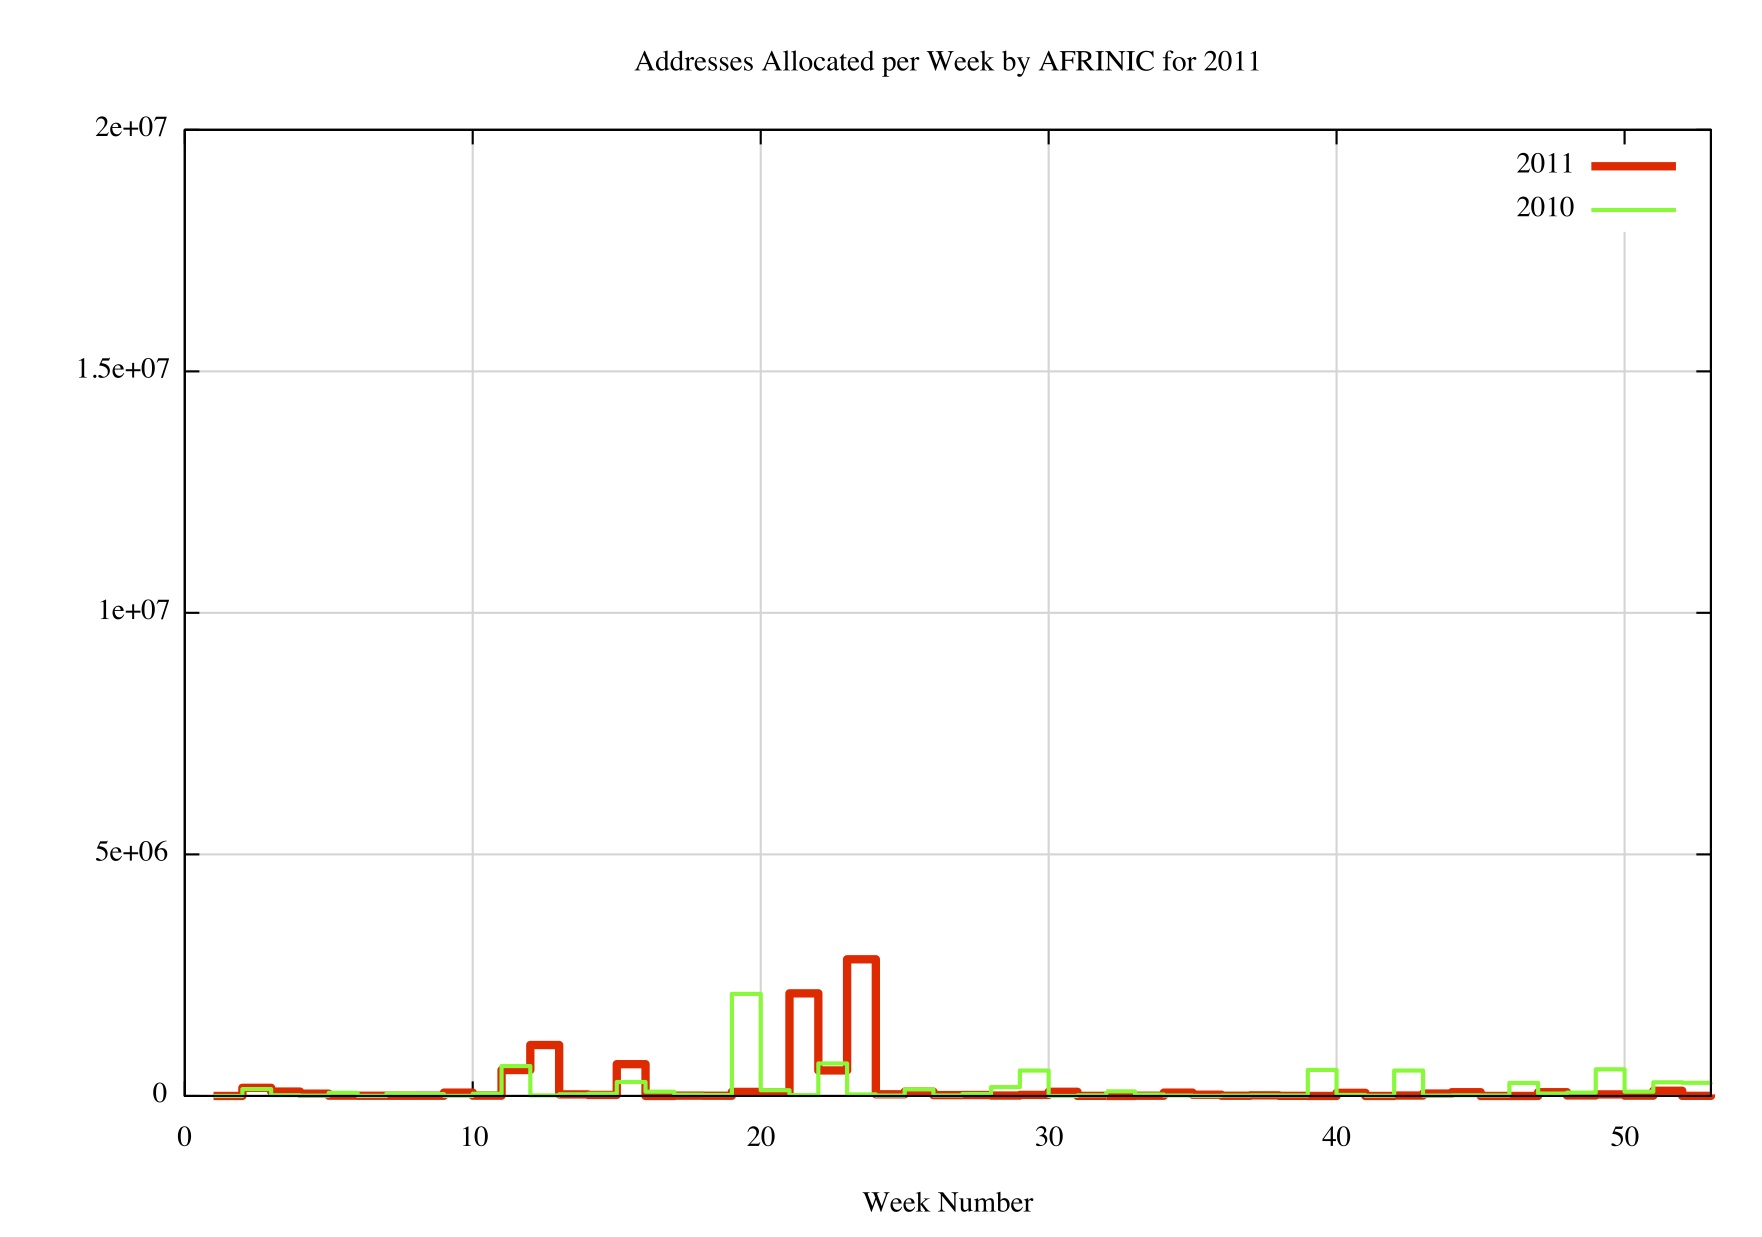
In the Asia Pacific region the strongest driver for IP addresses appears to be the spectre of exhaustion of IPv4 addresses, and there was a strong element of panic visible in the address consumption figures for the period January – April 2011 (Figure 1). The average number of addresses allocated per week by APNIC across 2010 was some 2.3 million addresses per week, whereas the first 16 weeks of 2011 saw the volume of allocations triple to an average of some 6.9 million addresses per week.
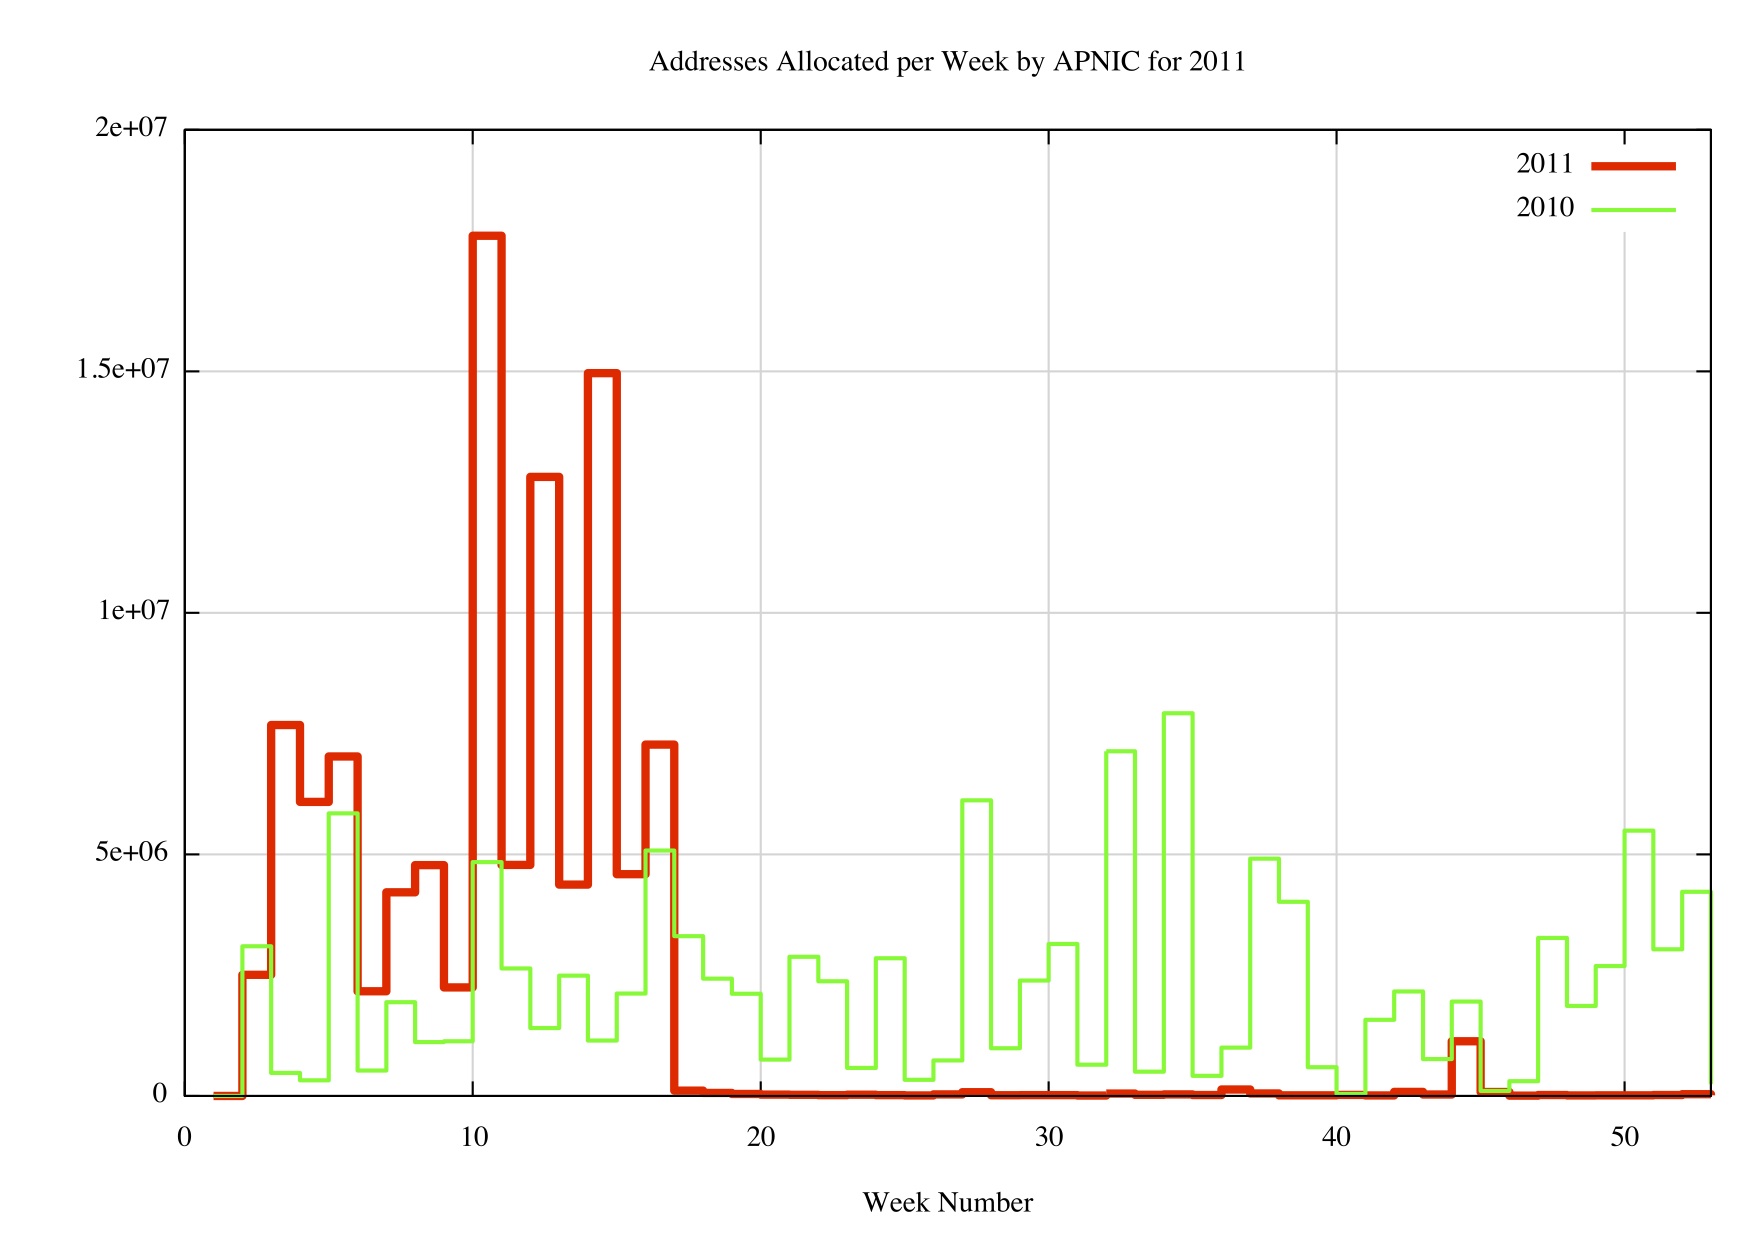
Figure 1 APNIC Weekly Address Allocation Levels: 2010 - 2011
In other regions there was no such obvious signs of panic in 2011, although there has been a change of allocation policy in the RIPE NCC and ARIN regions, where the "window" of demonstrable need has been reduced from 12 to 3 months. The comparable week-by-week allocation record for the other four RIRs is shown below in Figure 2.
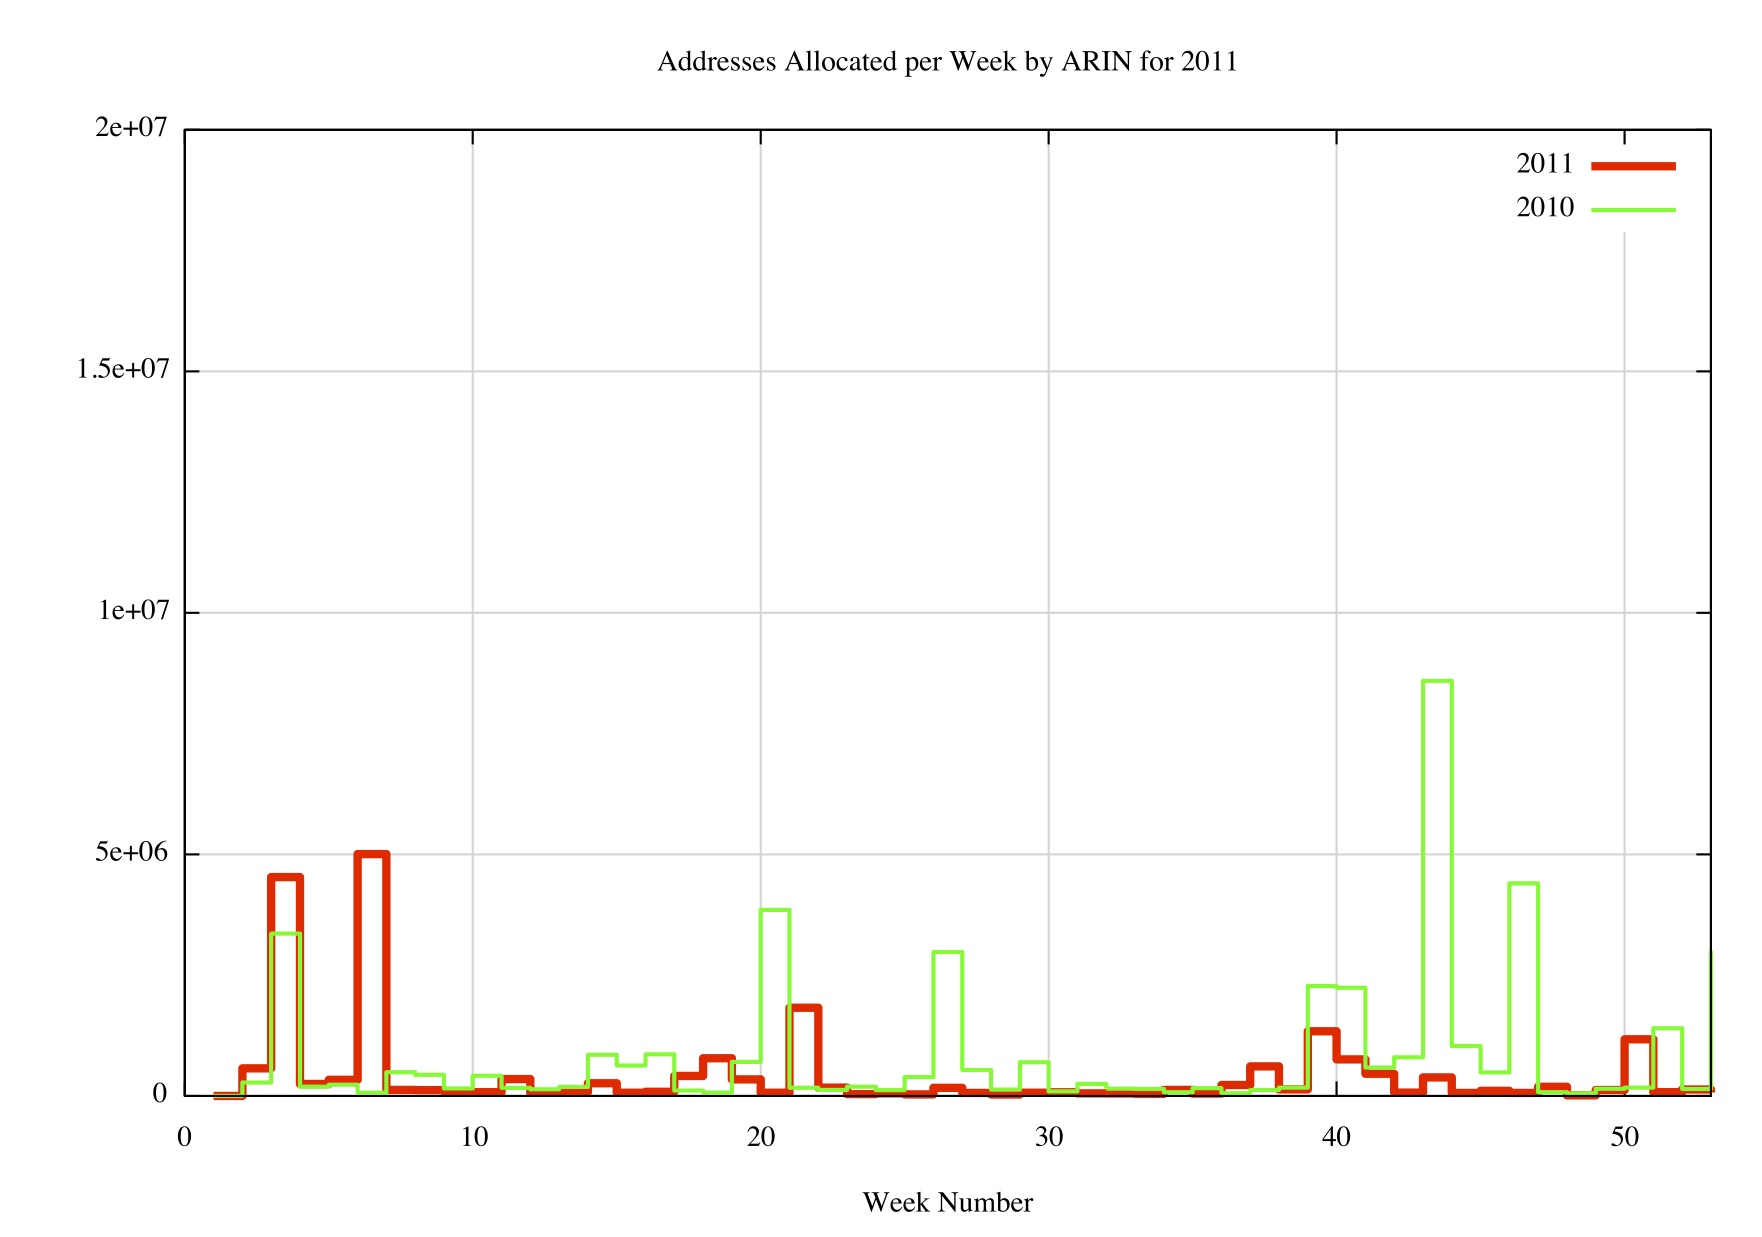
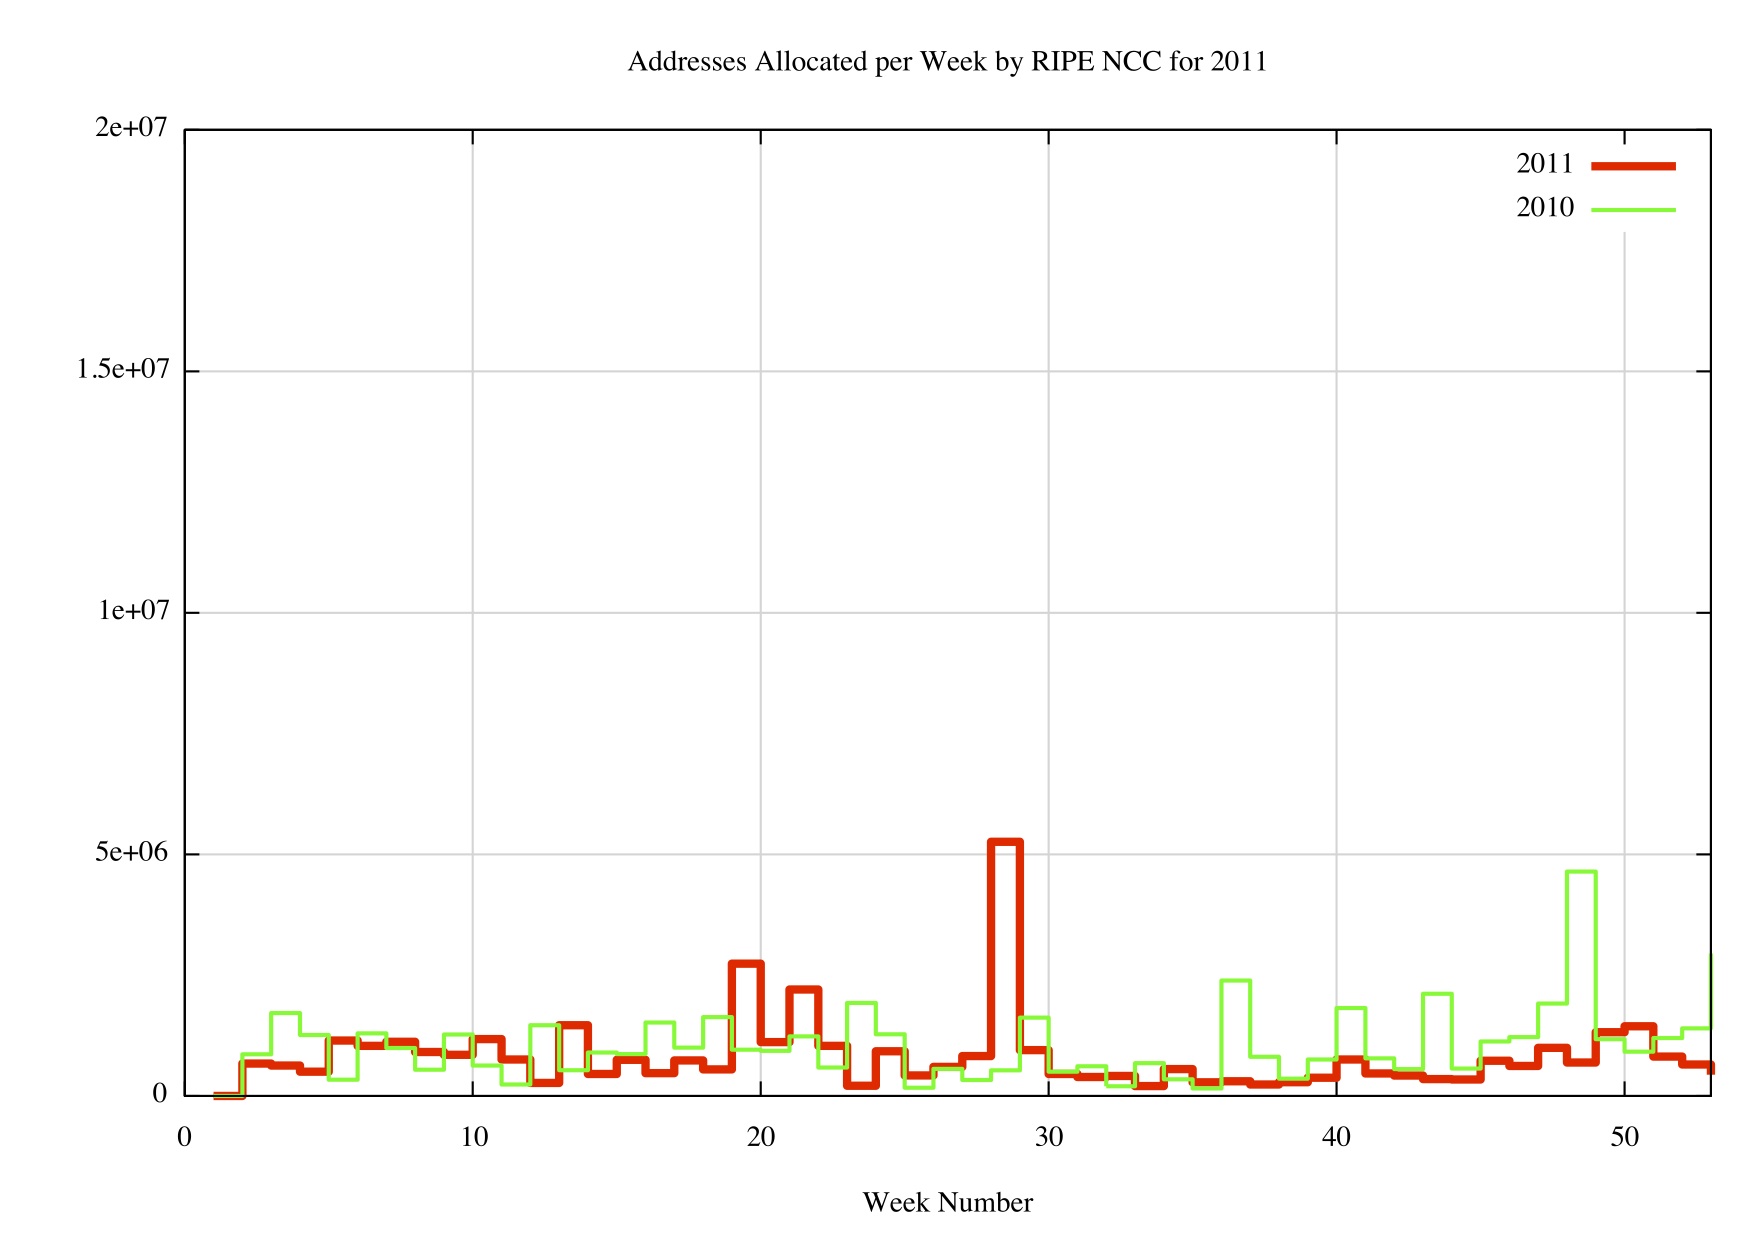
ARIN Allocations RIPE NCC Allocations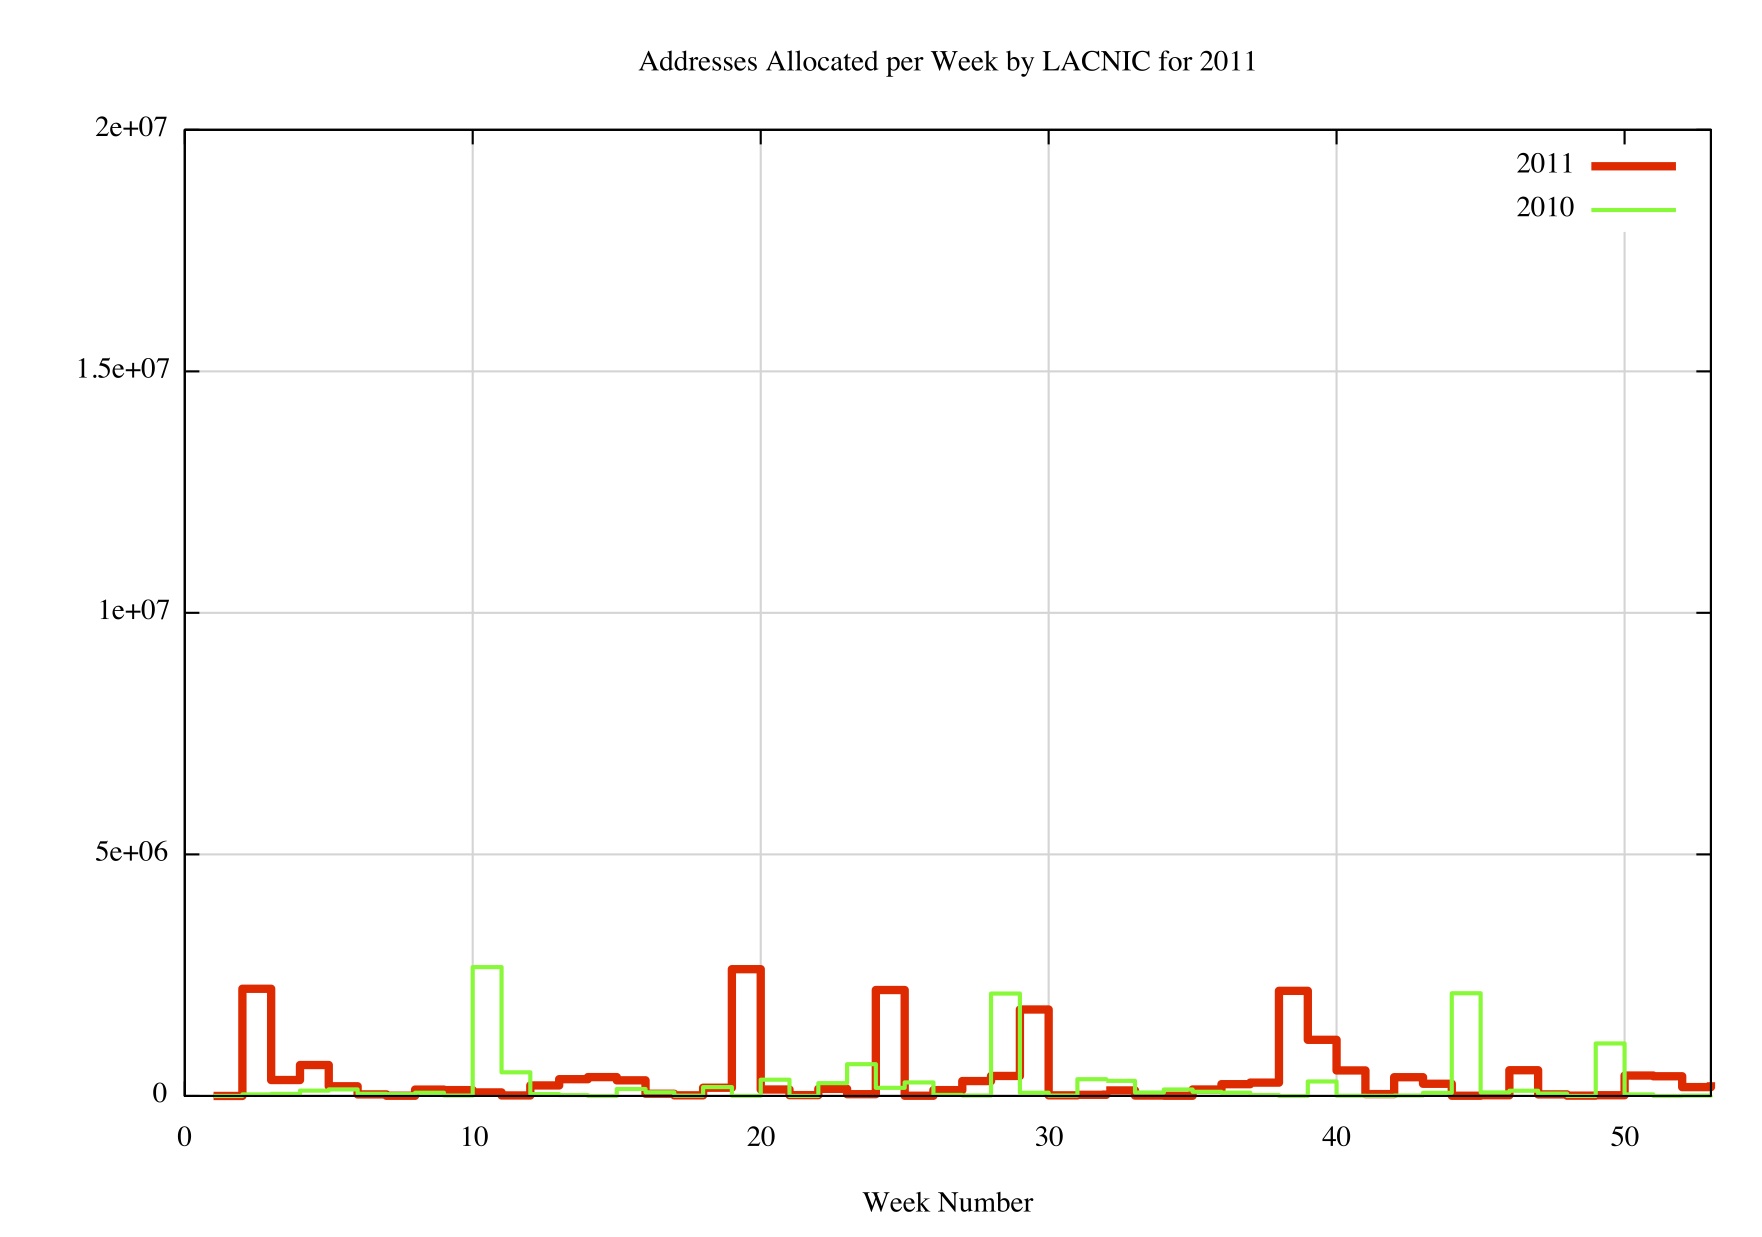
LACNIC Allocations AFRINIC Allocations
Figure 2 Weekly Address Allocation Levels: 2010 - 2011
Interestingly, the change in allocation policy is visible in the ARIN region, particularly for the larger allocations, but a comparable drop in allocations is not as visible in the RIPE NCC data, in spite of the reduced allocation window being used by the RIPE NCC in the latter part of 2011.
Address Distribution
Another way to look at the address distribution is in terms of "skew". If the Internet is populated by a largely homogenous population of service providers then the distribution of address allocations would be relatively uniform, such that the group of largest allocations would not be vastly larger than the group of smallest allocations. On the other hand , if the service provider population is skewed such that there is a small number of very large providers that service the bulk of the user population, then we would expect to see the bulk of addresses being allocated to a small number of providers. One way to look at the level of skew is to use a cumulative distribution plot, comparing the number of allocations to the amount of address space, shown below.
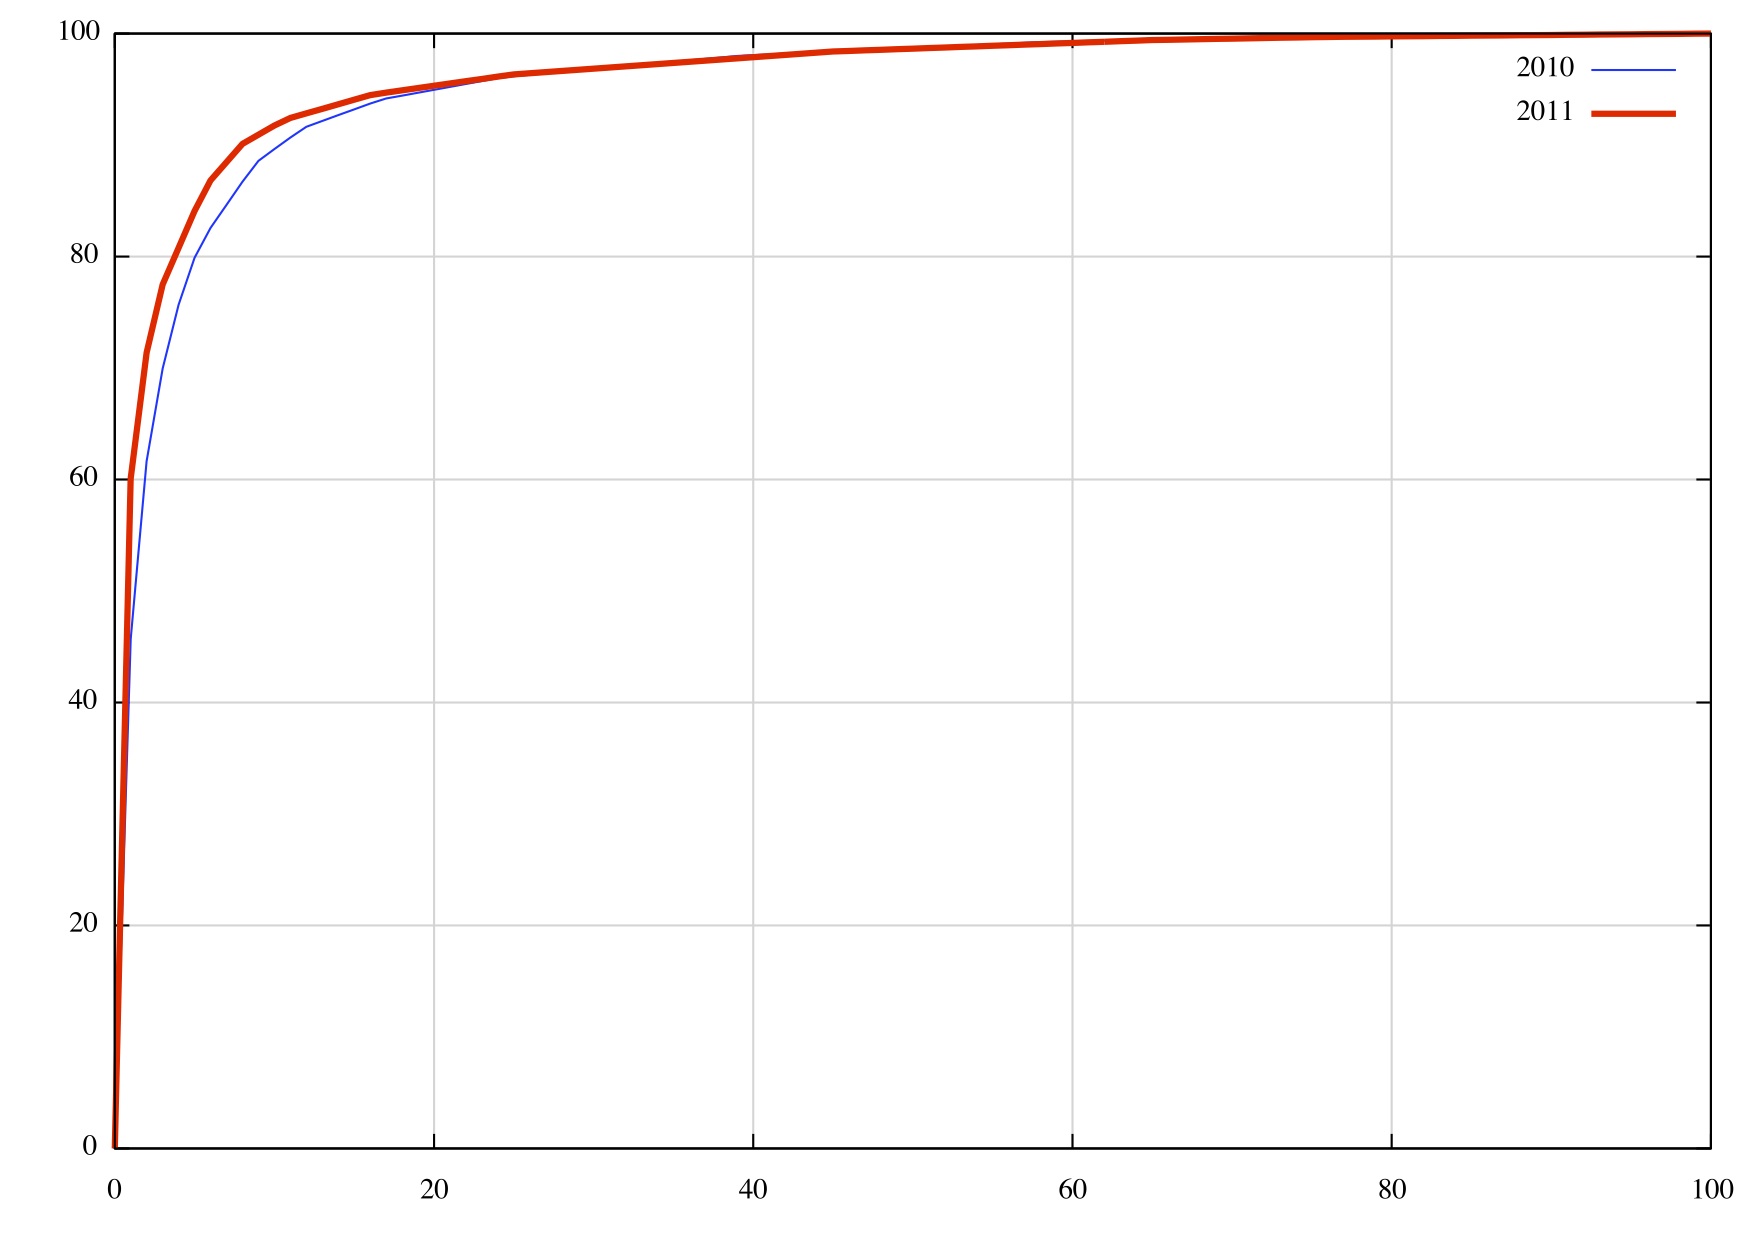
Figure 3 - IPv4 Allocation Distribution
Compared to 2010 the concentration of address allocations to a small number of providers has increased in relative terms. In 2011
What this distribution is showing is that of the 10,061 individual IPv4 allocations that were made in 2011, just 58 allocations accounted for 50% to the total amount of allocated address space, or 100 million IPv4 addresses. There were 3 of these large allocations made by AfriNIC in 2011, 3 by the RIPE NCC, 6 by LACNIC, 7 by ARIN and 39 allocations by APNIC. Drilling down a little deeper on the largest allocations in this set, there was 1 allocation of 8.3 million addresses (/9) (made by APNIC), 7 allocations of 4.2 million addresses (/10) (4 by APNIC, 2 by ARIN and 1 by the RIPE NCC), and 14 allocations of 2 million addresses (/11) (7 by APNIC, 4 by LACNIC, 2 by Afrinic and 1 by the RIPE NCC. These 22 allocations in 2011 went to 18 distinct entities, as listed in Table 4. These 18 entities collectively accounted for 33% of the total address allocations in 2010.
| Rank | Economy | Organization | Addresses (M) |
| 1 | Japan | NTT Communications Corporation | 8.39 |
| 2 | China | China Mobile Communications Corporation | 8.39 |
| 3 | Brazil | Comite Gestor da Internet no Brasil (Brasil NIR) | 6.29 |
| 4 | Indonesia | PT Telekomunikasi Selular Indonesia | 6.29 |
| 5 | Japan | KDDI Corporation | 4.19 |
| 6 | United States | AT&T Mobility LLC | 4.19 |
| 7 | United States | AT&T Internet Services | 4.19 |
| 8 | France | Bouygues Telecom | 4.19 |
| 9 | Germany | Telekom Deutschland Mobile | 2.10 |
| 10 | China | CHINANET Zhejiang Province Network | 2.10 |
| 11 | China | China TieTong Telecommunications Corporation | 2.10 |
| 12 | Pakistan | Pakistan Telecommuication | 2.10 |
| 13 | China | China Unicom Shandong province network | 2.10 |
| 14 | Morocco | Maroc Telecom | 2.10 |
| 15 | India | Bharti Airtel Limited | 2.10 |
| 16 | Vietnam | Viettel Corporation | 2.10 |
| 17 | Mexico | Uninet S.A. de C.V., Mexico | 2.10 |
| 18 | Egypt | TE Data, Egypt | 2.10 |
| Total | 67.11 |
Table 4 - IPv4 Allocated Addresses - Top 18 allocations for 2011
Of note here is the inclusion of a number of new economies in this list, notably from those parts of the world that are generally termed "developing economies."
This "heavy tail" distribution of the largest allocations has not always been the case. In looking at the distribution of IPv4 allocations over the past decade the following table shows the percentage of address space that were allocated to the 1% largest individual allocations and the lower half of the individual allocations.
| IPv4 Allocations | 2001 | 2002 | 2003 | 2004 | 2005 | 2006 | 2007 | 2008 | 2009 | 2010 | 2011 |
| Top 1% | 30% | 39% | 38% | 38% | 51% | 45% | 51% | 47% | 50% | 49% | 60% |
| Lower 50% | 5% | 5% | 4% | 3% | 1% | 2% | 1% | 1% | 1% | 1% | 1% |
Table 5 - IPv4 Allocated addresses
What appears to have happened across the period 2000 - 2005 was a marked phase of aggregation in this industry, where the economies of scale in a mass market for Internet services started to exercise significant influence over the deployment of services on the Internet. This picture has remained relatively consistent since 2005, and the largest 100 Internet enterprises across the world appear to undertake at least one half of the volume of deployment of new Internet services. To the extent that the Internet on the 1990's was a poster child of a strongly competitive environment and highly diverse supply industry in the communications sector, the 2000's has seen the Internet progress into an environment which is dominated by economies of scale and large scale supplier enterprises. A marketplace that is strongly influenced by a small number of larger enterprises is often not as agile in areas of technical and service innovation, and competitive pressures are not as strong a factor when one or two providers assume a dominant market position.
The distribution of addresses in the IPv4 Internet paints a picture of an industry that has now completed a process of aggregation, and the pressures that will lead to further evolution of the Internet in the coming years will probably be different to those that drove the Internet of some years ago.
IPv4 Address Exhaustion
Two milestones occurred in 2011 on the path to IPv4 address exhaustion, namely the exhaustion of the central pool of addresses by the IANA in February 2011, and the first of the RIRs to exhaust its general use address pool, by APNIC in April 2011.
The Internet continues to rely very heavily, if not exclusively, on IPv4, and the consumption of a further 200 million addresses in 2011 leaves 307 million addresses in the pool of unallocated addresses, or a total of some 18 months if we were able to access these addresses at the same rate as we have been to date. However this is not the case.
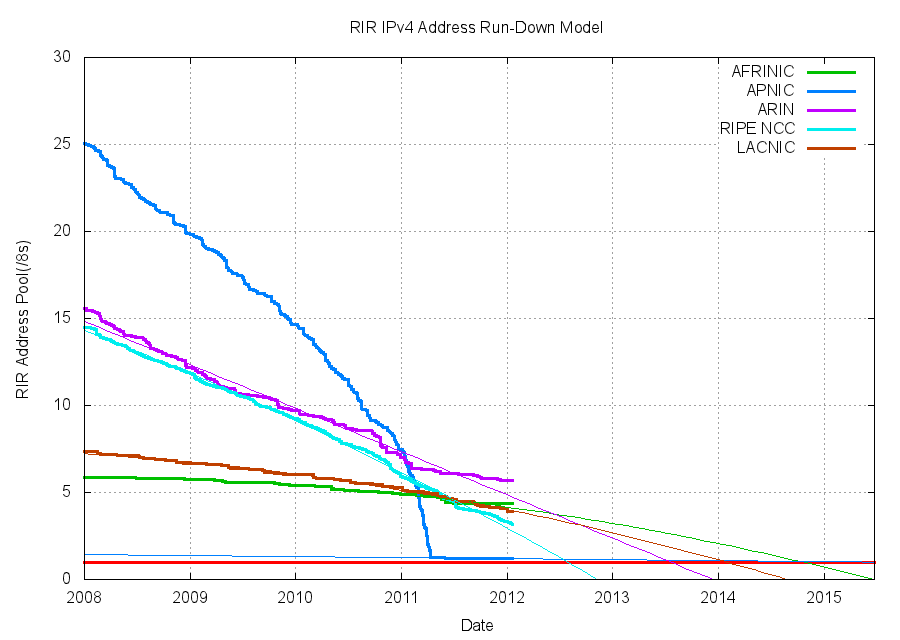
Figure 4 – RIR Address Exhaustion Model
APNIC holds some 20 million addresses, but at this stage has is operating under an allocation policy where each entity can receive a maximum of 1024 addresses.
The RIPE NCC holds 54 million addresses, and is allocation addresses at an average rate of some 6 million addresses per month. At this rate it is anticipated that the RIPE NCC will be left with a single /8 address block around mid-2012. If there is any repeat of industry panic this may occur earlier, of course.
ARIN hold 95 million addresses. At this point in time the average monthly address consumption rate for ARIN is 1.8 million addresses per month, and if this rate remains steady, then ARIN's pool of addresses will last a further 3 ½ years before ARIN reach a low threshold of 1 /8 remaining. Taking a longer term average consumption rate for ARIN that spans the past 4 years provides a somewhat higher level of average demand, but even in this case ARIN's holdings of addresses will last for a further 18 months.
LACNIC hold 65 million addresses at the end of 2011. The average address consumption rate for LACNIC is some 1.6 million addresses per month, which implies the LACNIC will reach its final /8 of address holdings in some 2 ½ years from now.
AfriNIC hold some 73 million addresses, and have an average address consumption rate of some 0.75 million addresses per month.. At this rate Afrinic will reach its final /8 in some 4 years from now.
From these figures it appears evident that the pressures of IPv4 address exhaustion will next be felt in the Europe and Middle East region, and this is likely to occur in the first half of 2012.
IPv6 in 2011
IPv6 uses a somewhat different address allocation methodology than IPv4, and it is a matter of choice for a service provider as to how large an IPv6 address prefix is assigned to each customer. The original recommendations published by the IAB and IESG in 20012 (RFC3177) envisaged the general use of a /48 as an end site prefix. Subsequent consideration saw a more flexible approach being taken with the choice of the end site prefix size being left to the service provider, and today's IPv6 environment has some providers using a /60 end site allocation unit, some use a /56, and other providers use a /48. This variation makes a comparison of the count of allocated IPv6 addresses somewhat misleading, as an ISP using /48's for end sites will require 256 times more address space to accommodate the same customer base as a provider who uses a /56 end site prefix, and 65,000 times more address space than an ISP using a /60 end site allocation.
So for IPv6 let's use both the number of discrete IPv6 allocations and the total amount of space that was allocated to see how IPv6 fared in 2011.
Comparing 2010 to 2011 the number of individual allocations of IPv6 address space rose slightly, from 2,461, allocations in 2010 to 2,500 allocations in 2011. At the same time the number of IPv4 allocations rose sharply from 7,758 to 10,061, largely as a result of the change in APNIC allocation policy following exhaustion of its general use address pool. What is perhaps surprising is the absence of a sharp uptake of IPv6 in 2011.
| Allocations | 2005 | 2006 | 2007 | 2008 | 2009 | 2010 | 2011 |
| IPv6 | 240 | 234 | 475 | 860 | 1,236 | 2,436 | 3,587 |
| IPv4 | 4,774 | 5,646 | 6,312 | 6,969 | 6,701 | 7,758 | 10,061 |
Table 6 - Number of individual Address Allocations, 2005 - 2011
However, when looking at the amount of IPv6 address space allocated in 2011, there has been a substantial uptake of IPv6, with the amount of IPv6 address space allocated in 2011 triple the volume of address space that was allocated in 2010.
| Addresses | 2005 | 2006 | 2007 | 2008 | 2009 | 2010 | 2011 |
| IPv6 (/32s) | 26,991 | 9,792 | 6,678 | 80,996 | 1,064 | 5,835 | 15,018 |
| IPv4 (/32s)(M) | 174.4 | 168.1 | 203.9 | 203.3 | 189.4 | 248.8 | 201.0 |
Table 7 – Volume of Address Allocations, 2005 - 2010
The level of address allocation activity in IPv6 was most evident in 2011 in the more mature internet markets of Europe, North America and Asia, showing that where there is a mature IP infrastructure in an economy, the local industry has turned its attention to the infrastructure deployment of IPv6 in 2010. This is visible in the level of IPv6 allocation activity in each RIR (Tables 7 and 8).
| Allocations | 2005 | 2006 | 2007 | 2008 | 2009 | 2010 | 2011 |
| RIPE NCC | 93 | 89 | 158 | 427 | 622 | 1,042 | 1,647 |
| ARIN | 59 | 69 | 210 | 227 | 378 | 623 | 1,038 |
| APNIC | 54 | 43 | 63 | 161 | 190 | 666 | 641 |
| LACNIC | 31 | 16 | 25 | 29 | 33 | 50 | 132 |
| AFRINIC | 3 | 17 | 19 | 16 | 13 | 55 | 129 |
| 240 | 234 | 475 | 860 | 1,236 | 2,436 | 3,587 |
Table 8 - IPv6 allocations by RIR
| IPv6 Addresses (/32s) | 2005 | 2006 | 2007 | 2008 | 2009 | 2010 | 2011 |
| RIPE NCC | 17,495 | 6,481 | 1,251 | 606 | 602 | 1,867 | 2,425 |
| ARIN | 57 | 52 | 137 | 14,488 | 249 | 579 | 2,280 |
| APNIC | 9,373 | 3,226 | 5,237 | 141 | 174 | 3,239 | 9,506 |
| LACNIC | 53 | 16 | 39 | 65,749 | 30 | 46 | 652 |
| AFRINIC | 3 | 17 | 14 | 12 | 9 | 104 | 155 |
| 26,981 | 9,792 | 6,678 | 80,996 | 1,064 | 5,835 | 15,018 |
Table 9 - IPv6 address allocation volumes by RIR
It appears to be the case that IPv4 address exhaustion in the Asia Pacific region has a significant impact on the industry's attention to IPv6, with the volume of IPv6 addresses being allocated in 2011 triple that of 2010.
| Rank | 2008 | 2009 | 2010 | 2011 | ||||
| 1 | United States | 211 | United States | 349 | United States | 556 | United States | 924 |
| 2 | Germany | 67 | Germany | 86 | Australia | 146 | Australia | 176 |
| 3 | United Kingdom | 34 | United Kingdom | 66 | Germany | 124 | Germany | 160 |
| 4 | Russia | 33 | Netherlands | 56 | United Kingdom | 106 | United Kingdom | 150 |
| 5 | Netherlands | 33 | Australia | 53 | Russia | 102 | Russia | 147 |
| 6 | Switzerland | 33 | Russia | 46 | Netherlands | 86 | France | 110 |
| 7 | Australia | 30 | Japan | 32 | China | 86 | Canada | 107 |
| 8 | Japan | 28 | France | 29 | Indonesia | 72 | Netherlands | 107 |
| 9 | Italy | 22 | Czech Rep. | 29 | Japan | 62 | Sweden | 96 |
| 10 | Vietnam | 22 | Sweden | 27 | France | 60 | Czech Rep. | 88 |
Table 10 - IPv6 allocations by Economy
| Rank | 2008 | 2009 | 2010 | 2011 | ||||
| 1 | Brazil | 65,728 | United States | 225 | Japan | 2,518 | China | 8,997 |
| 2 | United States | 14,478 | Germany | 143 | Germany | 600 | United States | 2,205 |
| 3 | Sweden | 143 | United Kingdom | 61 | United States | 523 | Spain | 641 |
| 4 | France | 82 | Australia | 45 | China | 339 | United Kingdom | 384 |
| 5 | Germany | 66 | Netherlands | 44 | Belgium | 270 | Venezuela | 262 |
| 6 | United Kingdom | 34 | Russia | 43 | France | 181 | Mexico | 261 |
| 7 | Switzerland | 33 | Japan | 33 | Australia | 100 | Netherlands | 229 |
| 8 | Russia | 33 | France | 24 | Sweden | 94 | Germany | 187 |
| 9 | Netherlands | 32 | Czech Rep. | 21 | Russia | 94 | Russia | 146 |
| 10 | China | 26 | Sweden | 21 | United Kingdom | 94 | Australia | 124 |
Table 11 - IPv6 Address Allocation Volumes by Economy
Table 10 shows the amount of IPv6 address space assigned on a per economy basis for the past 4 years (using units of /32s). In 2011 the major component of IPv6 space allocated by APNIC was allocated to Chinese entities, and China accounted for more than half of all IPv6 addresses allocated in 2011. A large IPv6 allocation was made in Japan in 2010. With the exception of Australia no other Asia Pacific economy has figured in the top 10 economies in the past three years, so while the message about IPv6 may have been taken up in parts of the Asia Pacific region, it by no means universally taken up across the entire region as yet.
The Outlook for the Internet
The past four years has shown that the Internet is now an integral part of the portfolio of conventional business activity across the world, and the deployment of internet services and the opening up of markets through deployment of Internet services is subject to the same economic opportunities and constraints as any other business activity. Those economies that were adversely impacted by the global financial situation saw a drop in the expansion of new Internet services and a drop in their demands for IP address allocations across 2011, while other economies that managed to avoid the worst impacts of a financial recession continued to see growth in new Internet markets across the year.
The past three years has been dominated by the mass marketing of mobile internet services, and the growth rates for 2011 perhaps might have been the highest so far recorded were it not for the exhaustion of the IPv4 address pools in the Asia Pacific region. In 2012 we anticipate that the RIPE NCC will also exhaust its stocks of available IPv4 addresses.
However the industry uptake of IPv6 is still lagging, and address allocations in various economies are still highly variable. As the IPv4 address pool dwindles in 2011 we will see the growth trends change once more, and the transition to an IPv6 Internet will not be seamless.
At the same time we are witnessing an industry that is no longer using technical innovation, openness and diversification as its primary means of propulsion. Today's internet is serviced by a far smaller number of very large players, each of whom appear to be assuming a very strong position within their respective markets. The drivers for such larger players tend towards risk aversion, conservatism and increased levels of control across their scope of operation.
This changing makeup of the Internet industry also has quite profound implications in terms of network neutrality, the separation of functions of carriage and service provision, investment profiles and expectations of risk and returns on infrastructure investments, and on the openness of the Internet itself. 2011 was a very interesting year as the stocks of IPv4 addresses were exhausted in the Asia Pacific region. We expect 2012 to be no less interesting as exhaustion becomes apparent in the European region as well.
![]()
Disclaimer
The views expressed are the author’s and not those of APNIC, unless APNIC is specifically identified as the author of the communication. APNIC will not be legally responsible in contract, tort or otherwise for any statement made in this publication.
![]()
About the Author
GEOFF HUSTON B.Sc., M.Sc., has been closely involved with the development of the Internet for many years, particularly within Australia, where he was responsible for the initial build of the Internet within the Australian academic and research sector. He is author of a number of Internet-related books, and has been active in the Internet Engineering Task Force for many years.