|
The ISP Column
A column on all things Internet
|
|
|
Other Formats:
|
|
|
|
|
November 2005
Geoff Huston
What's the question again?
It has often been said that anything can be proved with statistics, and that may well be the case. As this article is describing an exercise in statistical analysis, in order to make some predictions about when certain events may take place, then some care must be taken to ensure that the question is clearly phrased, and that the data being analyzed is clearly relevant to the question.
So perhaps the best way to commence this article is to ask what is the question being posed here? Is it an effort to predict the date of the end of IPv4? Or is this a prediction of the date when complete IPv4 address exhaustion will occur? This article does not attempt to encompass such ambitious forms of prediction. The exercise being undertaken here is far more modest. The question being posed is: "What is the anticipated date when the current policy regime concerning the distribution of IPv4 address is no longer relevant?" Or, in other words, we are looking for some indicators as to the time when our current policies for IPv4 address distribution are expected to run out because the unallocated address pool on which these policies are based is exhausted.
The predictive exercise described here points to a time when the current address distribution mechanisms will no longer apply. The current address allocation policies used by the Regional Internet Registries (RIRs) are critically based on a continual supply of previously unused addresses being assigned to meet the needs of applicants. This is achieved by the RIRs continually drawing addresses from the unallocated address pool. At the point in time when the unallocated address pool is exhausted the current distribution mechanism for addresses as used by the address registries would appear to have reached a logical conclusion. As to what mechanisms would be appropriate beyond that date to support the continued distribution of addresses, that is not a topic to be considered in this particular report.
IPv4 Address Distribution Structure
An address goes through a number of stages on the path to deployment. Originally the address block is a parameter set of the underlying protocol, and the intended purpose of segments of the address space is described in an address architecture.
IPv4 Address Architecture
In the case of IPv4 there have been a number of iterations of address architecture, starting with the original specification of the so-called 8/24 split, using 8 bites to identify the network and 24 bits to identify the end host, then the adoption of the Class-based address system, to the current classless setup, where addresses in the range 0.0.0.0 through to 223.255.255.255 are assigned for use as global unicast addresses, addresses in the range 224.0.0.0 though to 239.255.255.255 are assigned for multicast use, and the remaining addresses, from 240.0.0.0 through to 255.255.255.254 are reserved for future definition by the IETF [RFC3330].
The Internet Assigned Numbers Authority (IANA)
The role of the IANA in this activity is to manage the unallocated IPv4 unicast address pool. IANA does not perform end-user or ISP address assignments, but performs allocations of address blocks to RIRs under defined criteria of RIR use. The criteria for IANA allocation of address space to an RIR is described in [IPv4 Policy]. Address space is allocated to the RIRs in units of /8 address blocks, and the specific address blocks allocated to the RIR is an IANA decision. The block is allocated to the RIR when the RIR's available space falls below the equivalent of a /9, or falls below the working space required for 9 months of allocations. The allocation made by IANA is a minimum of a /8 block, and enough to restore the RIR's address pool to encompass a further 18 months of allocations.
The Regional Internet Registries (RIRs)
The Regional Internet Registries are AFRINIC, APNIC, ARIN LACNIC and the RIPENCC. The RIRs operate as self-regulatory bodies with strong regional industry support and participation. One role of the RIRs is to host open policy fora that, among other functions, sets address allocation policies within the region. The RIRs manage the address distribution function, assigning addresses to ISPs and various forms of Local Internet Registries (LIRs) in a manner that conforms to these regional policies.
The Address Distribution Function
The overall picture of the address distribution function is the definition of unallocated address space as a protocol standards action, and the management role of the unallocated global unicast address space to the IANA. The IANA then allocate this address space to the RIRs, under criteria as agreed between the IANA and the RIRs. The RIRs then pass this address space to Local Internet Registries and ISPS, each RIRs using criteria for this distribution function as determined by the regional policy forum. Further address distribution is perform by the LIR or ISP is a manner that is consistent with regional address policies.
A number of aspects of this function are designed to prevent various forms of failure or distortion of the address distribution function:
- The essential attribute of address distribution that is to be preserved is its uniqueness of allocation.
- Address policies are intended to be applied uniformly and fairly.
- The prevailing address policy regime characterizes addresses as a network attribute, rather than as an asset or tradeable good in its own right.
- Addresses are made available from the unallocated pool to meet demands for their use in networks, and are intended to be assigned for as long as the need condition continues. Unneeded addresses are to be passed back to the registry.
Addresses are an unpriced public good. Address trading is explicitly not supported in terms of registry support functions relating to title transfer. The policy mechanism is intended to prevent various forms of trading that may lead to market distortions such as hoarding, monopolistic control, cartels, price fixing, for example.
An Analysis of IPv4 Addresses
This exercise looks at the various holding pools associated with the unallocated address pool, and analyses their dynamic behavior over time, as well as modelling the application the relevant policies to these address pools. The exercise also attempts to assess the relative behavior of the pool of allocated and advertised addresses and the associated pool of allocated, but unadvertised addresses, and derive a model of anticipated future demands of allocations from the unallocated address pools.
Again, this is not a report on the prediction of the "exhaustion of IPv4", nor when "IPv4 addresses will run out". This is a more specific report on the procedure used to make an estimate, based on recent consumption trends, as to when the current policies for address distribution that rely on the continued availability of the unallocated address pool may be exhausted. At that point different address distribution policies are necessary to continue to serve the production IPv4 Internet.
The date predicted by this model where the IPv4 unallocated address pool will be exhausted is 27-May-2013. A related prediction is the exhaustion of the IANA IPv4 unallocated address pool, which this model predicts will occur in 12-May-2012.
This model constructs a demand model for IPv4 address space. As a further exercise in projections, it is possible to construct a very approximate estimation of a potential response to the exhaustion of the unallocated number pool. The assumption made in this model is that the unadvertised address pool would come back into play to fuel further demand for IPv4 address space in the context of network demand. A very approximate prediction of the effect of this market on the longevity of the IPv4 address distribution function is also contained in this report. An very approximate estimate of additional time such an option would provide is 23-Mar-2023 .
Current Status
The IPv4 address space is a 32 bit field. There are 4,294,967,296 unique values, considered in this context as a sequence of 256 "/8s", where each "/8" corresponds to 16,777,216 unique address values.
As noted in [RFC3330] a number of address blocks are reserved for uses outside 'conventional' use in the public Internet as unicast identity tokens. In adding up these special purpose use address reservations there are the equivalent of 36.086 /8 address blocks in this category. This is composed of 16 /8 blocks reserved for use in multicast scenarios, 16 /8 blocks reserved for some unspecified future use, 1 /8 block (0.0.0.0/8) for local identification, a single /8 block reserved for loopback (127.0.0.0/8), a /8 block reserved for private use (10.0.0.0/8), and a single /8 address block intended for some specialized use in so-called "public data networks" (14.0.0.0/8). Smaller address blocks are also reserved for other special uses.
The remaining 219.914 /8 address blocks are available for use in the public IPv4 Internet. IANA holds a pool of unallocated AS numbers, while the remainder have already been allocated by IANA for further downstream assignment by the RIRs. The current status of the total IPv4 address space is indicated in Figure 1.
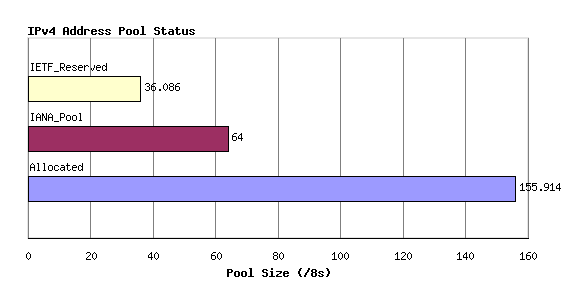
Figure 1 - Address Pool Status
This allocated number pool is managed by the Regional Internet Registries, (RIRs) and the breakdown of IANA allocated AS number blocks to each of the RIRs is shown in Figure 2. The address block allocated to "VARIOUS" refers to the [IANA IPv4 Address registry] where a number of /8 blocks were assigned prior to the commencement of today's RIR system, and are listed as assigned to "Various Registries". Address blocks that are assigned from these /8s are typically managed by multiple registries. The figure also includes 40 /8s listed against an IANA Registry. This refers again to the [IANA IPv4 Address registry] where, prior to the RIR system, a number of assignments were made directly by the IANA.
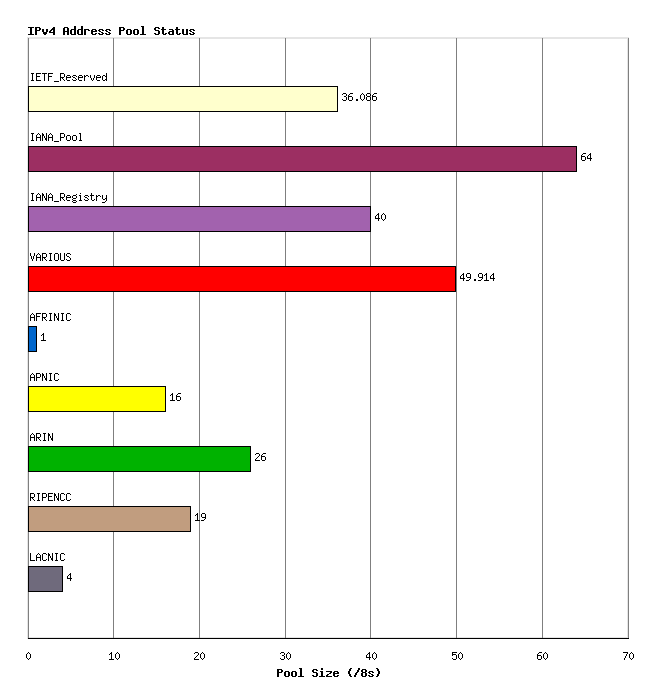
Figure 2 - Address allocations to RIRs
Any individual IPv4 address can be in any one of five states:
- reserved for special use, or
- part of the IANA unallocated address pool,
- part of the unassigned pool held by an RIR,
- assigned to an end user entity but not advertised in the routing system, or
- assigned and advertised in BGP.
The current totals of IP addresses according to this set of states is shown in Figure 3.
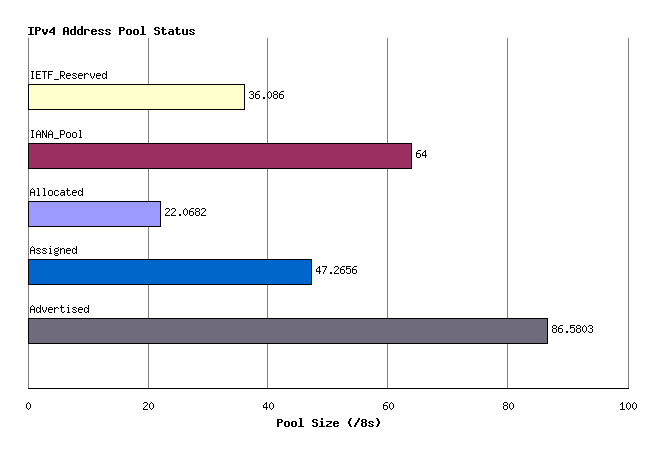
Figure 3 - Address Pools by State
This status can be further categorized per RIR, as shown in Figure 4.
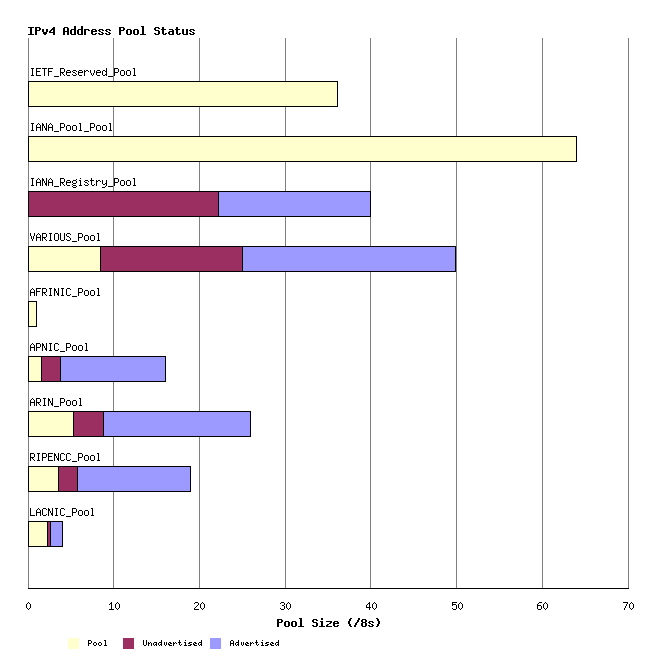
Figure 4 - Address Pools by RIR by State
Another view of the address state pools is by grouping the address space into a sequence of /8s, and looking at state sub totals within each /8 address block. The following view shows the current status of the IPv4 address space as 256 /8 columns each describing a pool of 16,777,216 addresses.
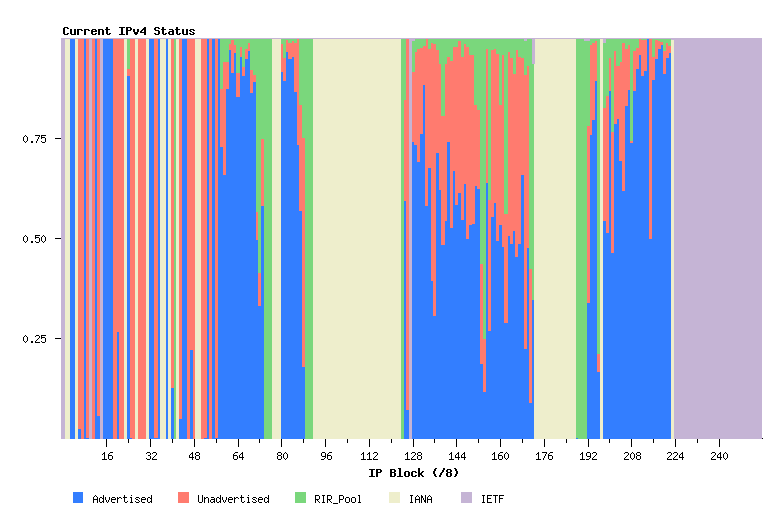
Figure 5 - IPv4 Address Status
Time Series Data
Allocations
IPv4 Address are drawn from the Unallocated Address Number Pool, administered by the IANA. These allocations are made to the Regional Internet Registries (RIRs), and the allocation unit is in units of /8s.
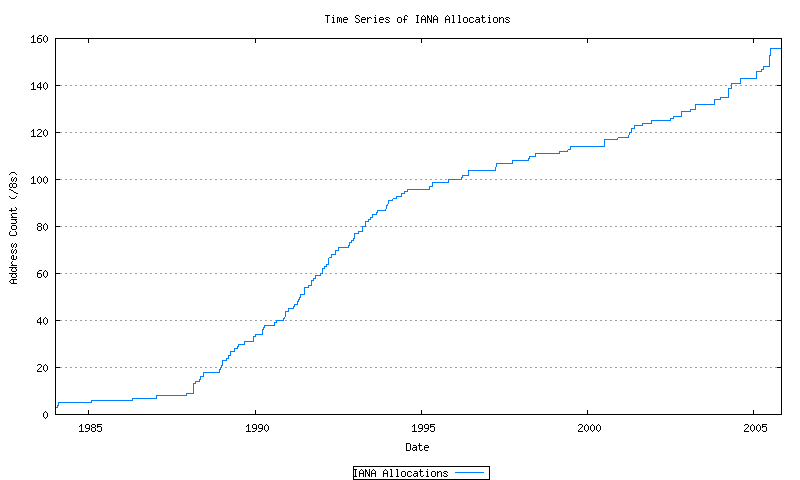
Figure 6 - Cumulative IANA Address allocations
This series can be further broken down by tracking the cumulative number of AS's that have been allocated to each of the 5 current RIRs. Also indicated here are the pre-RIR allocated blocks which are marked here as "VARIOUS". These allocations are indicated in Figure 7.
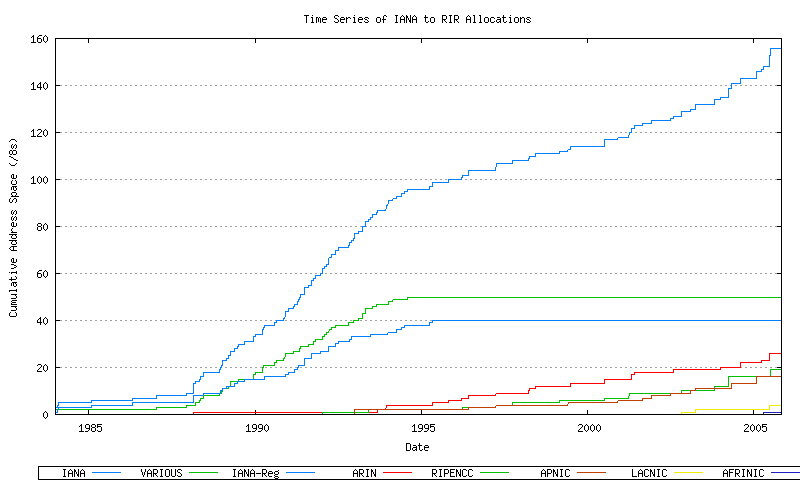
Figure 7 - Cumulative IANA Address block allocations per RIR
Assignments
RIRs perform assignments of address blocks to ISPs and local Internet registries. The cumulative number of assigned addresses over time is shown in Figure 8.
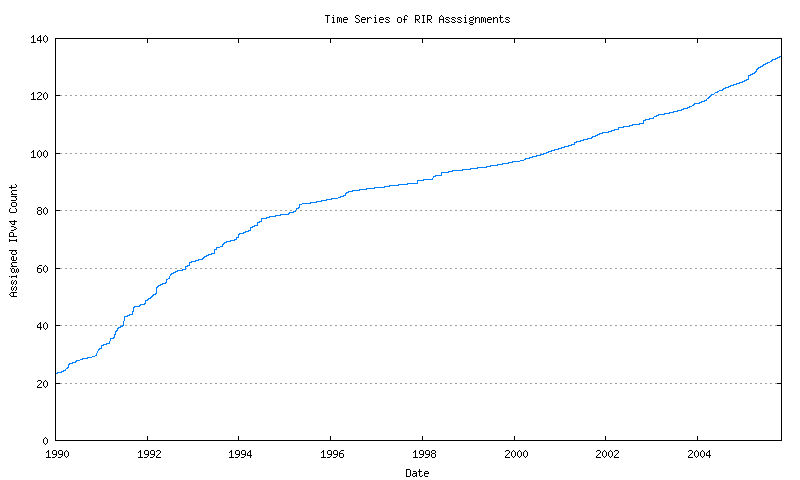
Figure 8 - Cumulative RIR Address assignments
This data can be further categorized by looking at the original allocation classification of the block from which the assignment has been performed.
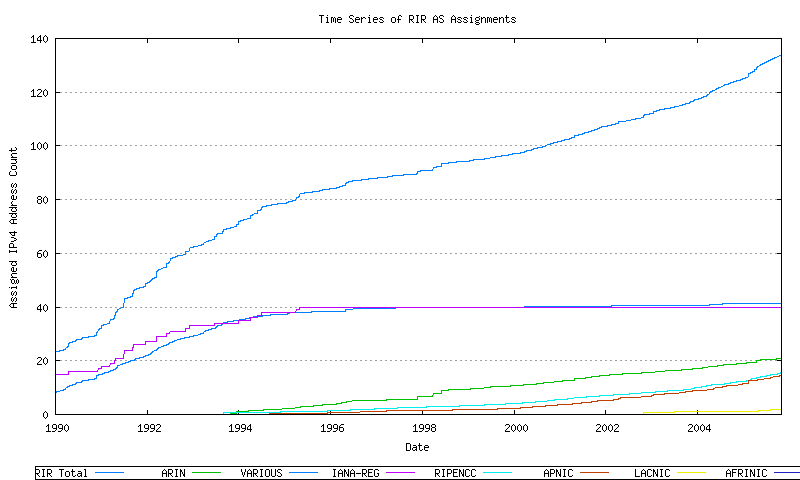
Figure 9 - Cumulative RIR AS assignments per RIR
RIR Pools
Each RIR allocates from its locally administered number pool. When the pool reaches a low threshold size a further address block is allocated by IANA to the RIR. The allocation quantity is based on the allocation activity recorded by the RIR for the 18 months prior to the allocation request, rounded to the next largest /8 address block. The pool size within each RIR over time can be derived from the allocation and assignment series data, producing the following graph. This is indicated in Figure 10.
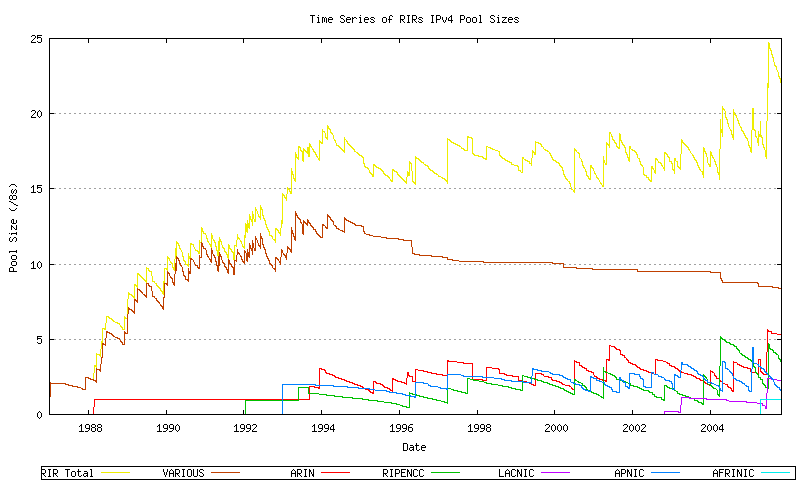
Figure 10 - RIR Address Pool size
The more recent data from this series is shown in Figure 11.
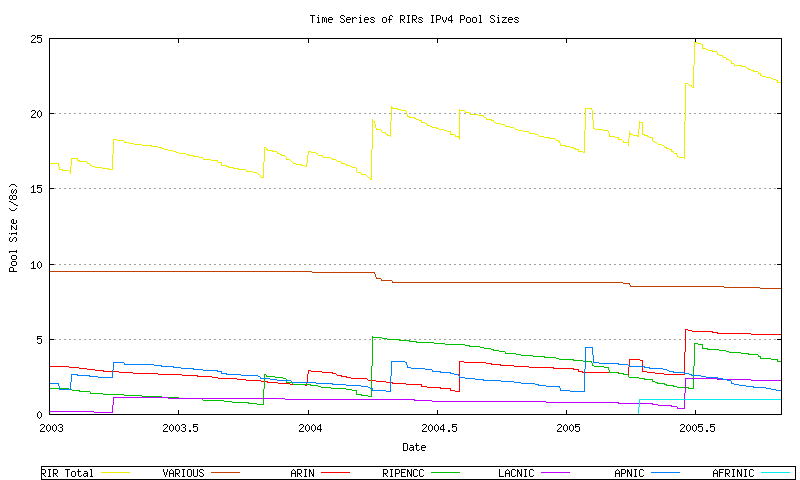
Figure 11 - RIR Address Pool size
Advertisements
The next data set is total span of address space advertised in the BGP routing table over time. The data has been collected on a 2-hourly basis since late 1999. This is shown in Figure 12.

Figure 12 - Advertised Address Count
This data shown a relatively high level of noise, due to the intermittent appearance of up to 3 /8 address advertisements, with frequencies that vary from hours to a number of days. in attempting to generate a best fit sequence to this data, some effort has been made to smooth this data, as indicated in the following figures. The first pass is to generate a day-by-day sequence, where all the sample values recorded over a day are averaged into a single daily value. This is shown in Figure 13.
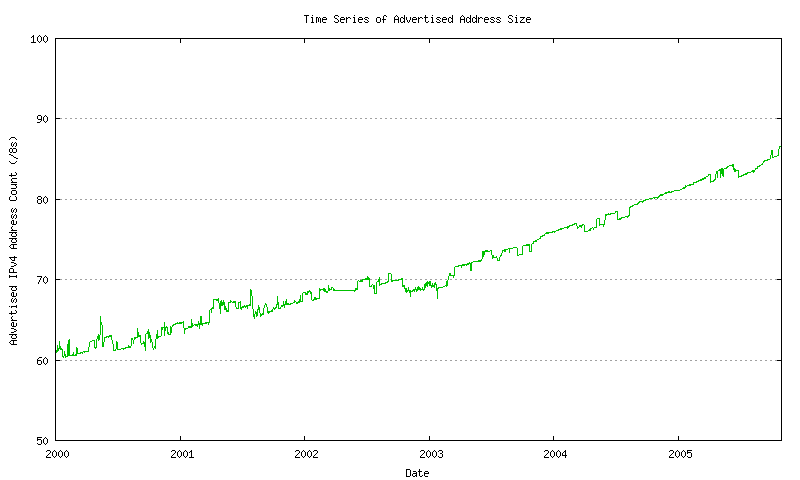
Figure 13 - Advertised Address Count - daily average
A comparison of the raw data and these daily averages is shown in Figure 14.

Figure 14 - Advertised Address Count - raw and daily average
This daily average sequence is smoothed by applying a sliding window average across the sequence in two passes. The size of this sliding window is 93 days (or approximately 3 months).

Figure 15 - Advertised Address Count - smoothed
The correlation of this smoothed sequence against the raw data and the daily average sequence is shown in Figure 16.
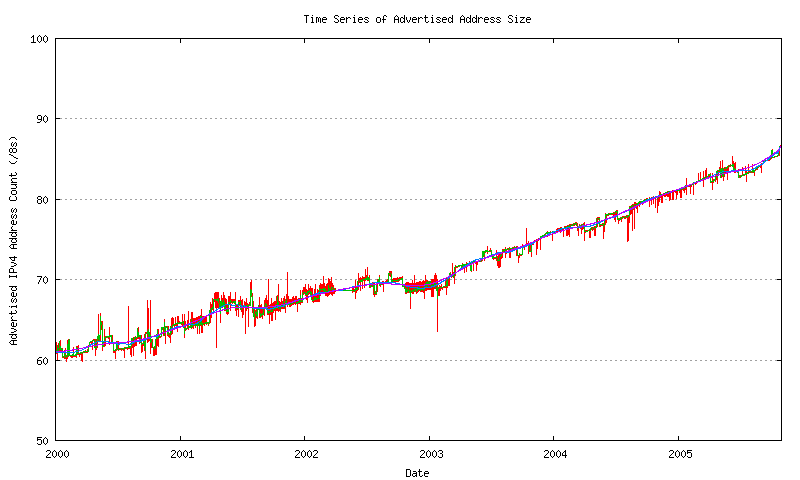
Figure 16 - Advertised Address Count - smoothed and raw data
Models for Address Consumption
Unadvertised Addresses
The approach used here will be based on the trend in advertised addresses. The rationale for this is that the basic policy framework used by the RIRs in distributing IPv4 addresses is that individual allocations of address space are based on demonstrated need for public addresses, most typically in the context of their intended use in the public Internet. In other words allocated addresses are allocated on the general understanding that such addresses will appear as advertised addresses in the public Internet. Some data to justify this approach is shown in Figure 20.
However, to get to that figure it is first necessary to generate a view of the unadvertised as well as the advertised allocated address space. The difference between the daily allocated address total and the daily average of the advertised address span is the unadvertised address count for each day. Figure 17 shows the number of advertised and advertised ASs as a day-by-day time series.
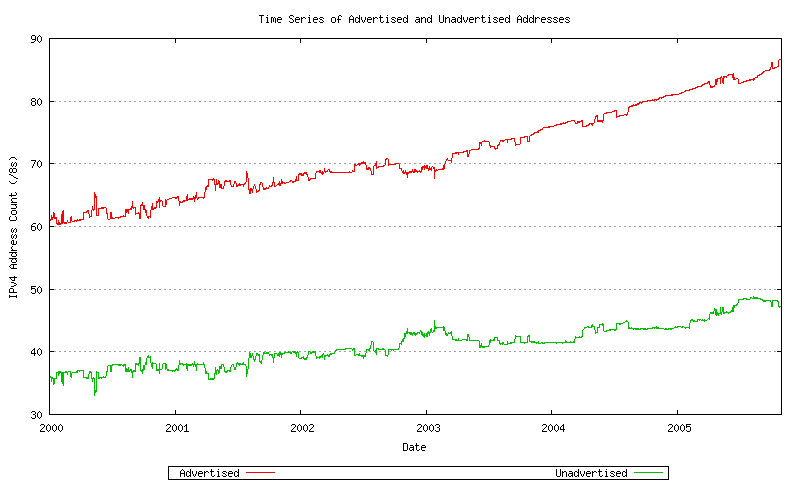
Figure 17 - Advertised and Unadvertised Addresses
The ratio of unadvertised to advertised AS numbers can be plotted over time. This in shown in Figure 18.
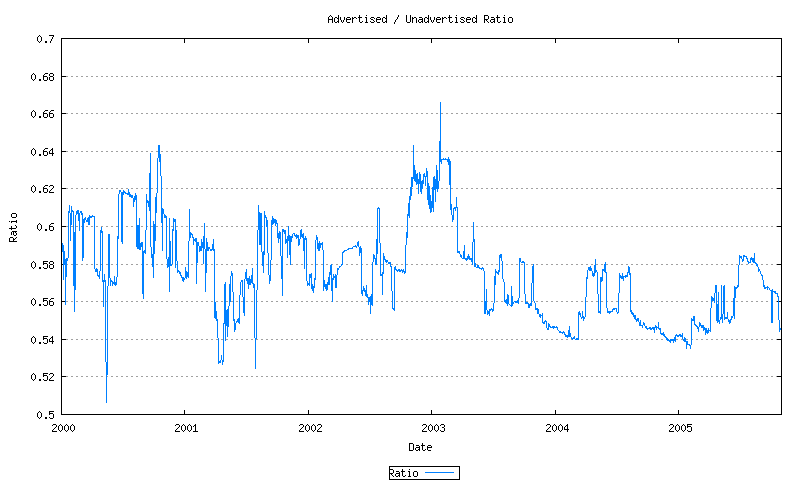
Figure 18 - Advertised / Unadvertised Addresses
Taking the most recent BGP routing table, it is possible to compare the address blocks contained in this routing table with the set of RIR allocations. This allows the construction of a view of advertised address space ordered by the data of the matching RIR allocation (or allocations). All other RIR-allocated address is effectively unadvertised address space, and, similarly, this unadvertised address space can also be ordered according to the RIR allocation date. The total address counts based on the allocation month can then be generated, and a time series of currently advertised and currently unadvertised space according to its allocation 'age' can be generated. This is indicated in Figure 19.
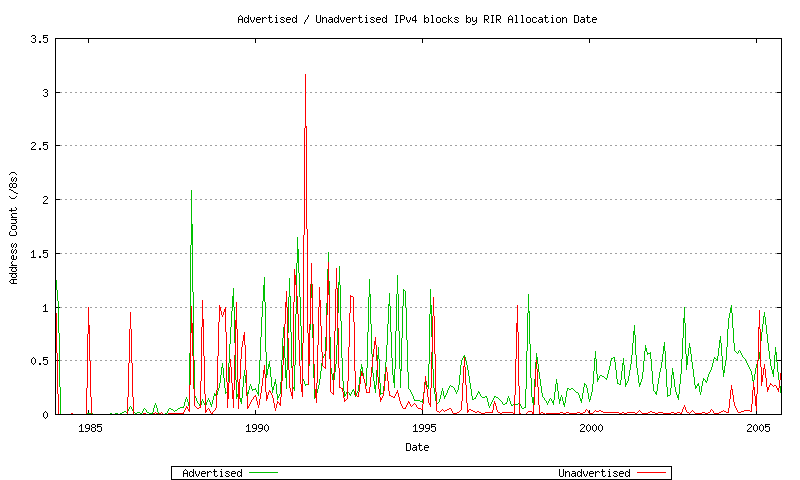
Figure 19 - Advertised / Unadvertised Assignment Series
The data since 2000 is shown in Figure 20.
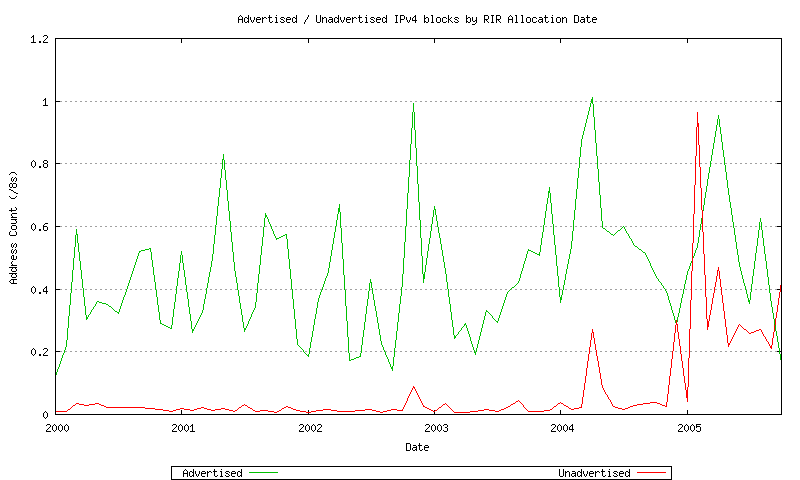
Figure 20 - Advertised / Unadvertised Assignment Series - since 2000
This has been broken down for each RIR: AFRINIC (Figure 21) , APNIC (Figure 22), ARIN (Figure 23), LACNIC (Figure 24) and the RIPE NCC (Figure 25). Also the combined unadvertised series (Figure 26) and the combined advertised series (Figure 27).
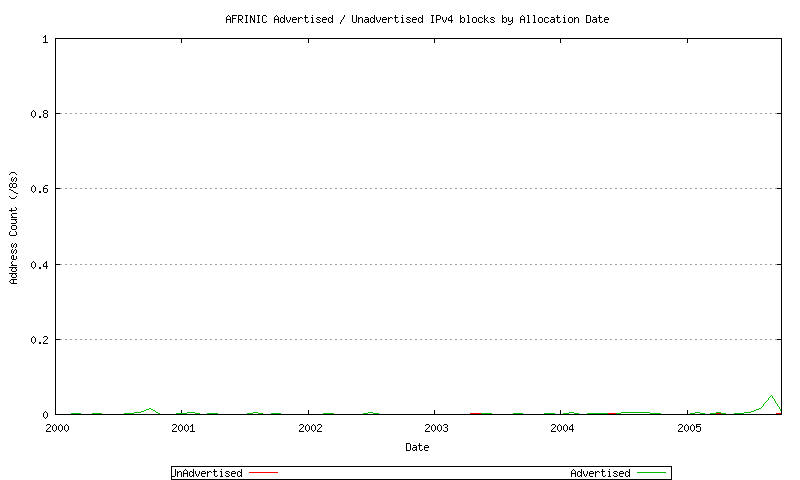
Figure 21 - AFRINIC Advertised / Unadvertised Assignment Series - since 2000
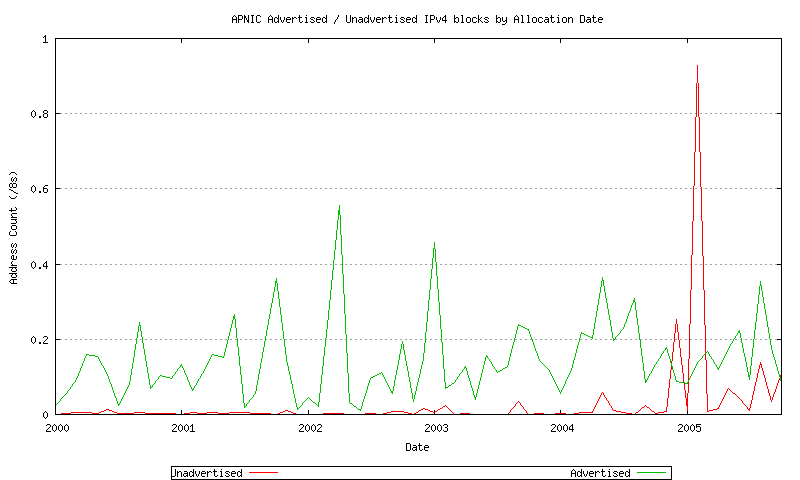
Figure 22 - APNIC Advertised / Unadvertised Assignment Series - since 2000
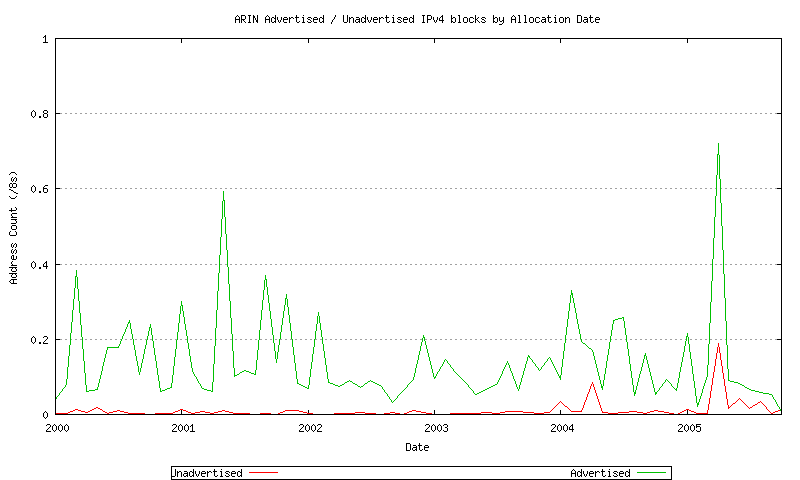
Figure 23 - ARIN Advertised / Unadvertised Assignment Series - since 2000
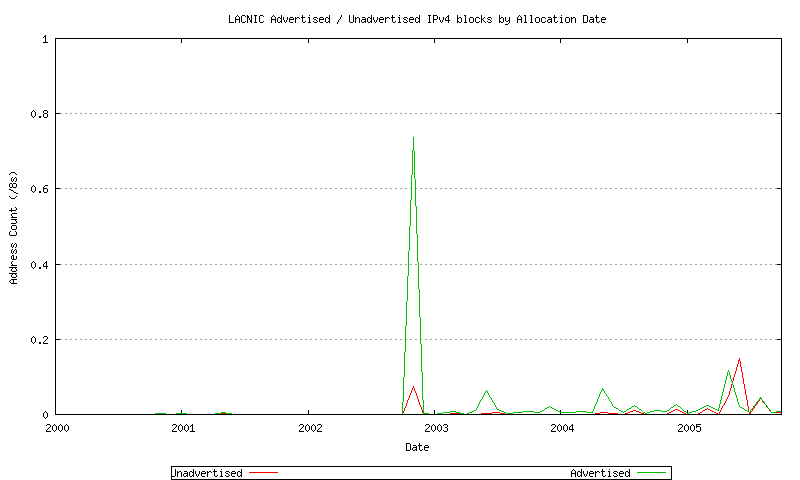
Figure 24 - LACNIC Advertised / Unadvertised Assignment Series - since 2000
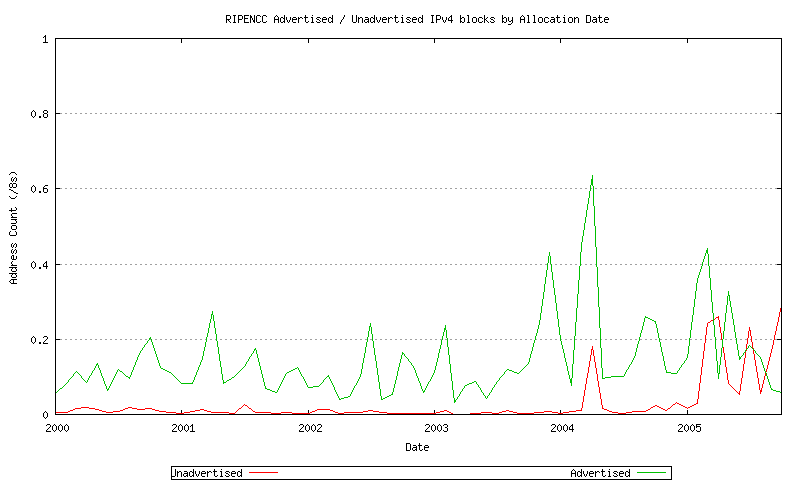
Figure 25 - RIPE NCC Advertised / Unadvertised Assignment Series - since 2000
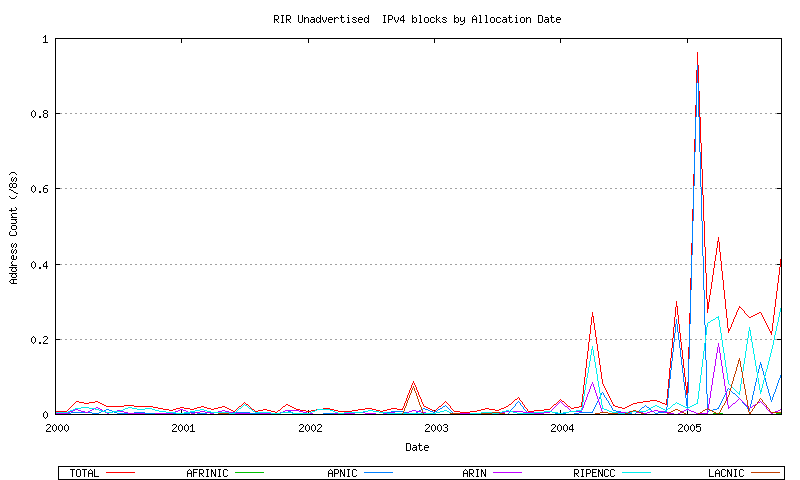
Figure 26 - Combined RIR Unadvertised Assignment Series - since 2000
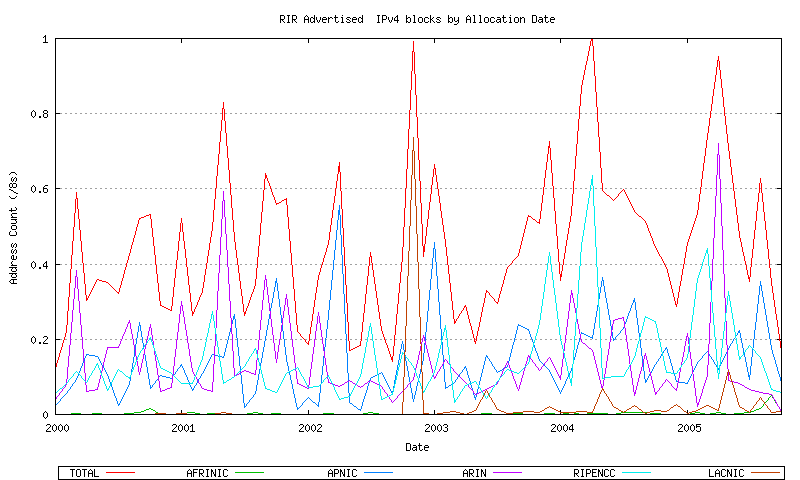
Figure 27 - Combined RIR Advertised Assignment Series - since 2000
Another way of viewing this data is to normalize the aged unadvertised address space value by looking at the aged unadvertised address space as a proportion of the advertised address space for each month. This is shown in Figure 28.
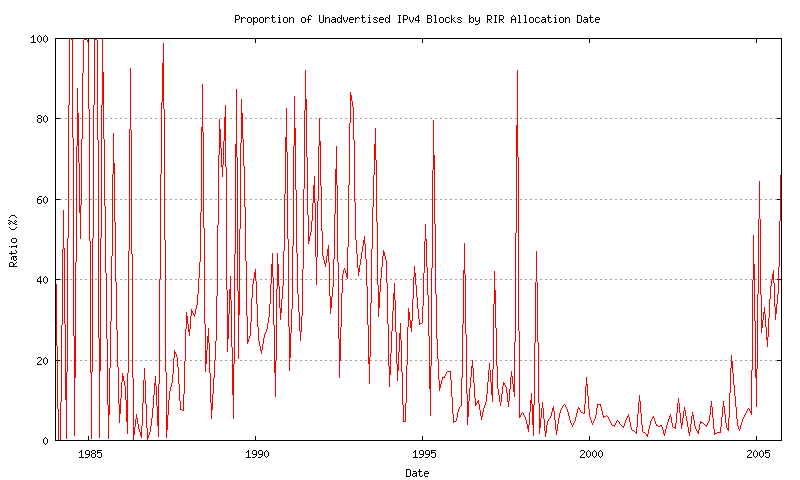
Figure 28 - Unadvertised / Advertised proportion
The data since 2000 is shown in Figure 29.
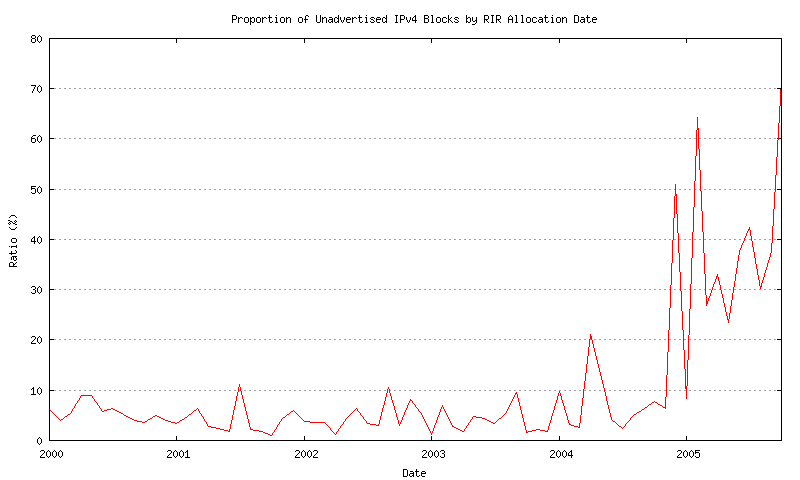
Figure 29 - Unadvertised / Advertised proportion - since 2000
The observation made here is that, with the exception of the most recent allocation intervals, some 90 to 95% of all allocated address space is currently visible in the routing table. This drops to a value of between 50% to 60% for more recently allocated address space.
This observation is used to justify the basic premise behind the predictive exercise, namely that analysis of the advertised address pool and its recent behavior can be a reliable indicator of future address consumption.
Models for Data Series
It is now possible to construct a relatively complete view of the sequences of various address pools, Figure 16 shows the total amount of space allocated by the IANA to the RIRs, the total amount of space that has been allocated by the RIRs, the total amount of space advertised in the routing table, the total amount of unadvertised space that has been allocated, and the total amount of address space that is held in the RIR's local allocation pools. This is indicated in Figure 30. The objective here is to generate a predictive model that can be used to extend these series forward in time in order to estimate a point of exhaustion of the unallocated address pool.
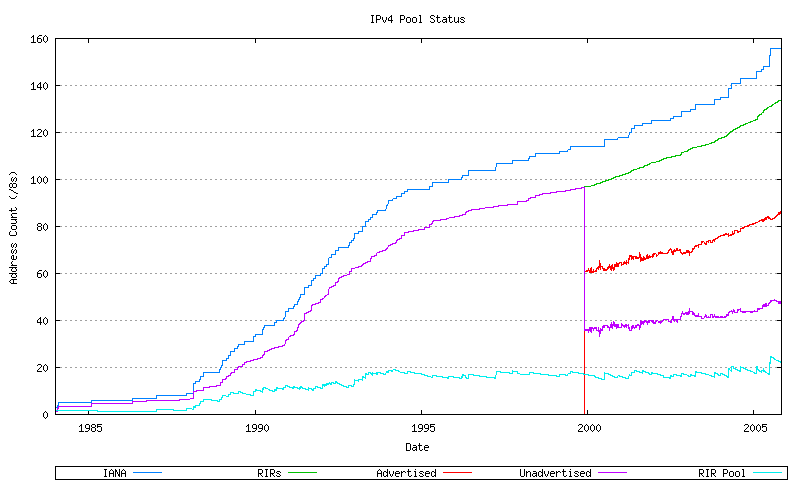
Figure 30 - IPv4 Address Pool Status
The more recent section of these series is indicated in Figure 31. The approach used here is to take a recent sequence of data as the baseline for a predictive model.
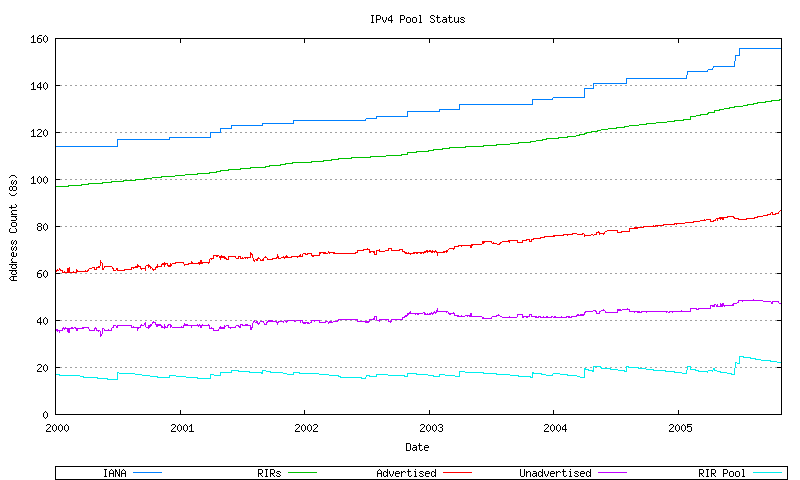
Figure 31 - IPv4 Address Pool Status - since 2000
IANA Data Series
Before looking in detail at the advertised address space, the IANA allocation data and RIR allocation data will be examined, and a relatively straightforward form of data analysis will be performed over the data series.
The IANA allocation data is indicated in Figure 32. This data is shown in both its original format, and in a smoothed format, using a sliding window smoothing algorithm, in a triple pass of the smoothing algorithm across the data.
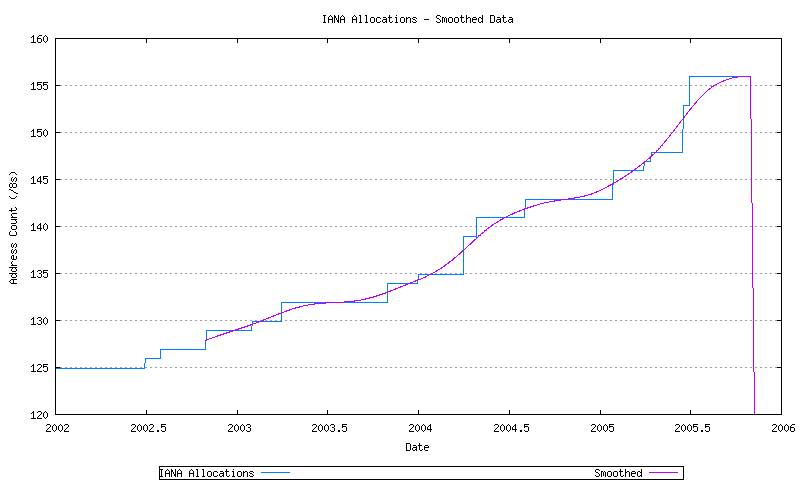
Figure 32 - IANA Allocation Series
Three least squares best fits passes have been performed over the most recent 1200 days of data: a linear best fit, an exponential best fit and a 2nd order polynomial best fit (derived from application of a linear best fit to the first order differential of the data. These are shown in Figure 33.
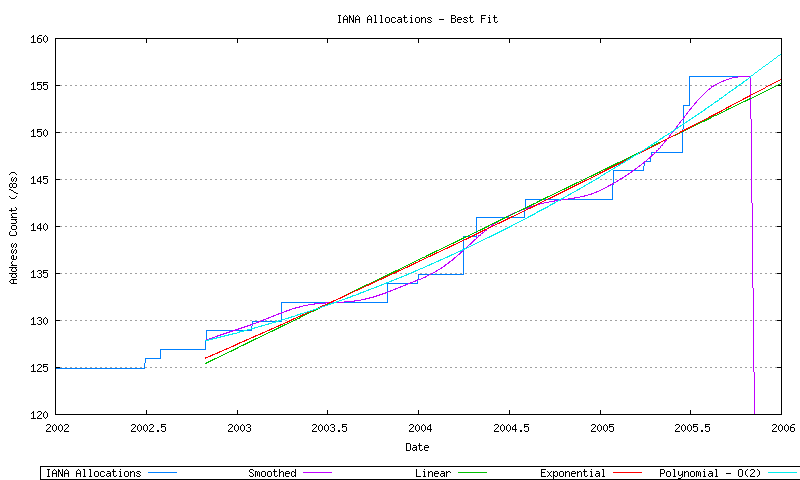
Figure 33 - IANA Allocation Series
It is then possible to take these three best fit data series, and extrapolate their data forward in time until the point where all available address space has been allocated by the IANA and no further unallocated address pool remains. This is shown in Figure 34.
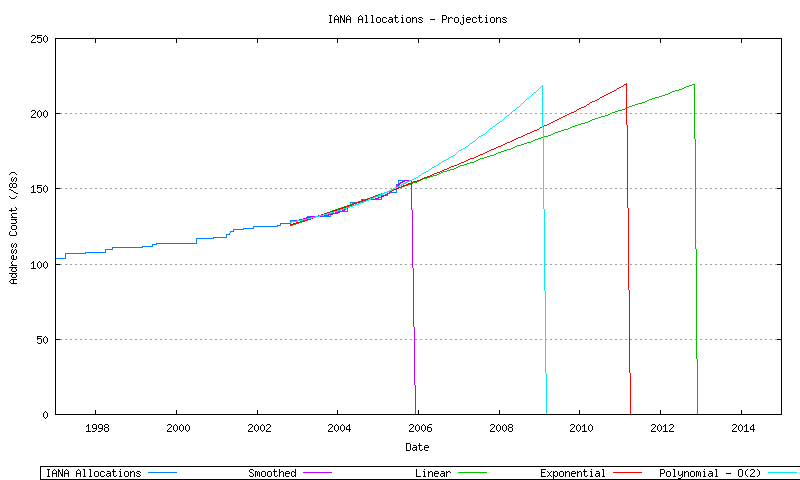
Figure 34 - IANA Allocation Series
RIR Allocations
The RIR allocation data is indicated in Figure 35. This data is shown in both its original format, and in a smoothed format, using a sliding window smoothing algorithm, in a double pass of the smoothing algorithm across the data.
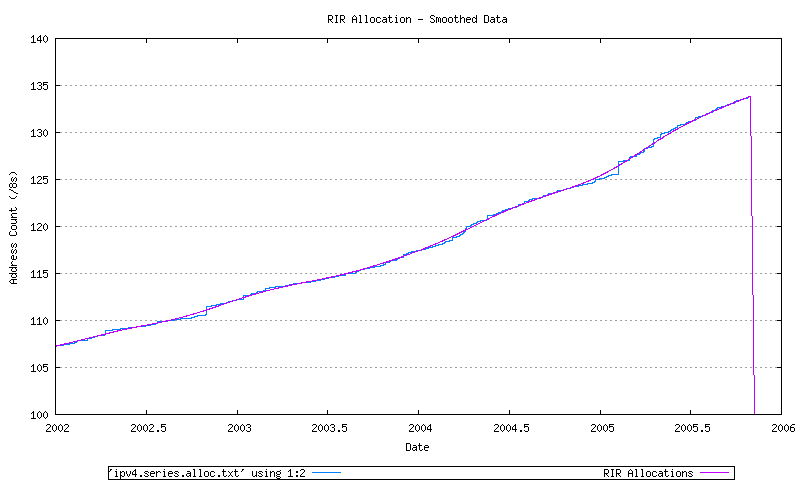
Figure 35 - RIR Allocation Series
Three least-squares best fits passes have been performed over the most recent 1200 days of data: a linear best fit, an exponential best fit and a 2nd order polynomial best fit (derived from application of a linear best fit to the first order differential of the data. These are shown in Figure 36.
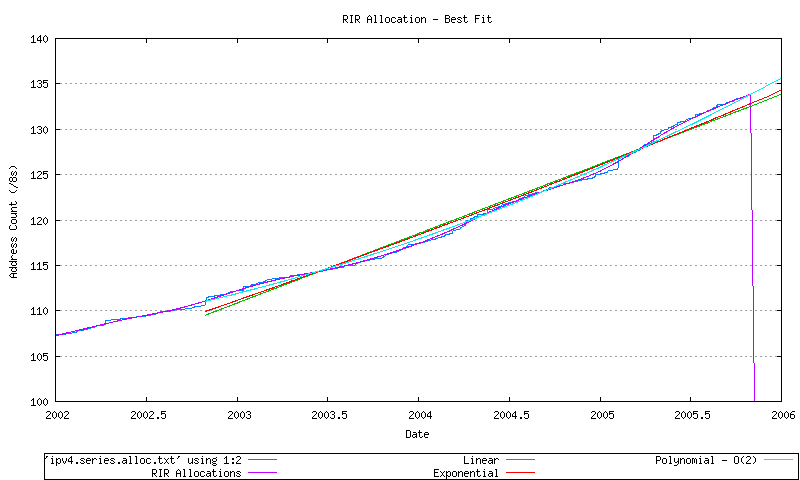
Figure 36 - RIR Allocation Series
It is then possible to take these three best fit data series, and extrapolate their data forward in time until the point where all available address space has been allocated by the RIRs and no further unallocated address pool remains. This is shown in Figure 37.
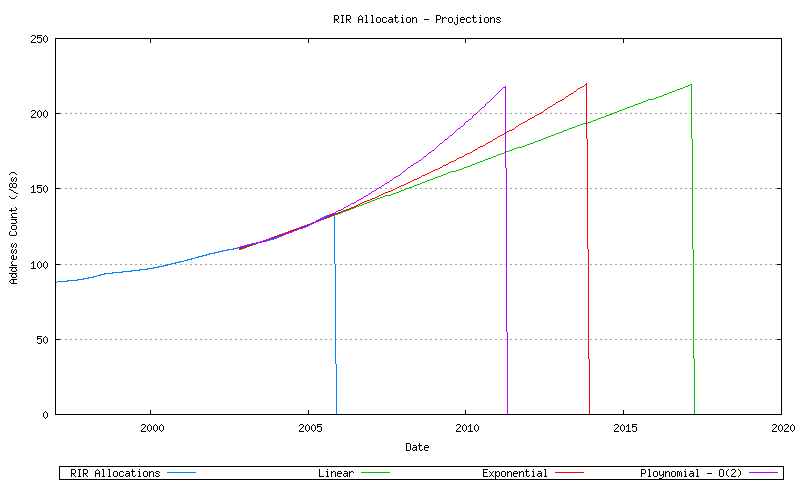
Figure 37 - RIR Allocation Series
BGP Advertised Address Range
The BGP advertised address span data is indicated in Figure 38. This data is shown in both its original format, and in a smoothed format, using a sliding window smoothing algorithm, in a triple pass of the smoothing algorithm across the data.
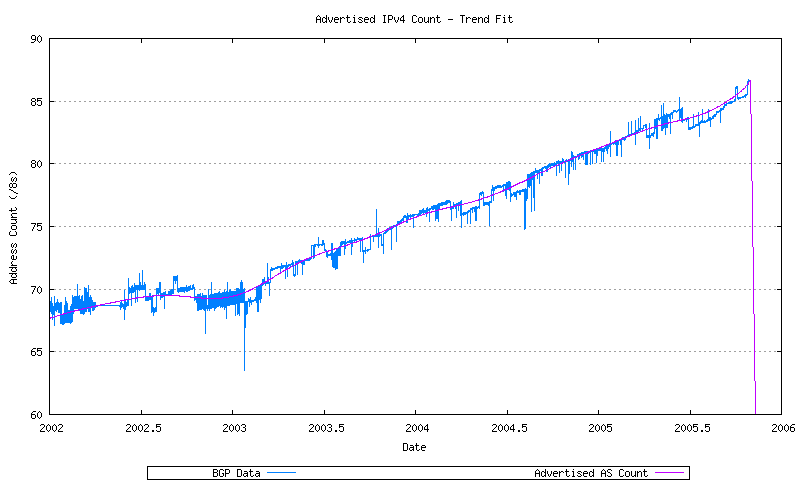
Figure 38 - BGP Advertised Series
Three least-squares best fits passes have been performed over the most recent 1200 days of data: a linear best fit, an exponential best fit and a 2nd order polynomial best fit (derived from application of a linear best fit to the first order differential of the data. These are shown in Figure 39.
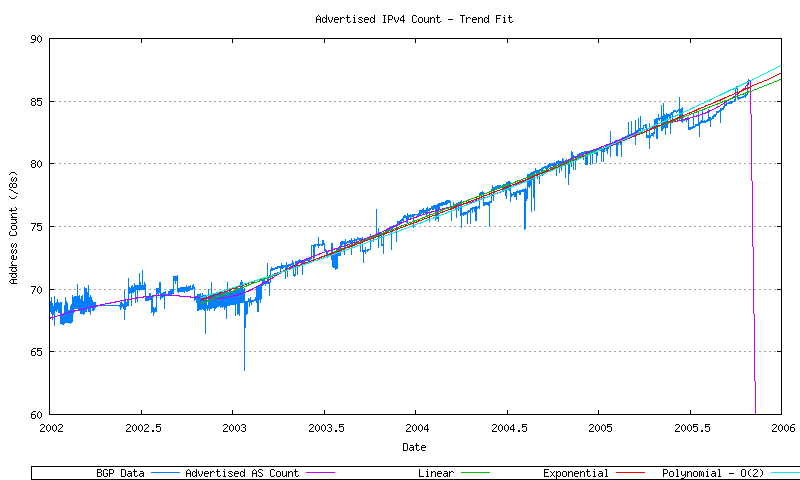
Figure 39 - BGP Advertised Series
It is then possible to take these three best fit data series, and extrapolate their data forward in time until the point where all available address space is advertised in the routing domain no further unallocated address pool remains. This is shown in Figure 40.
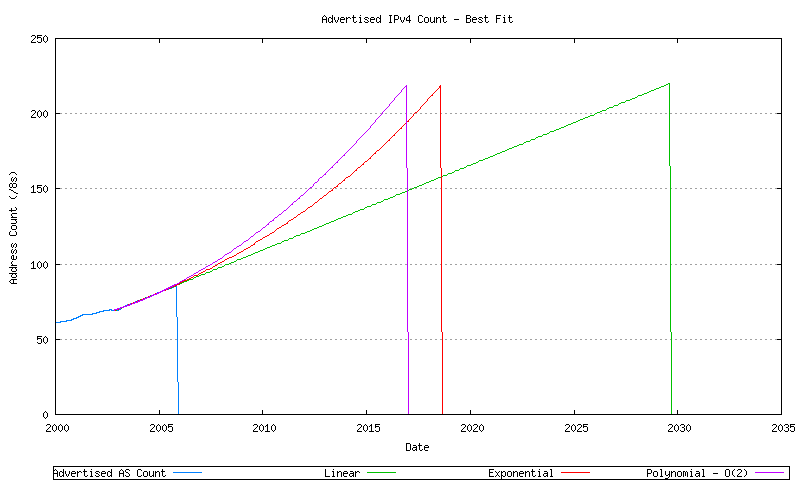
Figure 40 - BGP Advertised Series
Modelling Address Consumption
The final step is to generate a model for address consumption. The model used here is to project forward the number of addresses found in the Internet's BGP table (advertised addresses), and also model the best fit projection of the ratio of unadvertised to advertised addresses. These two series will allow the projection of the total assigned address pool. Together with a model of the behavior of the RIR address pool, a complete address consumption model can be generated.
Modelling Advertised Addresses
The decision to use the advertised address data series as the baseline for the consumption model is based on the observation that the majority (some 95% on average) of recently allocated addresses are advertised in the Internet's routing system (as indicated in Figure 15).
The next step is to model the advertised AS number count. The first step is to take the daily average advertised address span and apply a sliding window smoothing function The next step is to apply a number of potential data models to the smoothed data. This is shown in Figure 41, using a linear model (y = ax + b), an exponential model (y = eax + b) and an order-2 polynomial model (y = ax2 + bx + c).
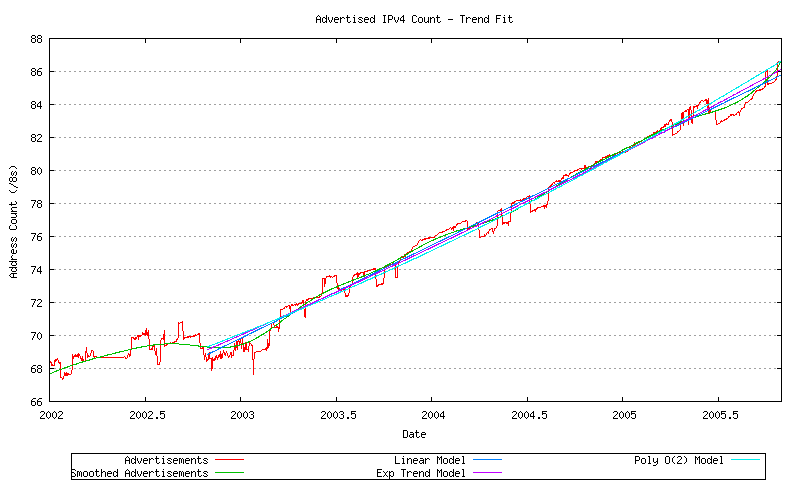
Figure 41 - Advertised Address Series - Fit to Data
The correlation of each of these models to the smoothed data is shown in Figure 42.
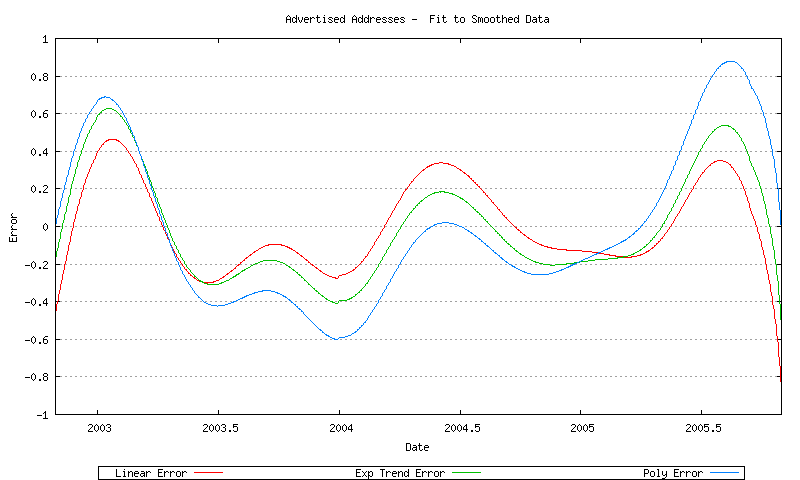
Figure 42 - Error of Best Fit models to smoothed data
The correlation of each of these models to the unsmoothed data is shown in Figure 43.
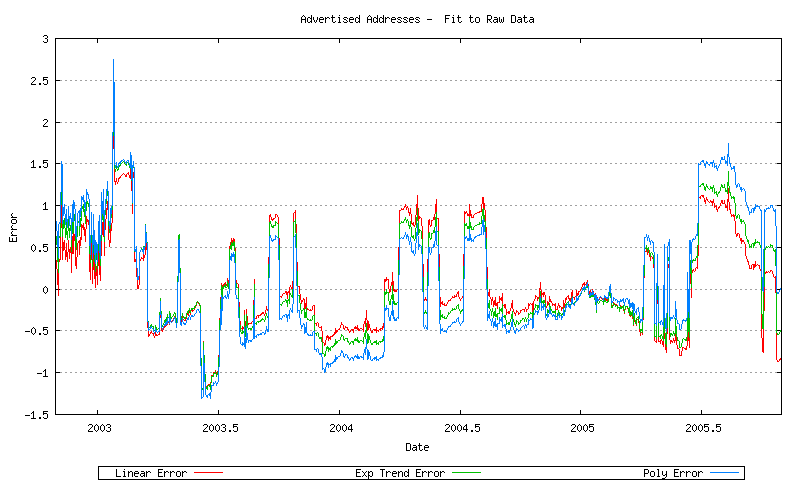
Figure 43 - Error of Best Fit models to raw data
The choice of a lowest error model can be illustrated by examining the first order differential of the advertised address space. This first order differential, and the associated least squares linear best fit, is shown in Figure 44.
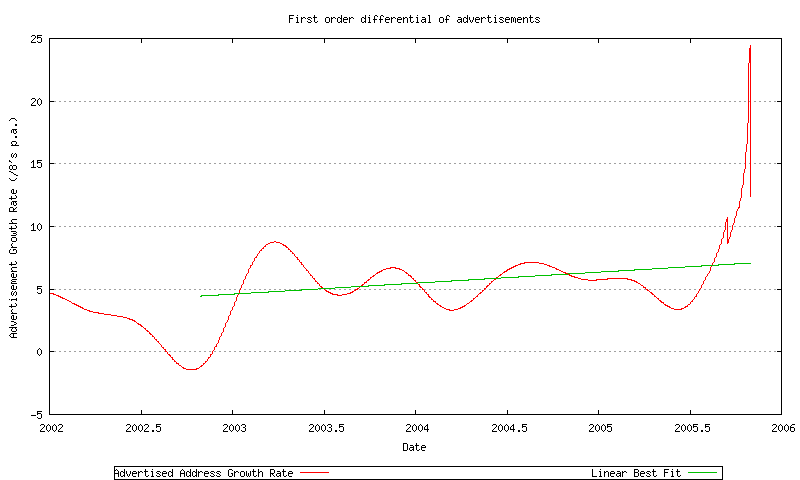
Figure 44 - First order differential of advertised address span
The rate of growth is increasing, which suggests that a linear trend model is not a good fit to the data, and possibly an 2nd order polynomial would be a better fit to the data (if d(f(x))/dx = ax + b then f(x) = a/2 * x2 + bx + c).
Another possibility is an exponential fit to the data, suggesting that the rate of growth is a geometric progression. In this case the first order differential of the log of the data will provide the exponential function. This is shown in Figure 45. The best fit model of the first order differential is very close to constant, suggesting that the best fit exponential model is f(x) = eax + b.
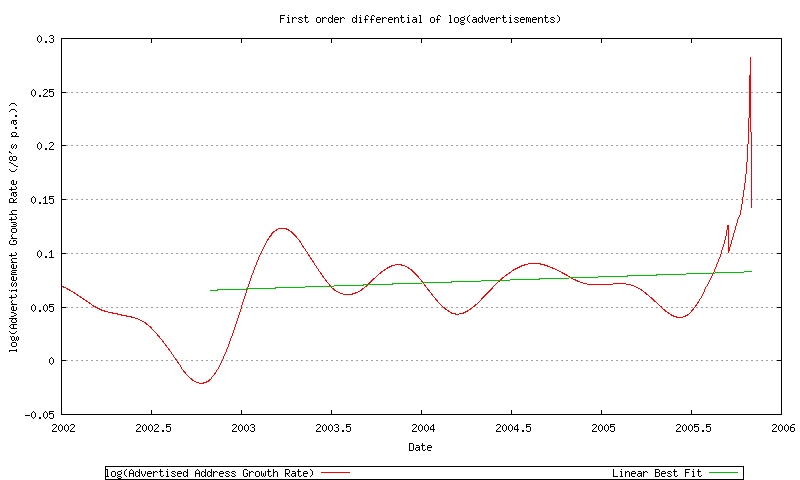
Figure 45 - First order differential of the log of advertised address span
This exponential model will be used for the advertised address projection.
Unadvertised Addresses
The approach taken here is to model the size of the unadvertised address pool as a proportion of the advertised address pool size. Figure 46 shows the three steps of this process; namely generating the sequence of the ratio of the size of the unadvertised address pool to the size of the advertised address pool, then applying a sliding window average function to smooth the data, and then generating a model for this ratio that is derived from application of a least squares linear best fit to the data. The negative trend of this best fit provides a model that the unadvertised address pool is growing at a slower rate than the advertised address pool.
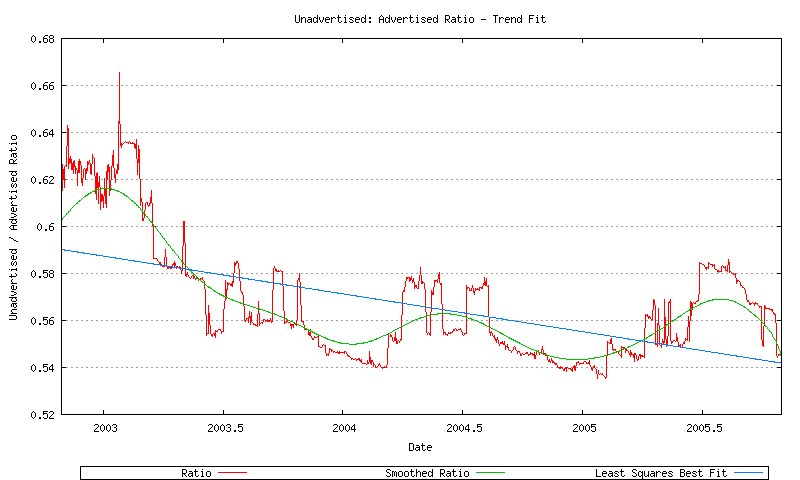
Figure 46 - Unadvertised Ratio Series
Modelling RIR behavior
The next step in this exercise is to model the relative rate of allocations from each of the RIRs in order to predict both the time when the last IANA allocation would be made, and the time when an RIR unallocated address pool will be exhausted.
Given that we have now defined models for the advertised and unadvertised address spaces, then the RIR allocation rate is the first order differential of the sum of these two address pools. However while the total RIR allocation rate can be derived in this way, the model also requires modelling of the relative rate of allocation for each RIR. In order to model this the first step is to extract the historical RIR allocations over time. (It should be noted that over time the number of regional Internet registries has grown, and older allocations that were made into the region where a RIR was subsequently established have been transferred to the relevant RIR, with the original dates intact. The data contains allocations made in the APNIC, LACNIC and AFRINIC regions prior to the establishment of these RIRs.) This allocation data series is shown in Figure 47.
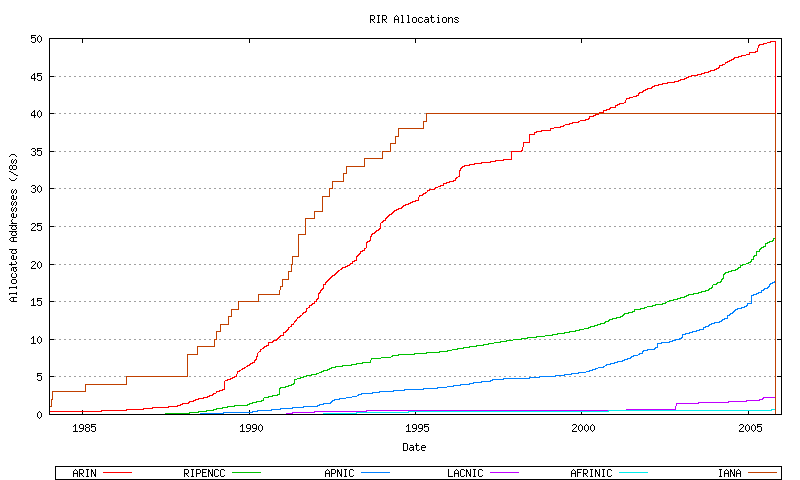
Figure 47 - RIR Allocations
The technique here is firstly look at the first order differential of the smoothed data, and then to apply an appropriate smoothing function to each RIR data series, apply a best fit using an exponential function, and then projecting this forward. The first order differentials for this allocation data is indicated for AFRINIC (Figure 48), APNIC (Figure 49) ARIN (Figure 50), LACNIC (Figure 51) and the RIPE NCC (Figure 52), and the combined view (Figure 53).
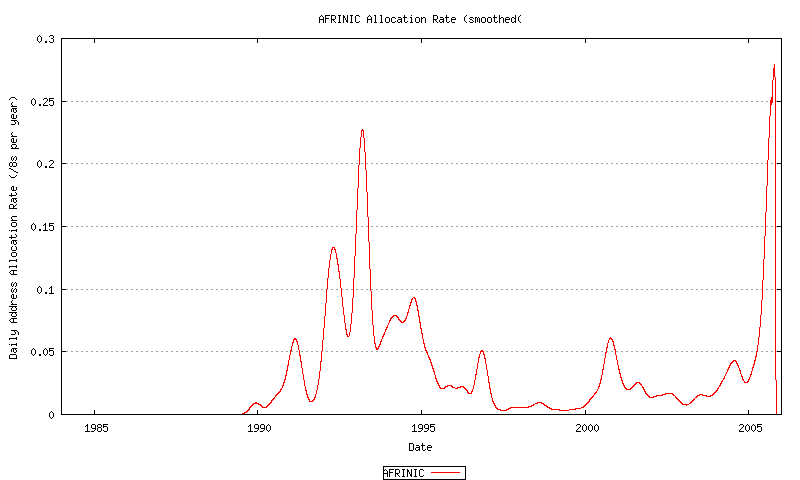
Figure 48 - AFRINIC Address Allocation Rate
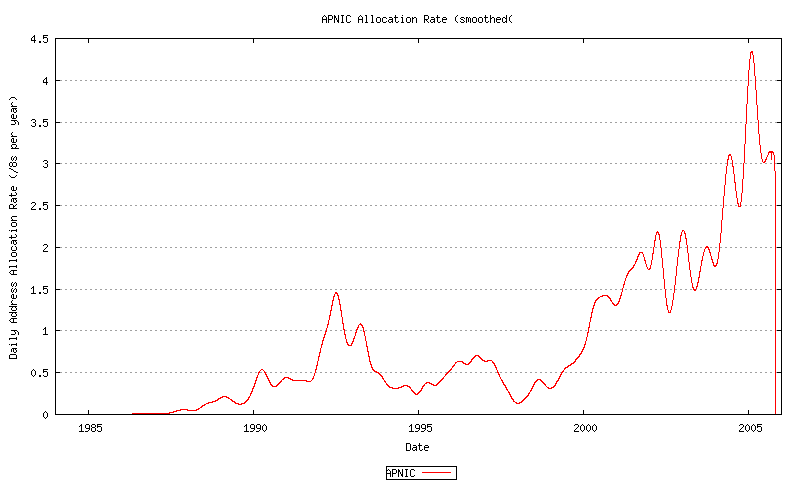
Figure 49 - APNIC Address Allocation Rate
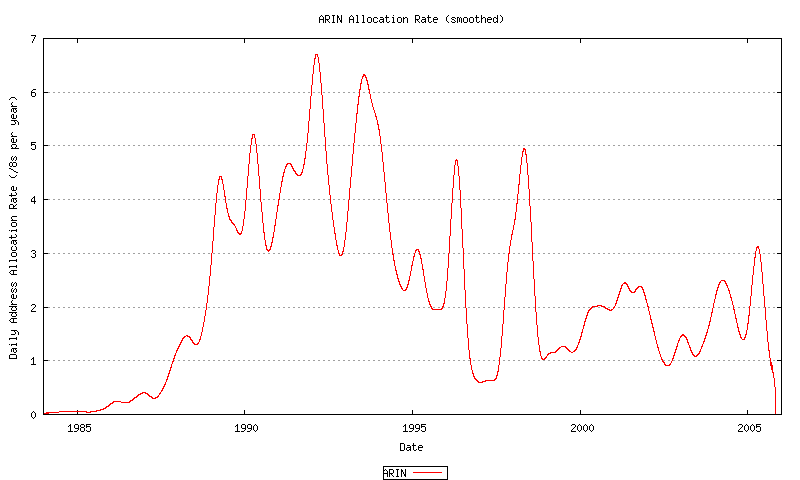
Figure 50 - ARIN Address Allocation Rate
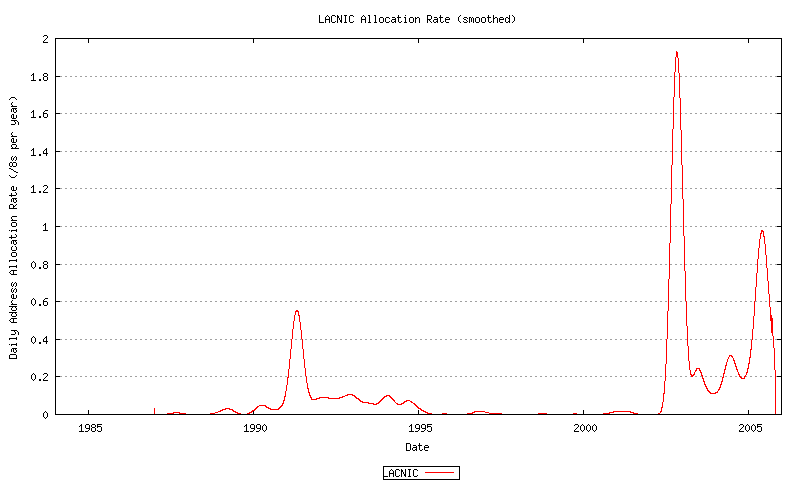
Figure 51 - LACNIC Address Allocation Rate
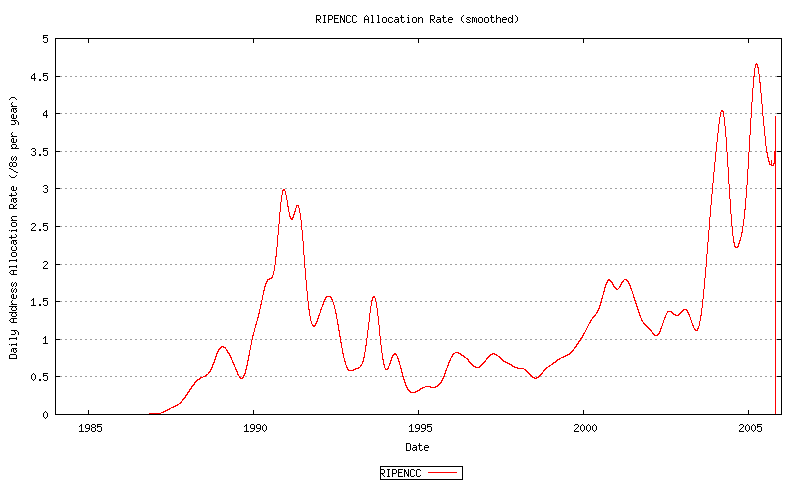
Figure 52 - RIPE NCC Address Allocation Rate
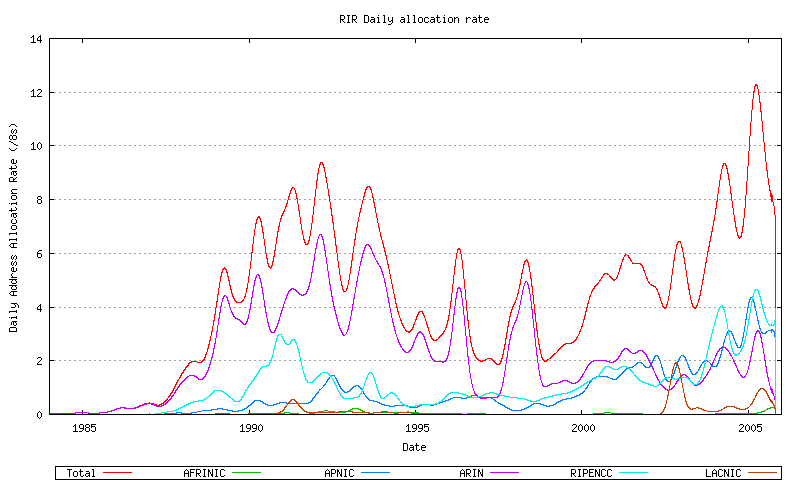
Figure 53 - Combined Address Allocation Rate
None of these allocation rate sequences, either individually for each RIR, appears to be a uniform linear rate. While there are considerable variations in this data, both historically over the extended two decade period and over the recent 3 years, it appears that some form of non-linear growth model is appropriate. The best fit model used in this exercise to model relative RIR allocation rates is that of an exponential growth model based on a linear best fit to the logarithm of the sequence data. This is shown for AFRINIC (Figure 54), APNIC (Figure 55) ARIN (Figure 56), LACNIC (Figure 57) and the RIPE NCC (Figure 58), and the combined view (Figure 59).
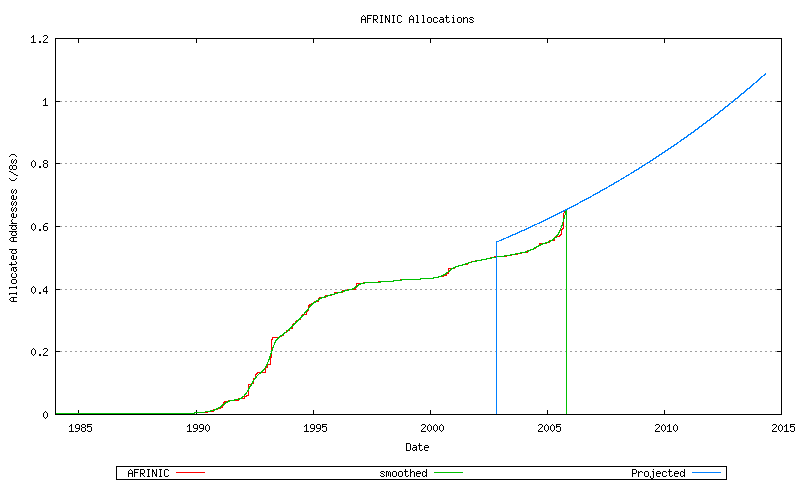
Figure 54 - AFRINIC Address Allocations
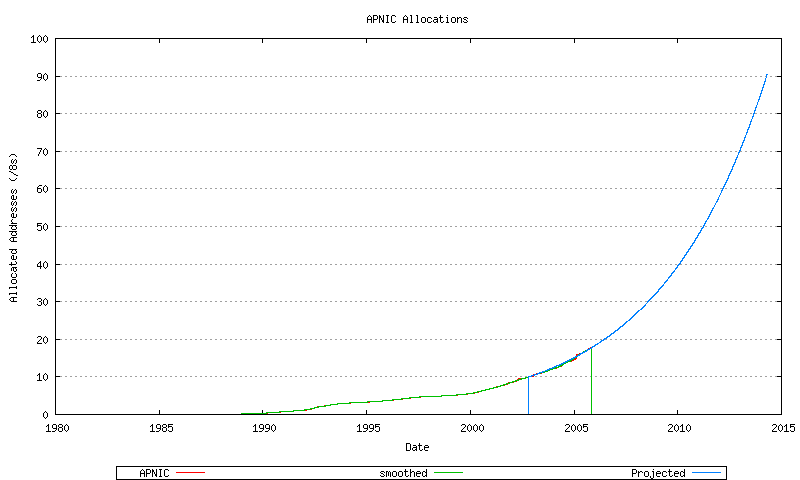
Figure 55 - APNIC Address Allocations
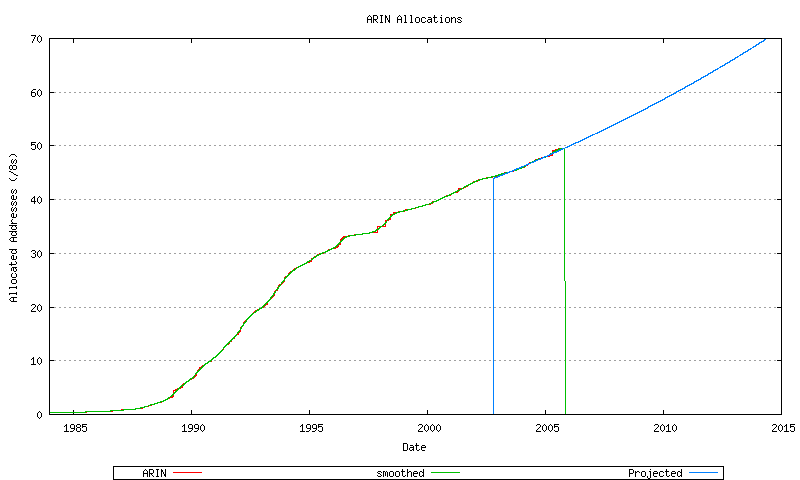
Figure 56 - ARIN Address Allocations
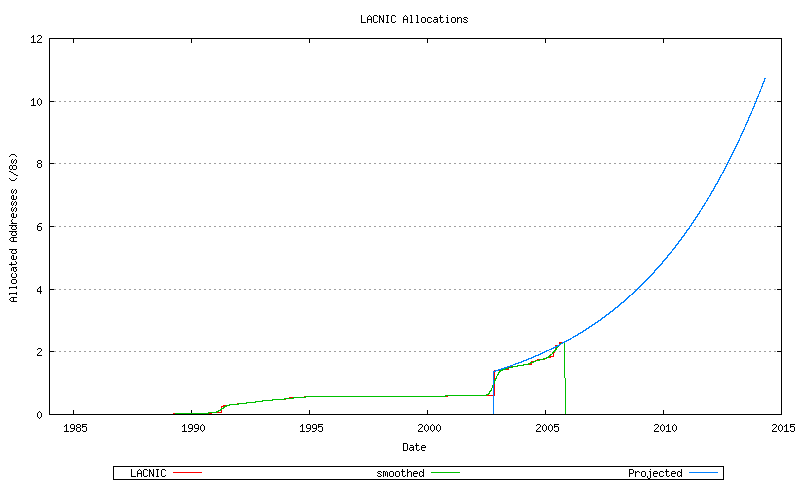
Figure 57 - LACNIC Address Allocations
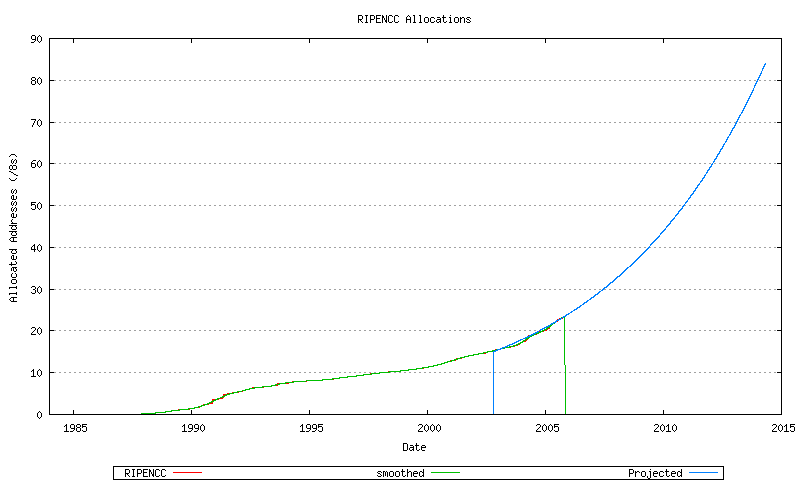
Figure 58 - RIPE NCC Address Allocations
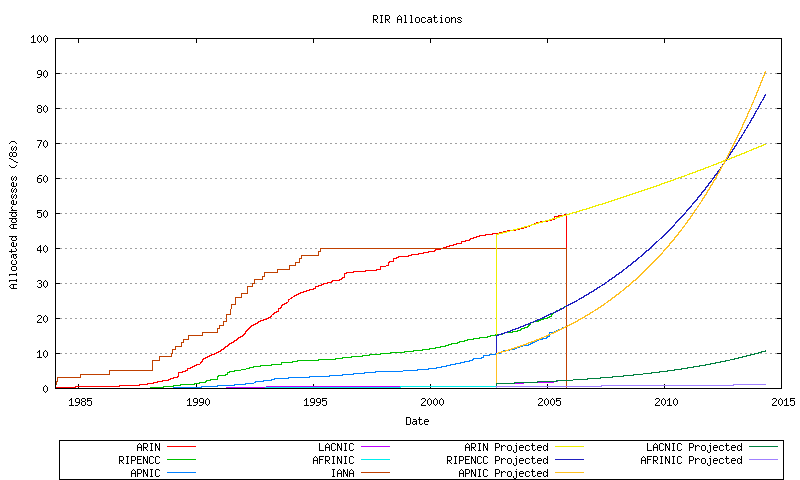
Figure 59 - Combined Address Allocations
The slope of these projections can be compared to each other, and a relative allocation proportion can be derived for each RIR. From this is it now possible to divide up the total address demand from the growth in advertised and unadvertised address pools across each RIR, and apportion this to each RIR according to the relative allocation rates shown in Figure 28. In other words, if a certain address span was allocated by the RIRs in a given month then how much of that span would be allocated by AFRINIC, APNIC, etc?. The relative allocation rates are shown for all the RIRs in Figure 60, and for AFRINIC (Figure 61), APNIC (Figure 62) ARIN (Figure 63), LACNIC (Figure 64) and the RIPE NCC (Figure 65).
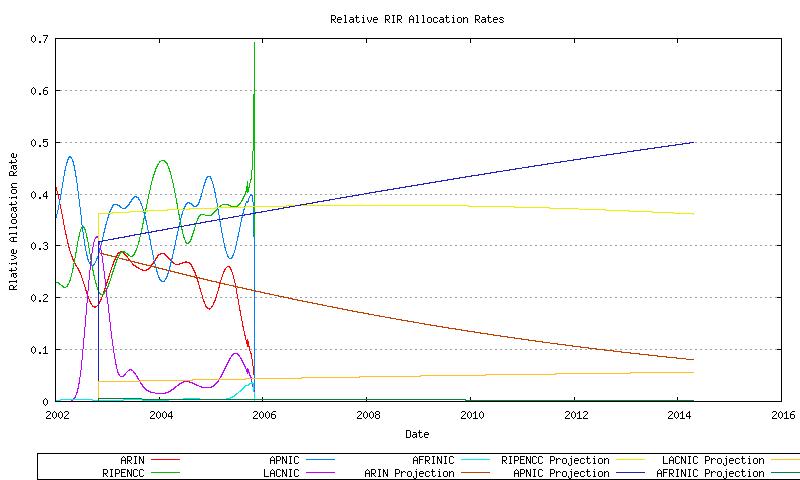
Figure 60 - Relative RIR Allocation rates
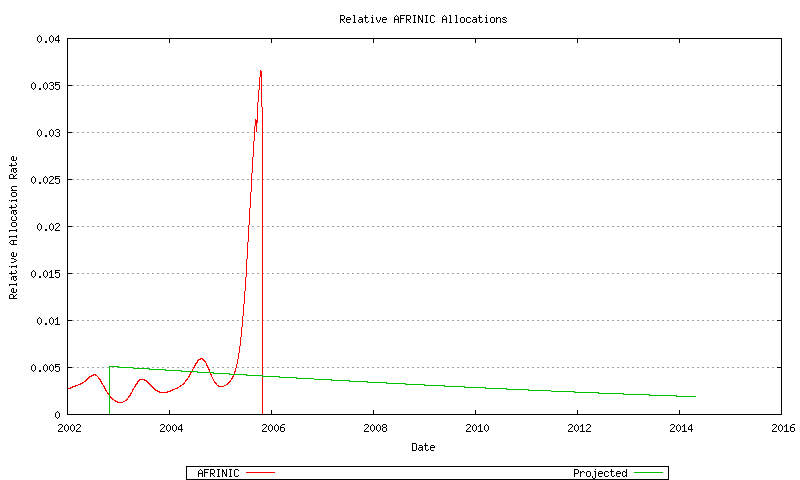
Figure 61 - AFRINIC Relative Address Allocation Rate
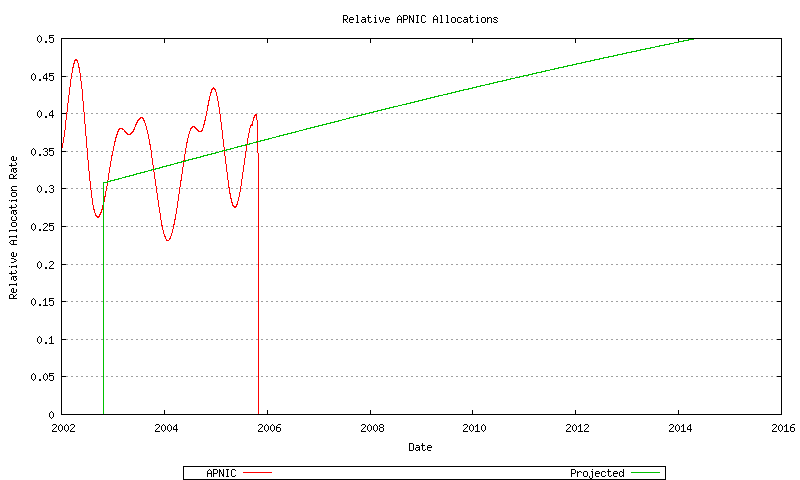
Figure 62 - APNIC Relative Address Allocation Rate
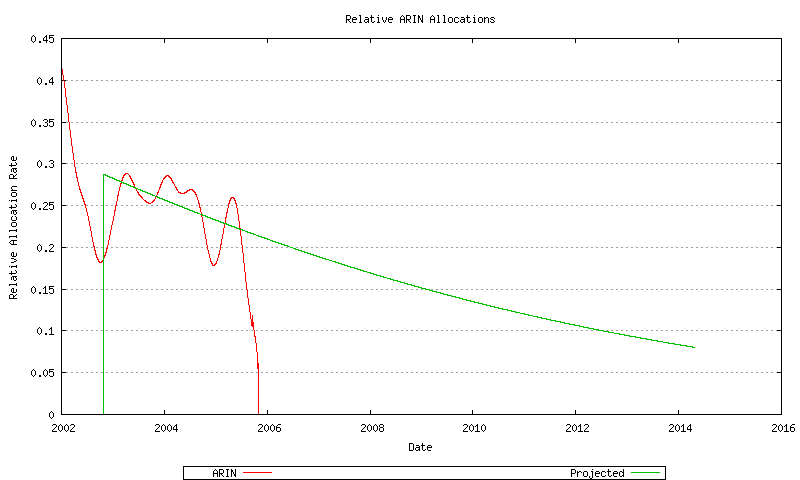
Figure 63 - ARIN Relative Address Allocation Rate
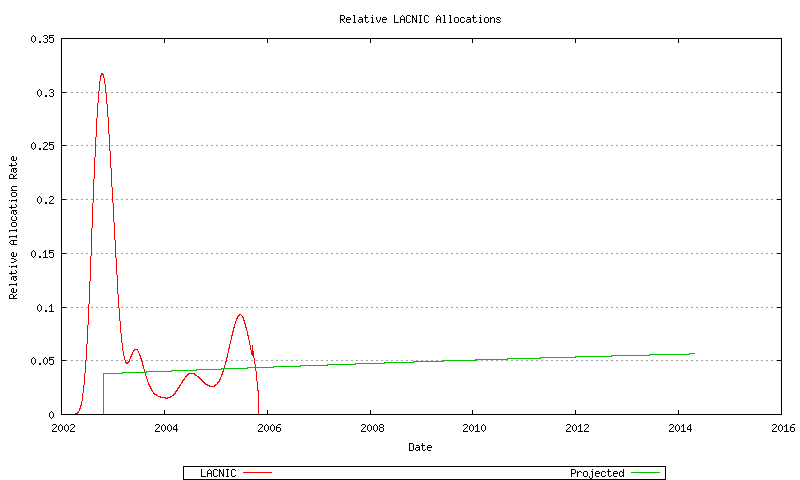
Figure 64 - LACNIC Relative Address Allocation Rate
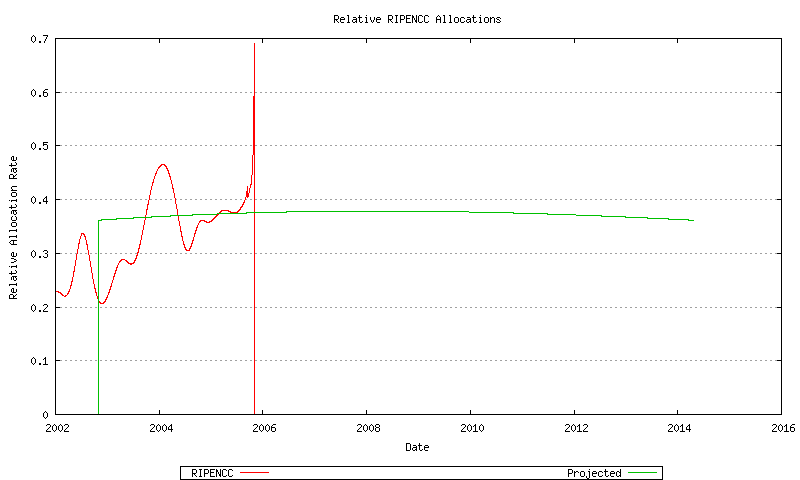
Figure 65 - RIPE NCC Relative Address Allocation Rate
By looking at historical data it is also possible to model for each RIR a "low threshold" point for the RIR's unallocated address pool. When the RIR's unallocated address pool falls to this level it will request a further allocation of address blocks from IANA. The amount requested in this model is the lesser of 3 /8 address blocks and the cumulative sum of the RIR's address allocations over the previous 18 months. The model also assumes that the remainder of the address pool currently marked by the IANA as "Various" will not be used for further allocations until the IANA unallocated pool is exhausted. This overall model is indicated in Figure 66. This is also shown for AFRINIC (Figure 67), APNIC (Figure 68) ARIN (Figure 69), LACNIC (Figure 70), the RIPE NCC (Figure 71), and the "Various" address pool (Figure 72).
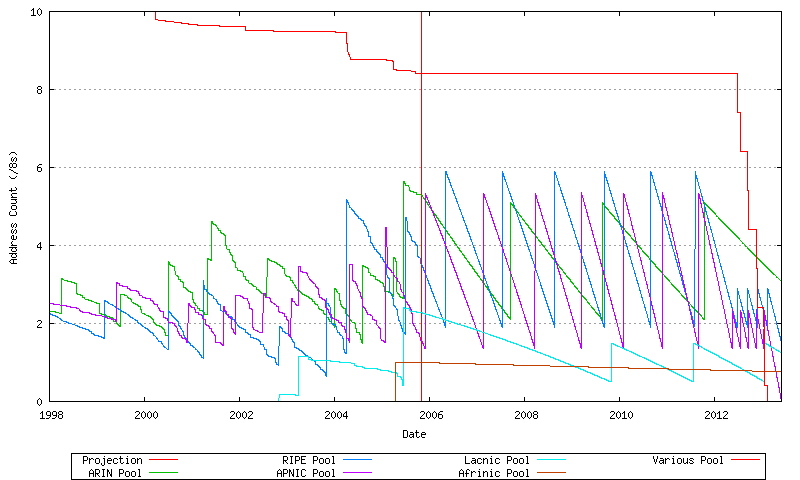
Figure 66 - Projected Address Allocations
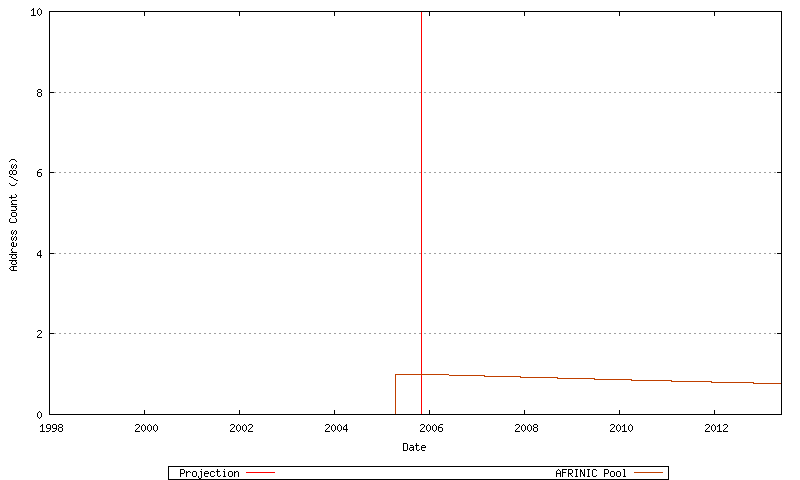
Figure 67 - AFRINIC Projected Address Allocations
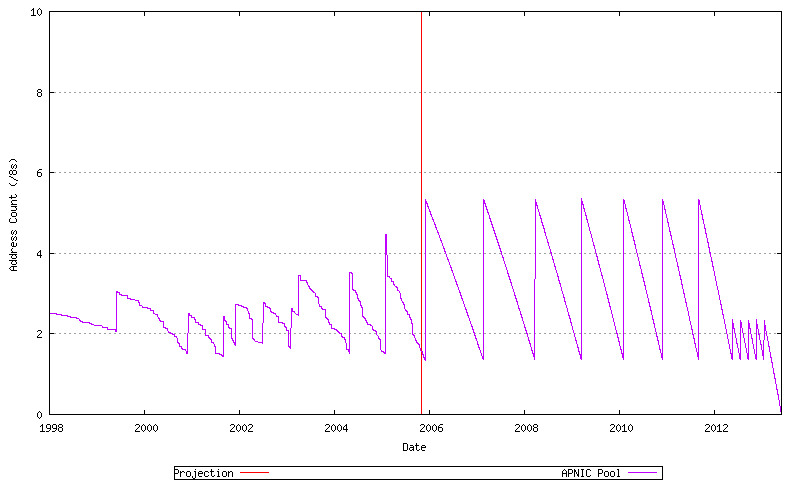
Figure 68 - APNIC Projected Address Allocations
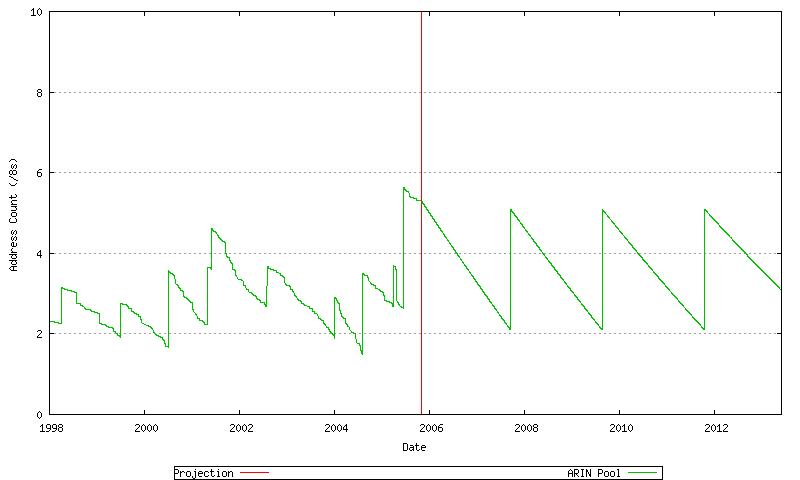
Figure 69 - ARIN Projected Address Allocations
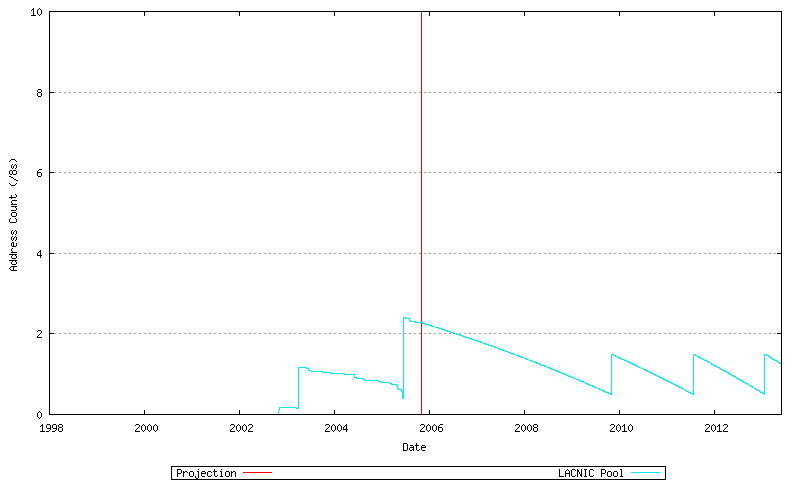
Figure 70 - LACNIC Projected Address Allocations
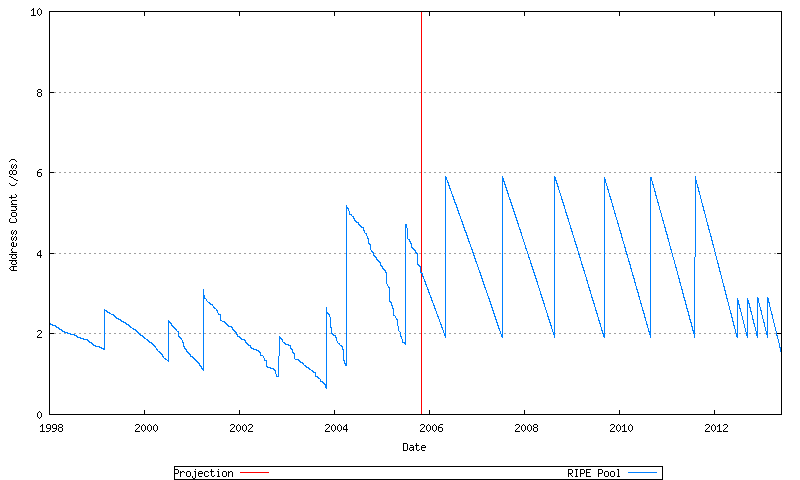
Figure 71 - RIPE NCC Projected Address Allocations
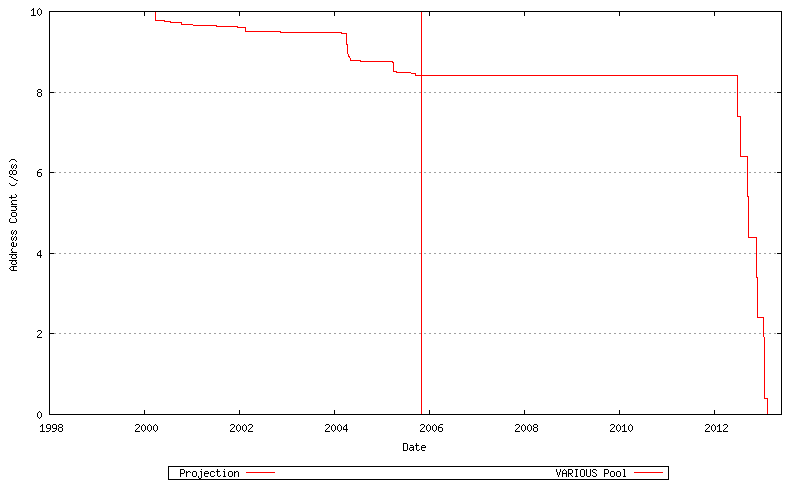
Figure 72 - VARIOUS Pool - Projected Address Allocations
These individual RIR pool behaviours can be summed, as shown in Figure 73. Each upward movement in the RIR Pool series represents an IANA allocation to one of the RIRs, while the downward movement represents the cumulative address allocation rate across the RIR system.
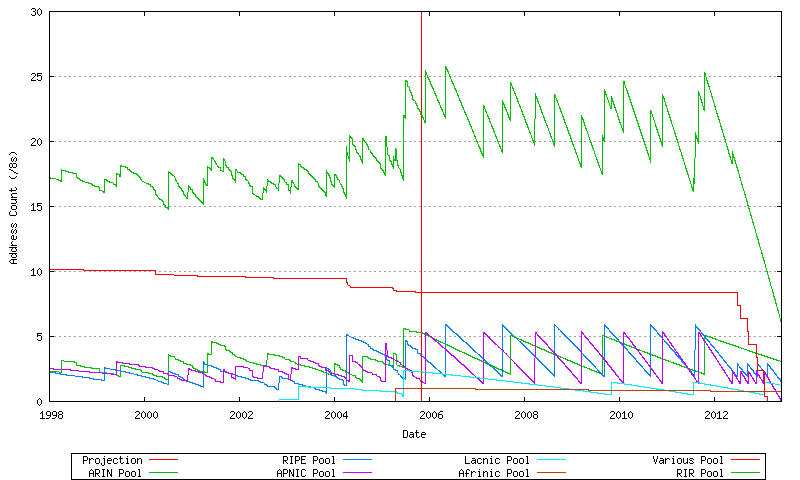
Figure 73 - Projected Address Allocations
The Address Consumption Model
It is now possible to put the components together into a complete model.
The first is the projection of the advertised address span, which uses an exponential growth model. This is shown in Figure 74.
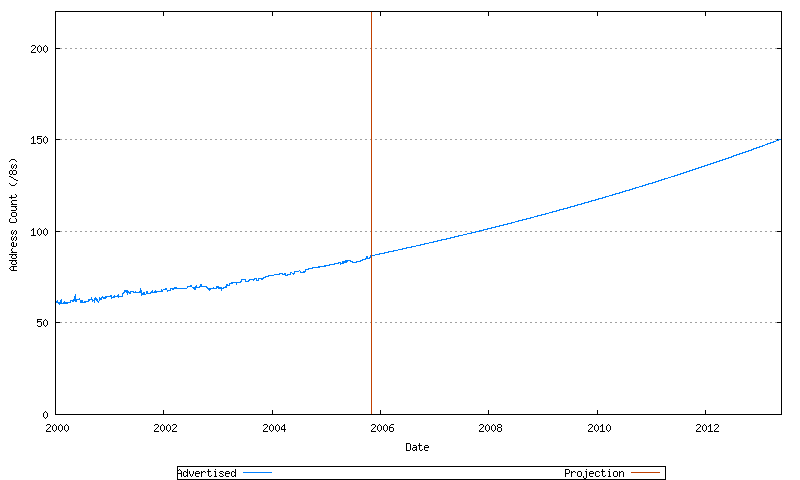
Figure 74 - Projected Advertised Address Span (/8s)
To this can be added the projected unadvertised address span, which is modelled as a slower exponential growth series. This is shown in Figure 75.
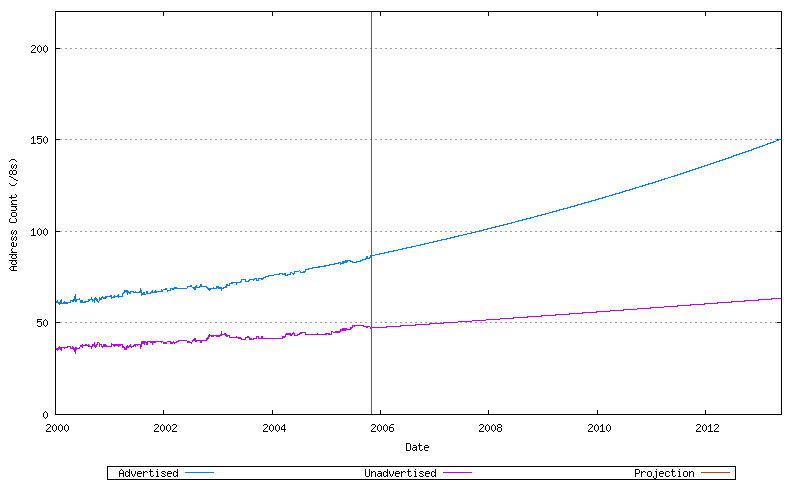
Figure 75 - Projected Advertised and Unadvertised Address Span (/8s)
The total address demand is the sum of these two address pools. This is shown in Figure 76.
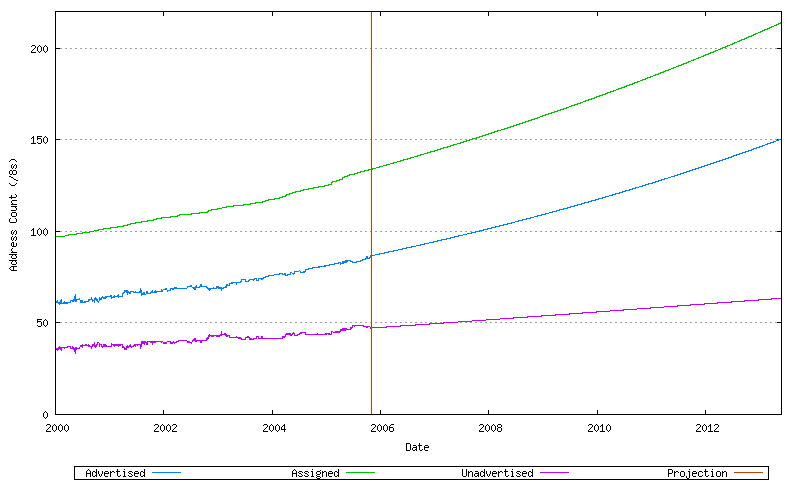
Figure 76 - Projected Address Consumption (/8s)
The RIR behavior to meet this demand rate can be added to this model, together with the demands on the IANA unallocated address pool, as shown in Figure 77.
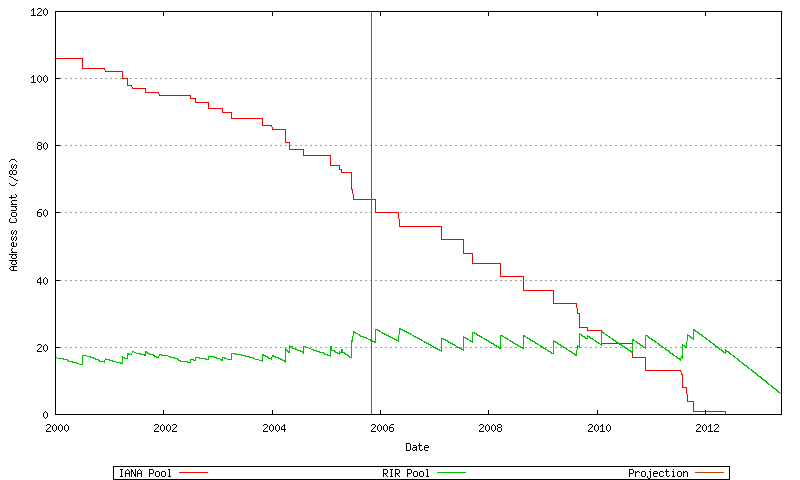
Figure 77 - Projected RIR and IANA Consumption (/8s)
These components can be combined to create an overall model of address consumption, as shown in Figure 78.
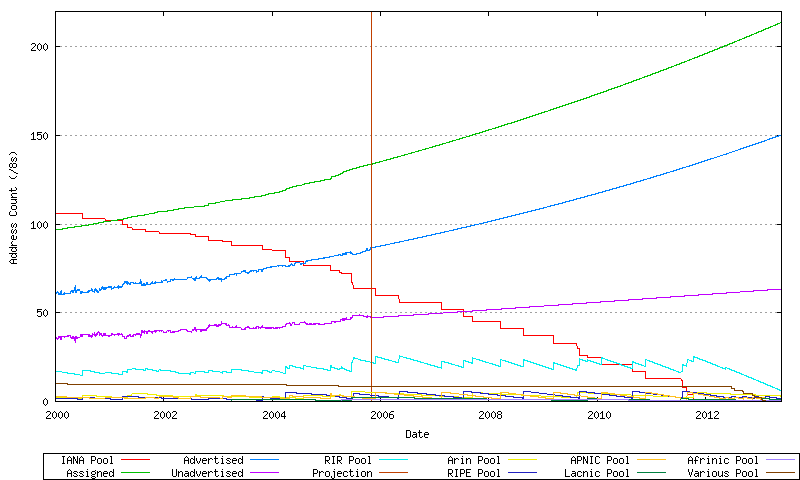
Figure 78 - Address Consumption Model
Here the exhaustion point is the date where the first RIR has exhausted its available pool of 2-byte AS numbers, and no further numbers are available in the IANA unallocated pool to replenish the RIR's pool. The data available suggests a best fit predictive model where this will occur on 27-May-2013.
A related prediction is the exhaustion of the IANA unallocated number pool, which this model predicts will occur on 12-May-2012.
Further Consumption
At this point it appears unlikely that all forms of IPv4 address distribution will cease at the time when the unallocated address pool is exhausted. One possible outcome is that some form of address distribution mechanism may bring the unadvertised address space back into play to fuel further demands for address space in the public IPv4 Internet. Without concern as to precisely what mechanisms may produce such an outcome, the question here is "how many years of additional growth in the advertised public Internet could be sustained if the unadvertised address pool were available for use by the public Internet?" In attempting to pose an answer to this question, the model used here assumes that a pricing function may apply to such addresses, and there would be a strong incentive to use various forms of address compression technologies to maximize the utility of such address blocks. The model used here assumes that the efficiency of the deployed address block would be a little over twice as efficient in such a regime.
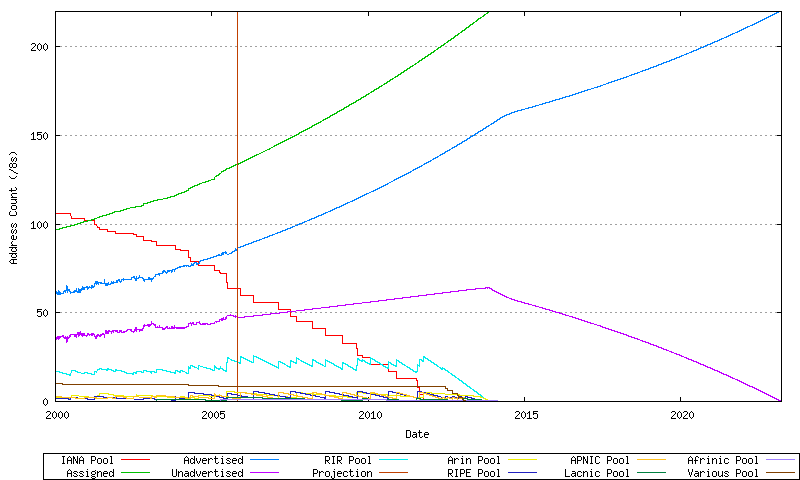
Figure 79 - Projected Consumption of the Unadvertised Address Pool
This particular model predicts that the use of the unadvertised address pool to sustain further growth on the IPv4 public Internet may provide addresses to meet demands until 23-Mar-2023.
How Accurate is this Date?
This work indicates that if current consumption trends continue then some other form of address distribution mechanism will be needed before the IANA unallocated address pool exhaustion date of 12-May-2012, let alone prior to the RIR exhaustion date of 27-May-2013. However this is perhaps a very conservative projection of a date for the exhaustion of the current address allocation policies. Its probable that an industry response to this forthcoming situation is one of increasing levels of demand for the remaining unallocated address resources, given the impetus of a "last chance rush" on the registries. If such a run on the unallocated address pool eventuates, and industry players bring forward their requests for additional address space, it is possible that this unallocated address pool exhaustion date may occur sooner than the model studied would apparently indicate. Such a run is difficult to model from existing data, and this exercise here has not attempted to undertake such forms of modelling of a run on the address pool. About the best we can conclude from this study is that in terms of an agenda for development of address distribution policies, this work supports the proposition that such policy development should start by the end of 2005. There is a clear need for detailed consideration of what are the most appropriate ways to support the continued operation and growth of the Internet when the IPv4 unallocated address pool is exhausted. The response that the global Internet industry will undertake an overnight transition to use IPv6 is perhaps at one somewhat improbable end of a rather broad spectrum of possibilities here.
![]()
Disclaimer
The views expressed are the author’s and not those of APNIC, unless APNIC is specifically identified as the author of the communication. APNIC will not be legally responsible in contract, tort or otherwise for any statement made in this publication.
![]()
About the Author
GEOFF HUSTON B.Sc., M.Sc., has been closely involved with the development of the Internet for many years, particularly within Australia, where he was responsible for the initial build of the Internet within the Australian academic and research sector. He is author of a number of Internet-related books, and has been active in the Internet Engineering Task Force for many years.