| TOC |
|
This document is an Internet-Draft and is subject to all provisions of section 3 of RFC 3667. By submitting this Internet-Draft, each author represents that any applicable patent or other IPR claims of which he or she is aware have been or will be disclosed, and any of which he or she become aware will be disclosed, in accordance with RFC 3668.
Internet-Drafts are working documents of the Internet Engineering Task Force (IETF), its areas, and its working groups. Note that other groups may also distribute working documents as Internet-Drafts.
Internet-Drafts are draft documents valid for a maximum of six months and may be updated, replaced, or obsoleted by other documents at any time. It is inappropriate to use Internet-Drafts as reference material or to cite them other than as "work in progress."
The list of current Internet-Drafts can be accessed at http://www.ietf.org/ietf/1id-abstracts.txt.
The list of Internet-Draft Shadow Directories can be accessed at http://www.ietf.org/shadow.html.
This Internet-Draft will expire on April 19, 2005.
Copyright (C) The Internet Society (2004).
This memo provides an analysis of the Host Density metric as currently used to guide registry allocations of IPv6 unicast address blocks. This document contrasts the address efficiency as currently adopted in the allocation of IPv4 network addresses and that used by the IPv6 protocol. It is noted that for large allocations there are very significant variations in the target efficiency metric between the two approaches. The memo notes that the IPv6 address assignment efficiency metric would benefit from a detailed technical review, particularly relating to large scale deployments of public infrastructure.
1.
Introduction
2.
IPv6 Address Structure
3.
The Host Density Ratio
4.
The Role of an Address Efficiency Metric
5.
Network Structure and Address Efficiency Metric
6.
Varying the HD Ratio
7.
Considerations
8.
Security Considerations
9.
Acknowledgements
10.
Normative References
§
Author's Address
A.
Comparison Tables
B.
Draft Notes
§
Intellectual Property and Copyright Statements
| TOC |
Metrics of address assignment efficiency are used in the context of the public Internet as a part of the address allocation function. Through the use of an address assignment efficiency metric individual networks can be compared to a target model in an objective fashion. The common use of this metric is to form part of the supporting materia for an address allocation request, demonstrating that the network has met the target address efficiency metric and that the allocation of a further address block is justified.
Public IP networks have significant differences in purpose, structure, size and technology. Attempting to impose a single metric across this very diverse environment is a challenging task. Any address assignment efficiency metric has to represent a balance between stating an achievable metric for any competently designed and operated service platform, while not specifying a metric that allows for an address usage rate that imperils the protocol's longer term viability. There are a number of views relating to address assignment efficiency, both in terms of theoretic analyses of assignment efficiency and in terms of practical targets that are part of current address assignment practices in today's Internet.
This document contrasts the address efficiency as currently adopted in the allocation of IPv4 network addresses and that used by the IPv6 protocol. It is noted that for large allocations there are very significant variations in the target efficiency metric.
| TOC |
Before looking at address allocation efficiency metrics it is appropriate to summarize the address structure for IPv6 global unicast addresses.
The general format for IPv6 global unicast addresses is defined in RFC3513 [1]Hinden, R. and S. Deering, Internet Protocol Version 6 (IPv6) Addressing Architecture, April 2003. as follows (Figure 1).
   |         64 - m bits    |   m bits  |       64 bits              |
   +------------------------+-----------+----------------------------+
   | global routing prefix  | subnet ID |       interface ID         |
   +------------------------+-----------+----------------------------+
IPv6 Address Structure
| Figure 1 |
Furthermore, within the current policy framework for allocation of IPv6 addresses in the context of the public Internet, the value for 'm' in the figure above is commonly used as a 16 bit value, such that the global routing prefix is 48 bits in length, the per-customer subnet ID is 16 bits in length and the interface ID is 64 bits in length.
In relating this address structure to the address allocation function, the efficiency metric is not intended to refer to the 128 bit IPv6 address, nor the 64 bit routing prefix, but is limited to the 48 bit global routing prefix. This allocation model assumes that each customer is allocated a minimum of a /48 address block, and, given that this block allows 2**16 possible subnets, it is also assumed that a /48 allocation will be used in the overall majority of cases of end-customer address assignment.
The following discussion makes the assumption that the address allocation unit in IPv6 is an address prefix of 48 bits in length, and the address assignment efficiency in this context is the efficiency of assignment of /48 address allocation units.
| TOC |
The "Host Density Ratio" is first described in RFC 1715 [2]Huitema, C., The H Ratio for Address Assignment Efficiency, November 1994., and subsequently updated in RFC3194 [3]Durand, A. and C. Huitema, The H-Density Ratio for Address Assignment Efficiency An Update on the H ratio, November 2001..
The "H Ratio", as defined in RFC1715, is:
                  log (number of objects)
              H = -----------------------
                     available bits
| Figure 2 |
The RFC draws on a number of examples to support the assertion that this metric reflected a useful measure of address assignment efficiency, and furthermore that the optimal point for such a utilization efficiency metric lies between 0.14 and 0.26
Interestingly, the table in RFC1715, indicating a range of addressed objects for a 64 bit address range was given as between 9 E+8 and 4 E+16, while 128 bits yielded values of 8 E+17 through to 2 E+33. This data was used to support the argument that 64 bits of address space was insufficient. Given that IPv6 is now operating in a mode where the IPv6 address unit is somewhere between 48 and 64 bits in effective length (as distinct from 128, because of the subsequent definition of the interface identifier), there is a somewhat ironic twist to this particular definition of address density..
This metric has a maximal value of log base 10 of 2, or 0.30103.
The metric was 'normalized' in RFC3194, and a new metric, the "HD-Ratio" was introduced, with the definition:
                    log(number of allocated objects)
              HD = ------------------------------------------
                   log(maximum number of allocatable objects)
| Figure 3 |
HD values are directly proportional to the H ratio, and the values of the ratio range from 0 to 1. The RFC then applied this HD-Ratio metric to the examples given in RFC 1715, and on the basis of these examples, postulated that HD-Ratios of 0.85 or higher forced the network into some form of renumbering, while 0.80 or lower was considered to be an acceptable network efficiency metric.
The HD ratio is referenced within the IPv6 address allocation policies used by the Regional Internet Registries, and the policy documents specify that an HD-Ratio metric of 0.8 is an acceptable objective in terms of address assignment efficiency for an IPv6 network.
By contrast, the generally used address efficiency metric for IPv4 is the simple ratio of the number of allocated (or addressed) objects to the maximum number of allocatable objects. For IPv4 the commonly applied value for this ratio is 0.8 (or 80%).
A comparison of these two metrics is given in Table 1 of Attachment A.
| TOC |
The role of the address efficiency metric is to provide objective metrics than can be used by both the allocation entity and the applicant to determine whether an allocation is warranted, and provide some indication of the size of the allocation that should be undertaken. The metric provides a target address utilization levels that indicates at what point a network's address resource may be considered to be "fully utilized".
The objective here is to allow the network service provider to deploy addresses across both network infrastructure and to customers in a manner that does not entail periodic renumbering, and in a manner that allows both the internal routing system and inter-domain routing system to operate without excessive fragmentation of the address space. This entails use of an addressing plan where at each level of structure within the network there is a pool of address blocks that allows expansion of the network at that structure level without requiring renumbering of the remainder of the network.
It is recognized that an address utilization efficiency metric of 100% is unrealistic in any scenario. Within a typical address structure that address space is exhausted not when all address resources have been used, but at the point when one element within the structure has exhausted its pool, and augmentation of this pool by drawing from the pools of other elements would entail extensive renumbering. While it is not possible to provide a definitive threshold of what overall efficiency level is obtainable in all IP networks, experience with IPv4 network deployments suggests that it is reasonable to observe that at any particular level within a hierarchically structured address deployment plan an efficiency level of between 60% to 80% is an achievable metric in the general case.
This IPv4 efficiency threshold is significantly greater than that observed in the examples provided in conjunction with the HD-Ratio description. It is noted that the examples used in the HD-Ratio are drawn from, among other sources, the PSTN, and this comparison with the PSTN warrants some additional examination. There are a number of differences between public IP network deployments and PSTN deployments that may account for this difference. IP addresses are deployed on a per-provider basis with an alignment to network topology. PSTN addresses are, on the whole, deployed using a geographical distribution system of "call areas" that share a common number prefix. Within each call area sufficient number blocks from the number prefix must be available to allow each operator to draw their own number block from the area pool. Within the IP environment service providers do not draw address blocks from a common geographic number pool, but receive address blocks from the regional internet registry on a 'whole of network' basis.
In terms of considering the number of levels of internal hierarchy in IP networks, internally within an IP network the interior routing protocol, if uniformly deployed, admits a hierarchical network structure that is only two levels deep. Additional levels of routing hierarchy may be obtained using various forms of route confederations, but this is not a common deployment technique. The most common form of network structure used in large IP networks is a three-level structure using regions, individual Points of Presence (POPs), and end-customers.
It should also be noted that large scale IP deployments typically use a relatively flat routing hierarchy. In order to improve the dynamic performance of the interior routing protocol the number of routes carried in the interior routing protocol is commonly restricted to the routes corresponding to next hop destinations for iBGP routes, and customer routes are carried in the iBGP domain.
| TOC |
An address efficiency metric can be expressed using the number of levels of structure (n) and the efficiency achieved at each level (e). If the same efficiency threshold is applied at each level of structure the resultant efficiency threshold is n**e. This then allows us to make some additional observations about the HD-Ratio values. Table 2 of Appendix A indicates the number of levels of structure that are implied by a given HD-Ratio value of 0.8 for each address allocation block size, assuming a fixed efficiency level at all levels of the structure. The implication is that for large address blocks the HD-Ratio assumes a large number of elements in the hierarchical structure, or a very low level of address efficiency at the lower levels. In the case of IP network deployments this is not commonly the case.
As noted above, the most common form of structure used in IP networks is a three level structure. For larger networks a four level structure may be used, where the network is the union of a number of distinct operating entities, each of which use a three level internal structure.
Table 3 of Attachment A shows an example of address efficiency outcomes using a per-level efficiency metric of 0.75 and a progressively deeper network structure as the address block expands ("limited levels").
It is illustrative to compare these metrics for a larger network deployment. If, for example, the network is designed to encompass 8 million end customers, each of which is assigned a 16 bit subnet ID, then the following table indicates the associated allocation size as determined by the address efficiency metric.
   Allocation:  8M Customers  Allocation    Relative Ratio

   100% Allocation Efficiency   /25               1
   80% Efficiency (IPv4)        /24               2
   0.8 HD-Ratio                 /19              64
   0.94HD Ratio                 /23               4
   75% with Limited Levels      /23               4
| Figure 4 |
It is noted that the 0.8 HD-Ratio produces a significantly lower efficiency level than the other metrics. The limited level model appears to point to a more realistic value for an efficiency value for networks of this scale. This model corresponds to an HD Ratio with a threshold value of 0.945.
| TOC |
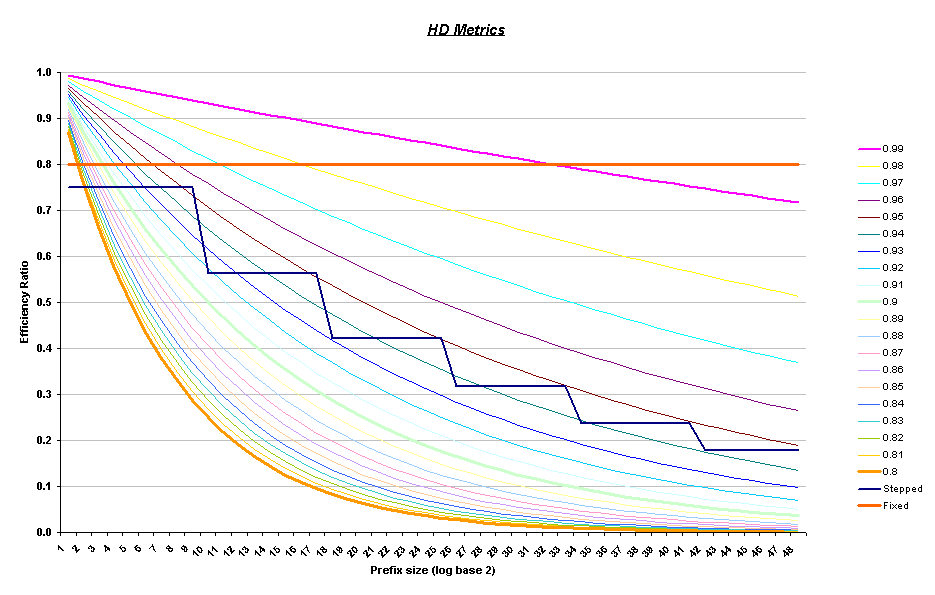
One way to model the range of outcomes of taking a more limited approach to the number of levels of aggregateable hierarchy is to look at a comparison of various values for the HD Ratio with the model of a fixed efficiency and the "Limited Levels" model. This is indicated in Figure 5.
| Figure 5 |
As shown in this figure it is possible to select an HD-Ratio value that models IP level structures in a fashion that behaves more consistently for very large deployments. In this case the choice of an HD Ratio of 0.94 is consistent with a limited level model of up to 5 levels of hierarchy with a metric of 75% density at each level. This correlation is indicated in Table 3 of Attachment A.
In attempting to assess the impact of potentially changing the HD ratio to a lower value, it is useful to assess this using some models of address comsumption data. The results described here use the IPv4 allocation data as published by the Regional Internet Registries [reference to "delegated" files]. The simulation work assumes that the IPv4 delegation data uses an IPv4 /32 for each end customer, and that assignments have been made based on an 80% density metric in terms of assumed customer count. The customer count is then used as the basis of an IPv6 address allocation, using the HD Ratio tomap from a customer count to the size of an address allocation.
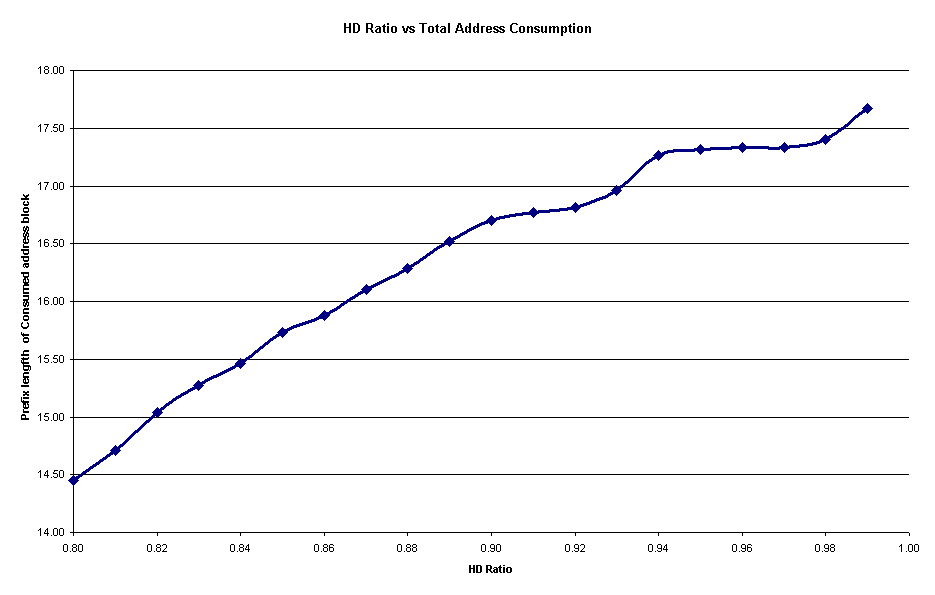
The first experimental result presented here is that of a sumulation of an IPv6 address allocation registry, using IPv4 allocation data as published by the RIRs spanning from January 1, 1999 until August 31, 2004. The aim is to identify the relative level of IPv6 address consumption using a IPv6 request size profile based on the application of various HD-Ratio values to the derived customer numbers.
The profile of total address consumption is indicated in Figure 6
0.80	/14.45
0.81	/14.71
0.82	/15.04
0.83	/15.27
0.84	/15.46
0.85	/15.73
0.86	/15.88
0.87	/16.10
0.88	/16.29
0.89	/16.52
0.90	/16.70
0.91	/16.77
0.92	/16.81
0.93	/16.96
0.94	/17.26
0.95	/17.32
0.96	/17.33
0.97	/17.33
0.98	/17.40
0.99	/17.67
| Figure 6 |
| Figure 7 |
The distribution of prefixes for various HD-Ratio values is shown in Figure 8. There are some quantization anomalies in the data due to the mapping of V4 data to V6 data. This is an artifact of the simulation technique rather than an intrinsic property of adoption of the HD Ratio.
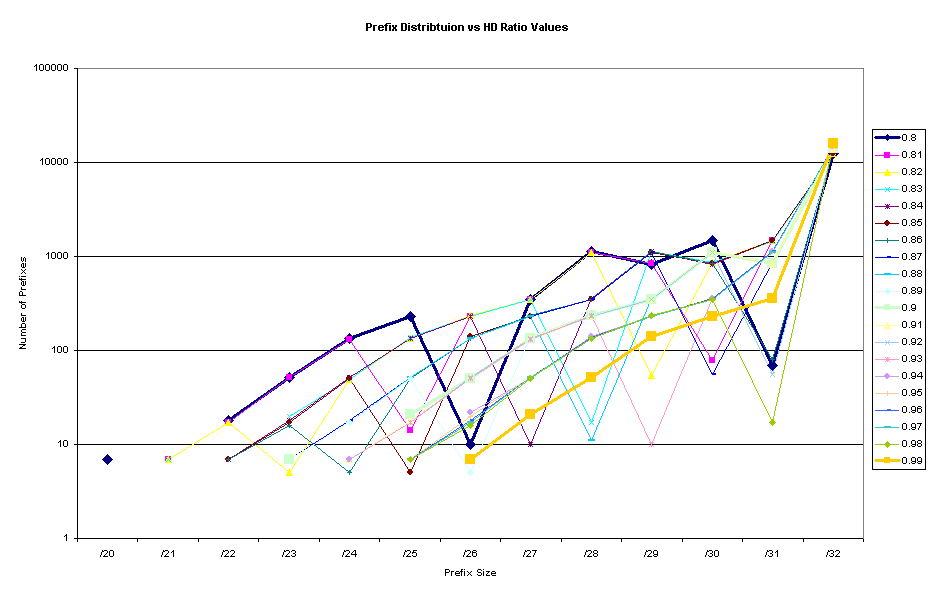
| Figure 8 |
The implication of these results is that it is probable that a IPv6 address registry will see sufficient distribution of allocation request sizes such that the choice of a threshold HD-Ratio will impact the registries' total address consumtion rates, and the variance between an HD-Ratio of 0.8 and and an HD-Ratio of 0.99 is a factor of approximately 8 in relative rates over an extended period of time. The simulation also indicates that the overall majority of allocations fall within a /32 minimum allocation size (between 74% to 95%), and the selection of a particular HD-Ratio value has a significant impact in terms of allocation sizes for a small proportion of allocation transactions.
| TOC |
The HD-Ratio with a value of 0.8 as a model of network address utilization efficiency produces very low efficiency outcomes for networks spanning of the order of 10**6 end customers and larger.
The HD-Ratio with a 0.8 value makes the assumption that as the address allocation block increases in size the network within which the addresses will be deployed adds additional levels of hierarchical structure. This increasing depth of hierarchical structure to arbitrarily deep hierarchies is not a commonly observed feature of public IP network deployments.
The fixed efficiency model uses the assumption that as the allocation block becomes larger the network structure remains at a fixed level of levels, or if the number of levels is increased, then efficiency achieved at each level increases significantly. There is little evidence to suggest that increasing number of levels in a network hierarchy increases the efficiency at each level.
It is evident that neither of these models accurately encompass IP network infrastructure models and the associated requirements of address deployment. The fixed efficiency model places an excessive burden on the network operator to achieve very high levels of utilization at each level in the network hierarchy, leading to either customer renumbering or deployment of NAT to meet the target efficiency value in a hierarchically structure network. The HD-Ratio model using a value of 0.8 specifies a very low address efficiency target for larger networks, and while this places no particular stress on network architects in terms of forced renumbering, there is the concern that this represents an extravagant use of address resources. If the objective of IPv6 is to encompass a number of decades of deployment, and span a public network that ultimately encompasses many billions of end customers, then there is legitimate cause for concern that the HD-Ratio value of 0.8 may be setting too conservative a target for address efficiency.
It is recommended that further study of address efficiency metrics and the relationship between network structure and address efficiency models considered as part of such a study. Consideration should be given to the viability of specifying a higher HD-Ratio value as representing a more relevant model of internal network structure, internal routing and internal address aggregation structures.
This document has also noted the common choice of a fixed length of 16 bits for the subnet ID in the IPv6 unicast address architecture for each customer assignment. While this choice has been used in the block of unicast address space spanned by the IPv6 address prefix 2000::/3, it should not be assumed by vendors or network operators that this particular subnet scheme will be used for other unicast address blocks. Prior to the opening of further unicast address blocks for end user assignment it is considered to be a useful exercise to evaluate the effectiveness of this fixed length subnet scheme, and compare it to an subnet scheme with a variable length and a smaller minimum value.
| TOC |
Considerations pf various forms of host density metrics creates no new threats to the security of the internet.
| TOC |
The document was reviewed by Kurt Lindqvist, Thomas Narten, Paul Wilson, David Kessens, Bob Hinden and Brian Haberman.
| TOC |
| [1] | Hinden, R. and S. Deering, "Internet Protocol Version 6 (IPv6) Addressing Architecture", RFC 3513, April 2003. |
| [2] | Huitema, C., "The H Ratio for Address Assignment Efficiency", RFC 1715, November 1994. |
| [3] | Durand, A. and C. Huitema, "The H-Density Ratio for Address Assignment Efficiency An Update on the H ratio", RFC 3194, November 2001. |
| TOC |
| Geoff Huston | |
| APNIC | |
| EMail: | gih@apnic.net |
| TOC |
The first table compares the threshold number of /48 end user allocations that would be performed for a given assigned address block in order to consider that the utilization has achieved its threshold utilization level.
Fixed Efficiency Value  0.8
HD-Ratio Value          0.8


Prefix          Size              Fixed Efficiency HD-Ratio Efficiency Ratio
                                    0.8                 0.8

/48                 1                 1 100%              1  100%   1
/47                 2                 2 100%              2   87%   1
/46                 4                 4 100%              3   76%   1
/45                 8                 7  88%              5   66%   1
/44                16                13  81%              9   57%   1
/43                32                26  81%             16   50%   2
/42                64                52  81%             28   44%   2
/41               128               103  80%             49   38%   2
/40               256               205  80%             84   33%   2
/39               512               410  80%            147   29%   3
/38             1,024               820  80%            256   25%   3
/37             2,048             1,639  80%            446   22%   4
/36             4,096             3,277  80%            776   19%   4
/35             8,192             6,554  80%          1,351   16%   5
/34            16,384            13,108  80%          2,353   14%   6
/33            32,768            26,215  80%          4,096   13%   6
/32            65,536            52,429  80%          7,132   11%   7
/31           131,072           104,858  80%         12,417    9%   8
/30           262,144           209,716  80%         21,619    8%  10
/29           524,288           419,431  80%         37,641    7%  11
/28         1,048,576           838,861  80%         65,536    6%  13
/27         2,097,152         1,677,722  80%        114,105    5%  15
/26         4,194,304         3,355,444  80%        198,668    5%  17
/25         8,388,608         6,710,887  80%        345,901    4%  19
/24        16,777,216        13,421,773  80%        602,249    4%  22
/23        33,554,432        26,843,546  80%      1,048,576    3%  26
/22        67,108,864        53,687,092  80%      1,825,677    3%  29
/21       134,217,728       107,374,180  80%      3,178,688    2%  34
/20       268,435,456       214,748,365  80%      5,534,417    2%  39
/19       536,870,912       429,496,730  80%      9,635,980    2%  45
/18     1,073,741,824       858,993,460  80%     16,777,216    2%  51
/17     2,147,483,648     1,717,986,919  80%     29,210,830    1%  59
/16     4,294,967,296     3,435,973,837  80%     50,859,008    1%  68
/15     8,589,934,592     6,871,947,674  80%     88,550,677    1%  78
/14    17,179,869,184    13,743,895,348  80%    154,175,683    1%  89
/13    34,359,738,368    27,487,790,695  80%    268,435,456    1% 102
/12    68,719,476,736    54,975,581,389  80%    467,373,275    1% 118
/11   137,438,953,472   109,951,162,778  80%    813,744,135    1% 135
/10   274,877,906,944   219,902,325,556  80%  1,416,810,831    1% 155
/9    549,755,813,888   439,804,651,111  80%  2,466,810,934    0% 178
/8  1,099,511,627,776   879,609,302,221  80%  4,294,967,296    0% 205
/7  2,199,023,255,552 1,759,218,604,442  80%  7,477,972,398    0% 235
/6  4,398,046,511,104 3,518,437,208,884  80% 13,019,906,166    0% 270
/5  8,796,093,022,208 7,036,874,417,767  80% 22,668,973,294    0% 310
Table 1: Comparison of Fixed Efficiency threshold vs HD-Ratio Threshold
| Figure 9 |
One possible assumption behind the HD ratio is that the inefficiencies that are a consequence of large scale deployments are an outcome of increased number of levels of hierarchical structure within the network. The following table calculates the depth of the hierarchy in oder to achieve a 0.8 HD ratio, assuming a 0.8 utilization efficiency at each level in the hierarchy.
Prefix          Size              0.8 Structure
                             HD Ratio    Levels
/48                 1               1         1
/47                 2               2         1
/46                 4               3         2
/45                 8               5         2
/44                16               9         3
/43                32              16         4
/42                64              28         4
/41               128              49         5
/40               256              84         5
/39               512             147         6
/38             1,024             256         7
/37             2,048             446         7
/36             4,096             776         8
/35             8,192           1,351         9
/34            16,384           2,353         9
/33            32,768           4,096        10
/32            65,536           7,132        10
/31           131,072          12,417        11
/30           262,144          21,619        12
/29           524,288          37,641        12
/28         1,048,576          65,536        13
/27         2,097,152         114,105        14
/26         4,194,304         198,668        14
/25         8,388,608         345,901        15
/24        16,777,216         602,249        15
/23        33,554,432       1,048,576        16
/22        67,108,864       1,825,677        17
/21       134,217,728       3,178,688        17
/20       268,435,456       5,534,417        18
/19       536,870,912       9,635,980        19
/18     1,073,741,824      16,777,216        19
/17     2,147,483,648      29,210,830        20
/16     4,294,967,296      50,859,008        20
/15     8,589,934,592      88,550,677        21
/14    17,179,869,184     154,175,683        22
/13    34,359,738,368     268,435,456        22
/12    68,719,476,736     467,373,275        23
/11   137,438,953,472     813,744,135        23
/10   274,877,906,944   1,416,810,831        24
/9    549,755,813,888   2,466,810,934        25
/8  1,099,511,627,776   4,294,967,296        25
/7  2,199,023,255,552   7,477,972,398        26
/6  4,398,046,511,104  13,019,906,166        27
/5  8,796,093,022,208  22,668,973,294        27
Table 2: Number of Structure Levels assumed by HD-Ratio
| Figure 10 |
An alternative approach is to use a model of network deployment where the number of levels of hierarchy increases at a lower rate than that indicated in a 0.8 HD ratio model. One such model is indicated in the following table. This is compared to using an HD-Ratio value of 0.94.
Per-Level Target Efficiency: 0.75

Prefix           Size Stepped      Stepped Efficiency    HD-Ratio Efficiency Ratio
                      Levels          0.75                   0.94

/48                 1  1                 1 100%                 1 100%   1.0
/47                 2  1                 2 100%                 2 100%   1.0
/46                 4  1                 3  75%                 4 100%   0.8
/45                 8  1                 6  75%                 7  88%   0.9
/44                16  1                12  75%                13  81%   0.9
/43                32  1                24  75%                25  78%   1.0
/42                64  1                48  75%                48  75%   1.0
/41               128  1                96  75%                92  72%   1.0
/40               256  1               192  75%               177  69%   1.1
/39               512  2               384  75%               338  66%   1.1
/38             1,024  2               576  56%               649  63%   0.9
/37             2,048  2             1,152  56%             1,244  61%   0.9
/36             4,096  2             2,304  56%             2,386  58%   1.0
/35             8,192  2             4,608  56%             4,577  56%   1.0
/34            16,384  2             9,216  56%             8,780  54%   1.0
/33            32,768  2            18,432  56%            16,845  51%   1.1
/32            65,536  2            36,864  56%            32,317  49%   1.1
/31           131,072  3            73,728  56%            62,001  47%   1.2
/30           262,144  3           110,592  42%           118,951  45%   0.9
/29           524,288  3           221,184  42%           228,210  44%   1.0
/28         1,048,576  3           442,368  42%           437,827  42%   1.0
/27         2,097,152  3           884,736  42%           839,983  40%   1.1
/26         4,194,304  3         1,769,472  42%         1,611,531  38%   1.1
/25         8,388,608  3         3,538,944  42%         3,091,767  37%   1.1
/24        16,777,216  3         7,077,888  42%         5,931,642  35%   1.2
/23        33,554,432  4        14,155,776  42%        11,380,022  34%   1.2
/22        67,108,864  4        21,233,664  32%        21,832,894  33%   1.0
/21       134,217,728  4        42,467,328  32%        41,887,023  31%   1.0
/20       268,435,456  4        84,934,656  32%        80,361,436  30%   1.1
/19       536,870,912  4       169,869,312  32%       154,175,684  29%   1.1
/18     1,073,741,824  4       339,738,624  32%       295,790,403  28%   1.1
/17     2,147,483,648  4       679,477,248  32%       567,482,240  26%   1.2
/16     4,294,967,296  4     1,358,954,496  32%     1,088,730,702  25%   1.2
/15     8,589,934,592  5     2,717,908,992  32%     2,088,760,595  24%   1.3
/14    17,179,869,184  5     4,076,863,488  24%     4,007,346,185  23%   1.0
/13    34,359,738,368  5     8,153,726,976  24%     7,688,206,818  22%   1.1
/12    68,719,476,736  5    16,307,453,952  24%    14,750,041,884  21%   1.1
/11   137,438,953,472  5    32,614,907,904  24%    28,298,371,876  21%   1.2
/10   274,877,906,944  5    65,229,815,808  24%    54,291,225,552  20%   1.2
/9    549,755,813,888  5   130,459,631,616  24%   104,159,249,331  19%   1.3
/8  1,099,511,627,776  5   260,919,263,232  24%   199,832,461,158  18%   1.3
/7  2,199,023,255,552  6   521,838,526,464  24%   383,384,219,730  17%   1.4
/6  4,398,046,511,104  6   782,757,789,696  18%   735,533,451,805  17%   1.1
/5  8,796,093,022,208  6 1,565,515,579,392  18% 1,411,141,697,760  16%   1.1
Table 3: Limited Levels of Structure
| Figure 11 |
| TOC |
[This section not for RFC publication]
This memo has been reviewed by an ad hoc advisory committee to advise the IAB on a number of matters relating to IPv6. It is proposed that the note be published as an informational RFC, as it does not propose any specific alteration to the IPv6 specification.
With respect to the recommendation made in this document that further study of address efficiency metrics and the relationship between network structure and address efficiency models considered, it is noted that this study could be undertaken in the context of the Open Policy Forums hosted by the Regional Address Registries in addition to, or instead of, an IETF-hosted study. Given the intersection of interests in this work between the IETF and the RIR-hosted policy forums, some level of collaboration in any such study would appear to be adviseable.
| TOC |
The IETF takes no position regarding the validity or scope of any Intellectual Property Rights or other rights that might be claimed to pertain to the implementation or use of the technology described in this document or the extent to which any license under such rights might or might not be available; nor does it represent that it has made any independent effort to identify any such rights. Information on the procedures with respect to rights in RFC documents can be found in BCP 78 and BCP 79.
Copies of IPR disclosures made to the IETF Secretariat and any assurances of licenses to be made available, or the result of an attempt made to obtain a general license or permission for the use of such proprietary rights by implementers or users of this specification can be obtained from the IETF on-line IPR repository at http://www.ietf.org/ipr.
The IETF invites any interested party to bring to its attention any copyrights, patents or patent applications, or other proprietary rights that may cover technology that may be required to implement this standard. Please address the information to the IETF at ietf-ipr@ietf.org.
This document and the information contained herein are provided on an "AS IS" basis and THE CONTRIBUTOR, THE ORGANIZATION HE/SHE REPRESENTS OR IS SPONSORED BY (IF ANY), THE INTERNET SOCIETY AND THE INTERNET ENGINEERING TASK FORCE DISCLAIM ALL WARRANTIES, EXPRESS OR IMPLIED, INCLUDING BUT NOT LIMITED TO ANY WARRANTY THAT THE USE OF THE INFORMATION HEREIN WILL NOT INFRINGE ANY RIGHTS OR ANY IMPLIED WARRANTIES OF MERCHANTABILITY OR FITNESS FOR A PARTICULAR PURPOSE.
Copyright (C) The Internet Society (2004). This document is subject to the rights, licenses and restrictions contained in BCP 78, and except as set forth therein, the authors retain all their rights.
Funding for the RFC Editor function is currently provided by the Internet Society.