The 16-bit AS Number Report
This report was last updated:
03-May-2026 07:50 UTC
This report is generated on a daily basis, and describes the current state of allocation of 16-bit Autonomous System numbers.
Using a model of each RIR's relative rate of allocation, it is possible to generate a model of 16-bit AS number consumption. Here the end point is the date where the first RIR has exhausted its available pool of 16-bit AS numbers, and no further numbers are available in the IANA unallocated pool to replenish the RIR's pool. The data available suggests a best fit predictive model where this will occur on 09-Jan-2023.
Following an IETF standards action in November 2006, the Internet Assigned Numbers Authority (IANA) has extended the AS Number field to 32 bits in size, increasing the pool size from 65536 to 4,294,967,296 values. As of January 2007 32 bit AS numbers are available for assignment from the Regional Internet Number Registries (RIRs). A similar report, looking at the allocation state of the entire 32-bit AS number pool can be found here.
Current Status of the 16 bit AS Number Pool
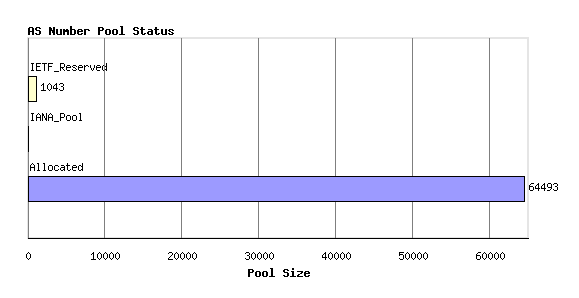
The (now historical) 16-bit Autonomous System number space is a 16 bit field, with 65,536 unique values. From this pool 1023 numbers are reserved for local or private use, and 3 are reserved for special use. The remaining pool of 64510 numbers are available for use to support the Internet's public inter-domain routing system. IANA holds a pool of unallocated AS numbers, while the remainder have already been allocated by IANA for assignment.
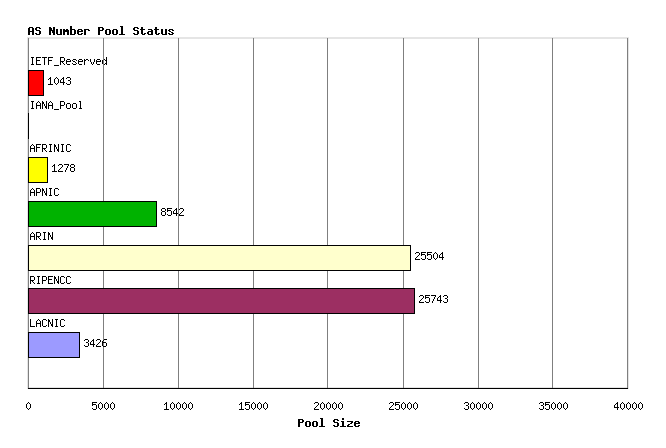
Figure 1 - AS Number Pool StatusThis allocated number pool is managed by the Regional Internet Registries, (RIRs) and the breakdown of IANA allocated AS number blocks to each of the RIRs is as follows:
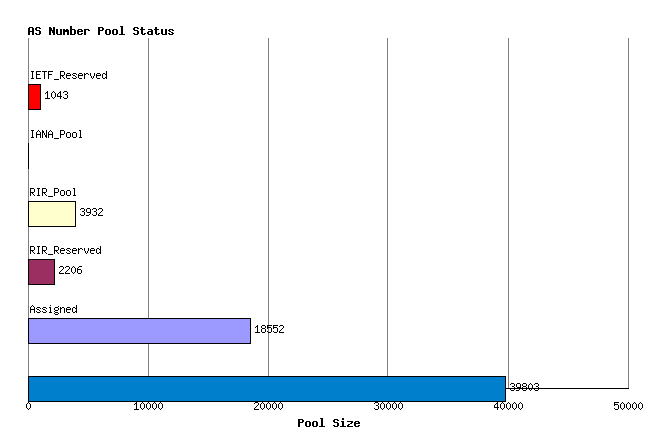
Figure 2 - AS allocations to RIRsAny individual AS number can be in any one of four states: part of the IANA unallocated number pool, part of the unassigned pool held by an RIR, assigned to an end user entity but not advertised in the routing system, and assigned and advertised in BGP. The current totals of AS numbers according to this set of states is:
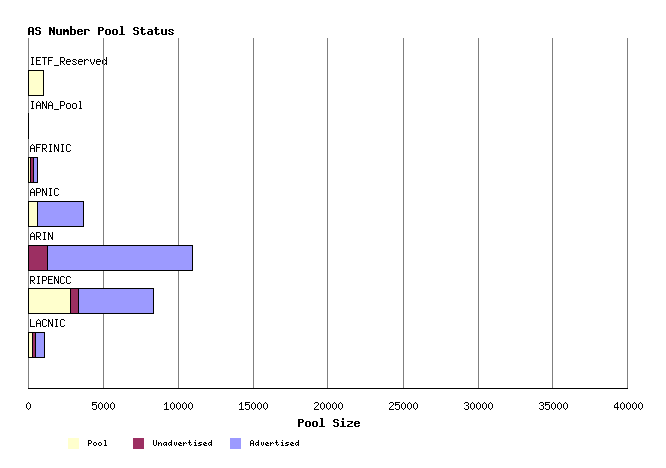
Figure 3 - AS Pools by StateThis status can be further categorized per RIR:
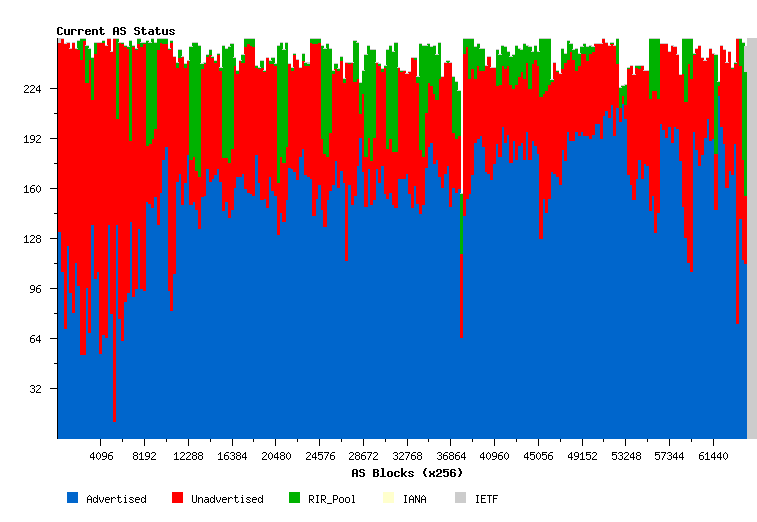
Figure 4 - AS Pools by RIR by StateAnother view of the AS number state pools is by grouping the AS numbers numerically. The following view shows all 65536 AS numbers, using 256 columns each describing a pool of 256 AS numbers. The IANA pool is formed from the higher numbered ASs. Within the allocated blocks, the lower-numbered AS blocks have a higher rate of assigned by unadvertised ASs as compared to higher numbered assigned AS numbers.
Figure 5 - AS Number Status
Time Series Data
Allocations
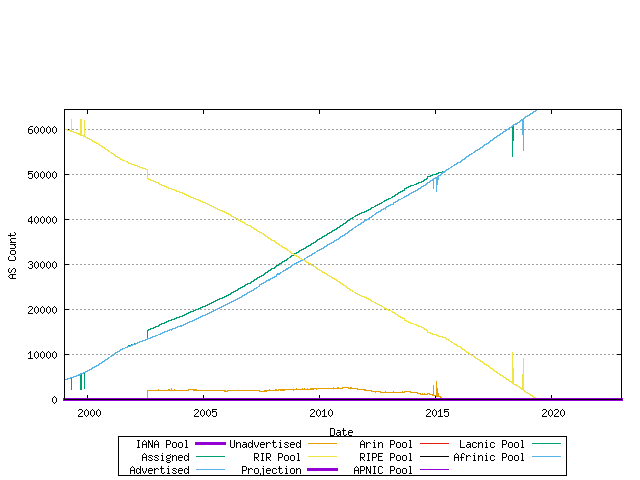
AS numbers are drawn from the Unallocated AS Number Pool, administered by the IANA. The IANA data from the period 1992 until the present is shown in the following time series. These allocations are made to the Regional Internet Registries (RIRs), and the allocation unit is in blocks of 1024 AS Numbers.
Figure 6 - Cumulative IANA AS block allocationsThis series can be further broken down by tracking the cumulative number of AS's that have been allocated to each of the 5 current RIRs. This in indicated below.
Figure 7 - Cumulative IANA AS block allocations per RIRAssignments
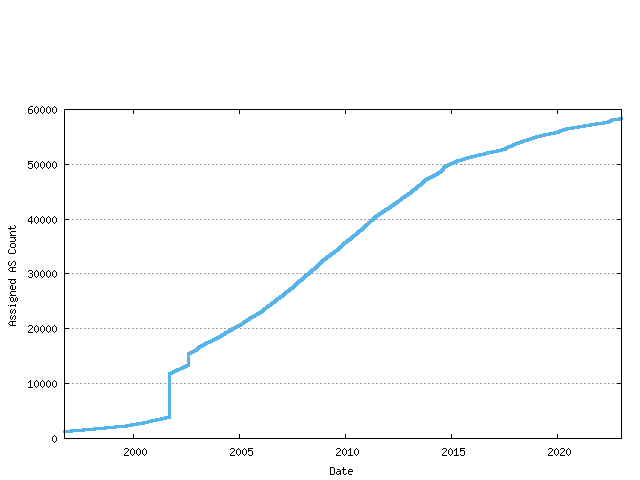
RIRs perform assignments of AS numbers to ISPs and end user entities. The cumulative number of assigned AS numbers over time is shown in the following figure.
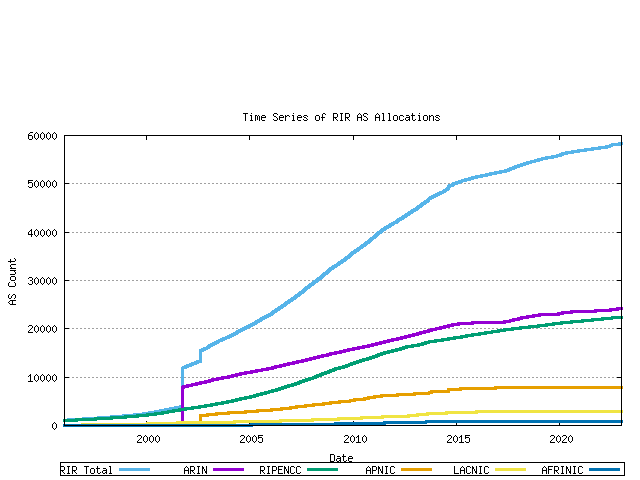
Figure 8 - Cumulative RIR AS assignmentsThis data can be further categorized by the assigning RIR.
Figure 9 - Cumulative RIR AS assignments per RIRRIR Pools
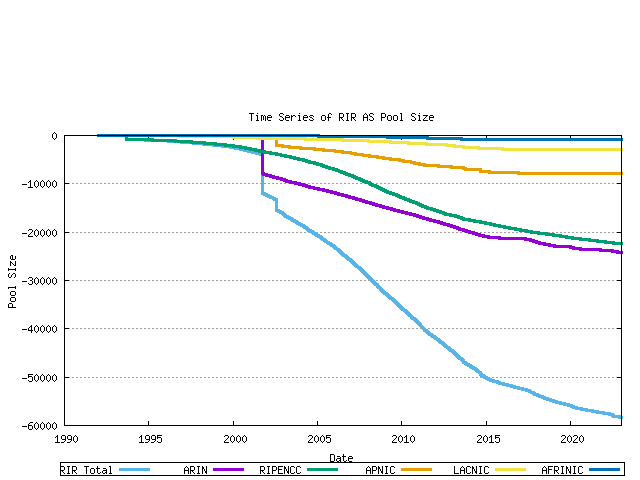
Each RIR allocates from its IANA-Allocated number pool. When the pool reaches a low threshold amount a further 1024 AS number block is allocated by IANA to the RIR. The pool size within each RIR can be derived from the allocation and assignment series data, producing the following graph. The total RIR pool size current is in the range of 4,000 to 7,000 AS numbers across the RIR system.
Figure 10 - RIR AS Number Pool sizeAdvertisements
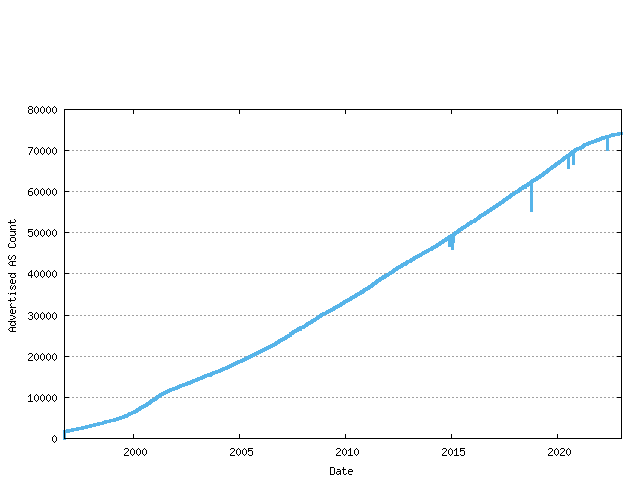
The next data set is the number of unique ASN's advertised in the BGP routing table over time. This data has been regularly collected since 1997, and the total data series is shown below. The data has three distinct phases: the pre-Internet boom prior to 1999, the sharp upward growth during the boom period from 1999 until early 2001, and the post-boom data.
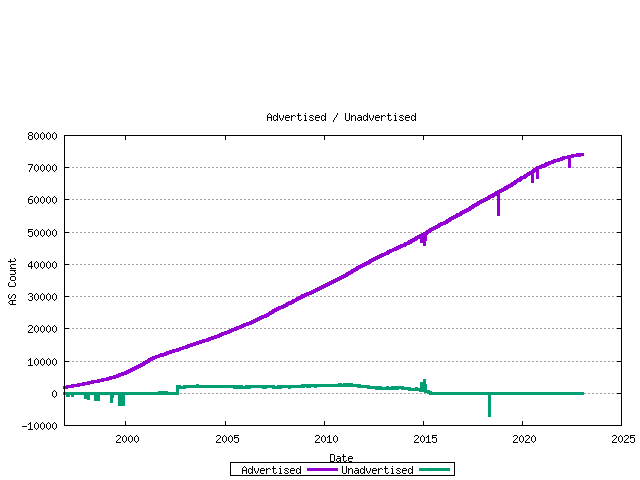
Figure 11 - Advertised AS CountThe difference between the assigned AS number count and the advertised AS number count is the unadvertised AS count. The following figure shows the number of advertised and advertised ASs as a time series.
Figure 12 - Advertised / Unadvertised AS CountThe ratio of unadvertised to advertised AS numbers can be plotted over time.
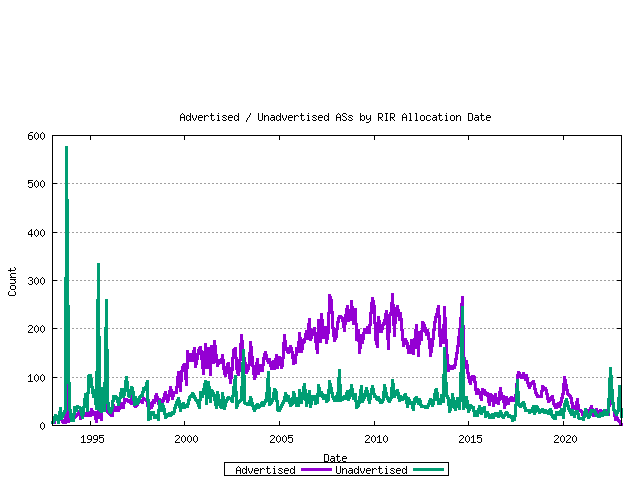
Figure 13 - Advertised / Unadvertised AS CountTaking the current set of assigned AS numbers, the set of advertised and unadvertised AS numbers can be matched against the RIR date of assignment. This is shown below.
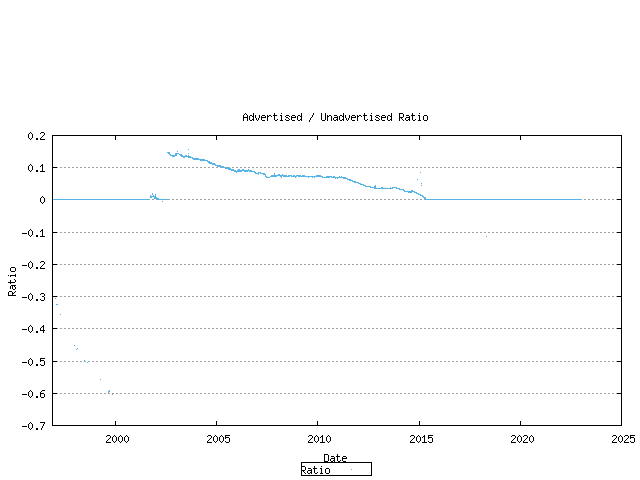
Figure 14 - Advertised / Unadvertised Assignment SeriesThe ratio between these values for each month is shown below.
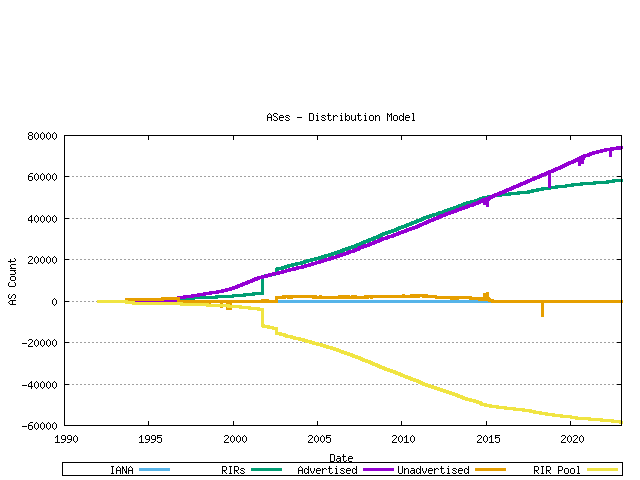
Figure 15 - Advertised / Unadvertised Ratio SeriesThe complete picture of AS number allocations, assignments and advertisements can be assembled from these sequences.
Figure 17 - AS Allocation and Assignment Series
Trend Projection Models for AS Number Consumption
The question posed in this section is: when will the pool of 16 bite AS numbers be exhausted? The methodology used here is that of using previous allocation information to generate a trend model, and use that trend to extrapolate likely future consumption levels, and thereby generate a predicted exhaustion point. Of course making assumptions about the future has its risks, and often the future does not conform to current expectations. This is a quote from RFC1930, published in March 1996:
   9. AS Space exhaustion

   The AS number space is a finite amount of address space. It is
   currently defined as a 16 bit integer and hence limited to 65535
   unique AS numbers. At the time of writing some 5,100 ASes have been
   allocated and a little under 600 ASes are actively routed in the
   global Internet. It is clear that this growth needs to be continually
   monitored. However, if the criteria applied above are adhered to,
   then there is no immediate danger of AS space exhaustion. It is
   expected that IDRP will be deployed before this becomes an issue.
   IDRP does not have a fixed limit on the size of an RDI.


   RFC 1930, "Guidelines for creation of an AS" J. Hawkinson, T. Bates,
   March 1996.
With that cautionary note about making assumptions about the future in mind, it is now possible to use this data to generate some predictive models of AS Number consumption. The technique used here is to use recent AS number consumption data in a time series, apply a best fit to the data using a least squares best fit, and then using the derived slope and intercept to generate a predictive trend line. This technique provides a linear best fit projection model. It may be the case that the underlying environment is driven by compound rowth factors that create accelerating growth. The technique used here is to perform a least squares best fit on the logarithm of the data points, derive the best fit slope and intercept to generate a trend series, and then exponentiate the trend data to create a best fit trend model that exhibts exponential growth.
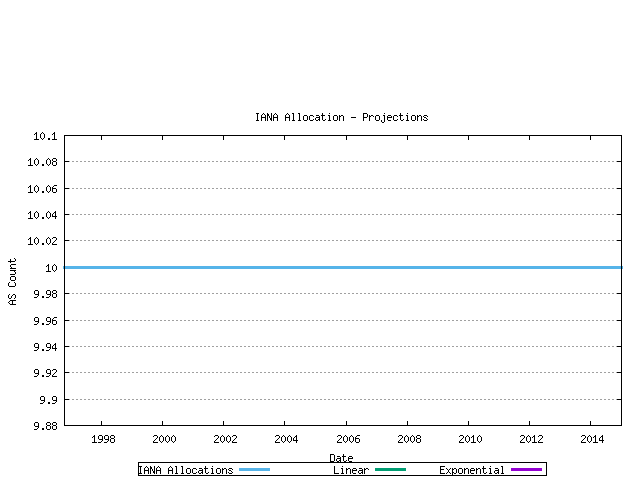
The first data series analysed in this fashion is that of the IANA allocation series. The past 900 days of IANA allocation activity have been analyzed using both linear and exponentrend analysis. The outcomes are indicated below.
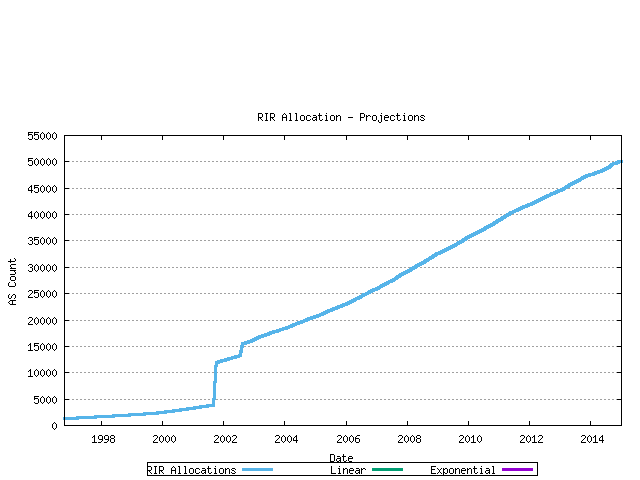
Figure 18 - IANA Allocation projectionThe second view is that of projection of the RIR allocation series. Again linear and exponential models are used in the projections.
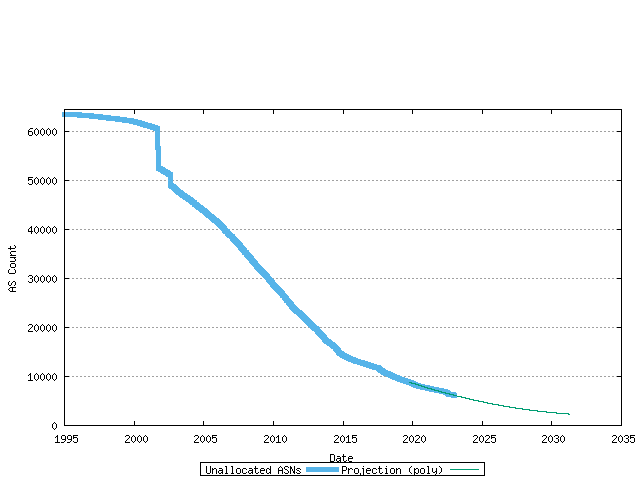
Figure 19 - RIR Assignment projectionIt's possible to reverse this view and look at the total pool of unallocated address, and assume a "perfect" consumption model whereby the pool is drained uniformly.
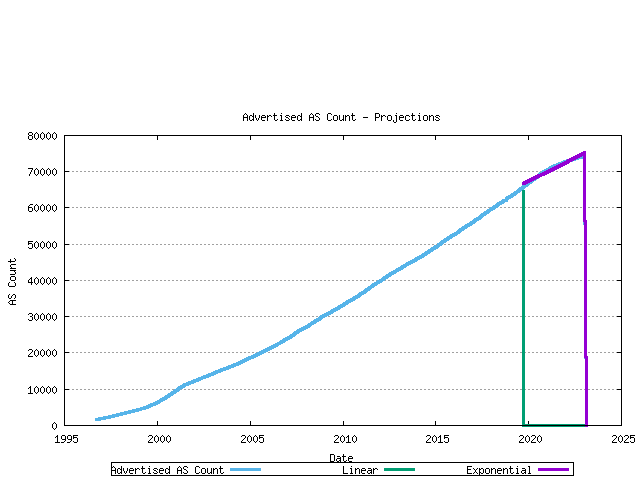
Figure 20 - RIR Unallocated Pool projectionThe third view is that of projection of the advertised AS count. The assumption underlying this projection is that all the unadvertised ASs would ultimately be used in the advertised BGP table. Again linear and exponential models are used in the projections.
Figure 21 - RIR Assignment projection
Modelling AS Number Consumption
The final step is to generate a model of AS number consumption. The model used here is to project forward the number of ASs found in the Internet's BGP table (advertised ASs), and also model the best fit projection of the ratio of unadvertised to advertised AS numbers. These two series will allow the projection of the total assigned AS numbers. Together with a model of the behavior of the RIR AS number pool, a complete AS number consumption model can be generated. The modelling uses the most recent 800 days as the baseline data for this exercise.
The first series is the projection of the unadvertised AS count / advertised AS count ratio. This is shown in the following figure, with a linear best fit superimposed on the measured data.
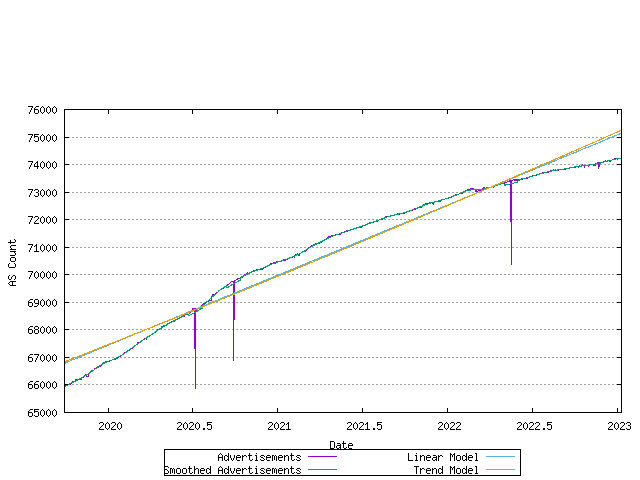
Figure 22 - unadvertised / advertised AS Ratio best fitThe next step is to model the advertised AS number count. The previous section looked at both linear and exponential trend models. This is shown in the figure below.
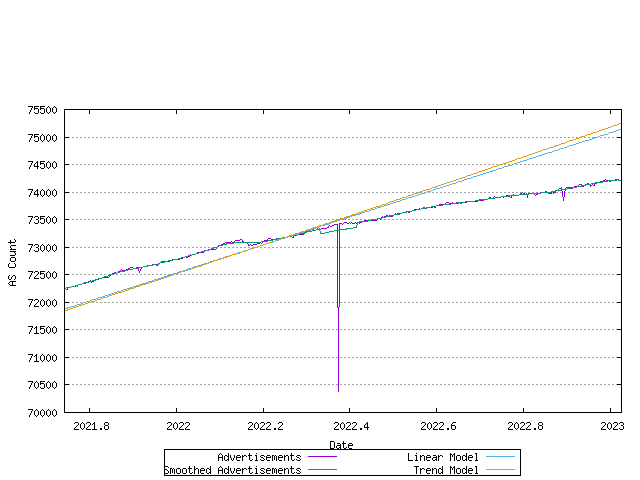
Figure 23 - Allocation Rate - linear and exponential trend best fitThe most recent data and the correlation to the linear and best fit models is shown in the figure below.
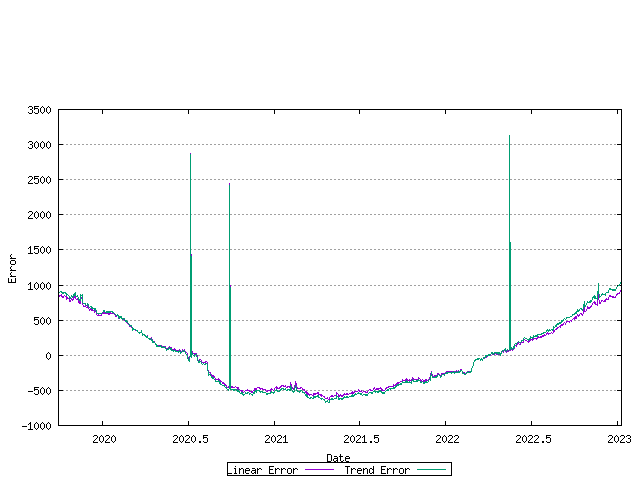
Figure 24 - Allocation Rate - linear and exponential trend best fitThe error between the original data series and the linear and exponential trend models is shown below. The closer the values in these series are to zero, the better the fit.
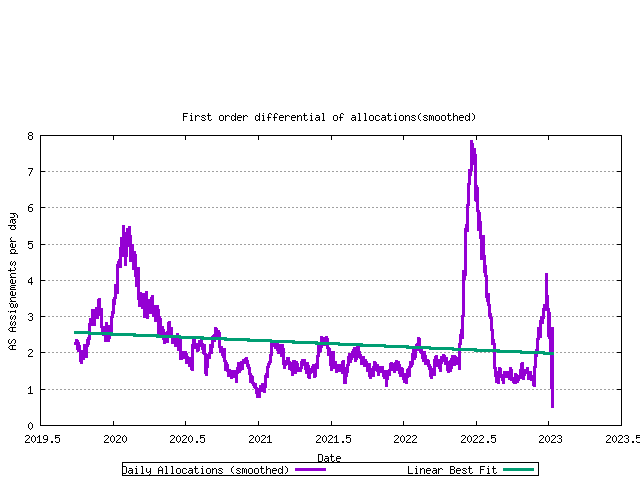
Figure 25 - Allocation Rate - linear and exponential trend errorA best fit to the data can be established by looking at the first order differential of the data. If the first order differential is constant, then a linear trend model would be the best fit to the data. This is shown in the following figure.
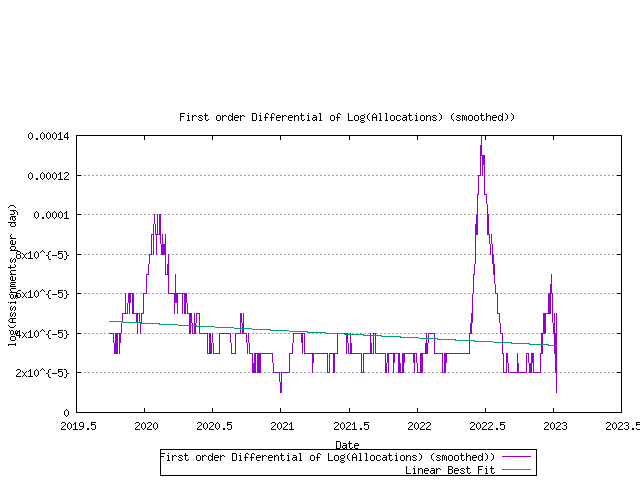
Figure 26 - First order differential of allocation rateThere is a rising trend in this data, indicating that an exponential model may be a better fit. here the first order differential of the log of the data is shown in the following figure.
Figure 27 - First order differential of log(allocation rate)Using this exponential trend model of advertised AS number growth and a linear trend model of the ratio of unadvertised to advertised AS numbers, it is now possible to model each RIR's projected AS allocation rate and then look at the predicted behaviour of the RIR pool size for each RIR. This is shown below.
Figure 28 - RIR Pool size - projectionUsing this model of each RIR's relative rate of allocation, it it possible to generate a model of AS number consumption. Here the end point is the date where the first RIR has exhausted its available pool of 2-byte AS numbers, and no further numbers are available in the IANA unallocated pool to replenish the RIR's pool. The data available suggests a best fit predictive model where this will occur on 09-Jan-2023.
Figure 29 - Predictive model of 2-Byte AS Number consumption