The 32-bit AS Number Report
This report was last updated:
12-May-2026 07:55 UTC
This report is generated on a daily basis, and describes the current state of allocation of Autonomous System numbers.
Using a model of each RIR's relative rate of allocation, it is possible to generate a model of AS number consumption. Originally, this model was used to generate a prediction of exhaustion of the 16 bit AS Number space. As of 1 December 2006 the AS Number Registry has expanded to a 32 bit number space. This report looks at the trends of AS number consumption.
1. Current Status
The Autonomous System number space is a 32 bit field, with 4,294,967,296 unique values. From this pool 1023 numbers are reserved for local or private use, and 3 are reserved for special use. The remaining pool of 4,294,966,271 numbers are available for use to support the Internet's public inter-domain routing system. IANA holds the pool of unallocated AS numbers, while the remainder have already been allocated by IANA for assignment. This allocated number pool is managed by the Regional Internet Registries, (RIRs) and the breakdown of IANA allocated AS number blocks to each of the RIRs is as follows:
| Status | AS Pool | 16-bit | 32-bit | |
| IETF Reserved | 0 | 0 | 0 | |
| IANA Unallocated Pool | 4294834178 | 0 | 4294834178 | |
| Allocated | 133118 | 0 | 133118 | |
| RIR Data | ||||
| AFRINIC | 3326 | 0 | 3326 | |
| APNIC | 33415 | 0 | 33415 | |
| ARIN | 34640 | 0 | 34640 | |
| RIPE NCC | 45610 | 0 | 45610 | |
| LACNIC | 16127 | 0 | 16127 | |
Any individual AS number can be in any one of four states: part of the IANA unallocated number pool, part of the unassigned pool held by an RIR, assigned to an end user entity but not advertised in the routing system, and assigned and advertised in BGP. The current totals of AS numbers according to this set of states is:
| RIR | RIR Pool | Unadv | Adv | 16-bit | Unadv | Adv | 32-bit | Unadv | Adv | |||
| AFRINIC | 767 | 2559 | 0 | 0 | 0 | 0 | 767 | 2559 | 0 | |||
| APNIC | 3061 | 30354 | 0 | 0 | 0 | 0 | 3061 | 30354 | 0 | |||
| ARIN | 1306 | 33334 | 0 | 0 | 0 | 0 | 1306 | 33334 | 0 | |||
| RIPE NCC | 6816 | 38794 | 0 | 0 | 0 | 0 | 6816 | 38794 | 0 | |||
| LACNIC | 2332 | 13795 | 0 | 0 | 0 | 0 | 2332 | 13795 | 0 | |||
| TOTAL | 14282 | 118836 | 0 | 0 | 0 | 0 | 14282 | 118836 | 0 |
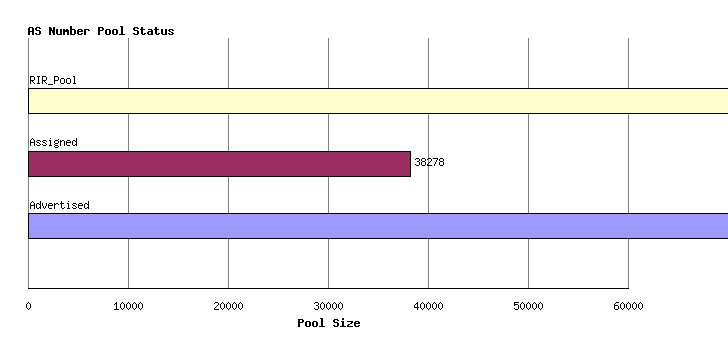
Figure 1 - AS Pools by Holding State
Time Series Data
Allocations
AS numbers are drawn from the Unallocated AS Number Pool, administered by the IANA. The IANA data from the period 1992 until the present is shown in the following time series. These allocations are made to the Regional Internet Registries (RIRs), and the allocation unit is in blocks of 1024 AS Numbers.
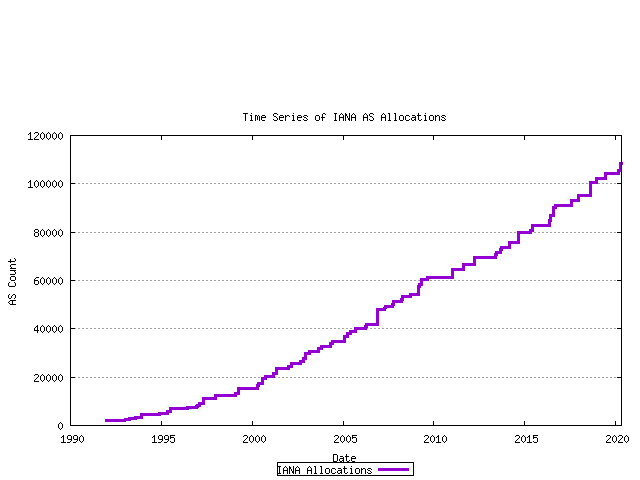
Figure 2 - Cumulative IANA AS block allocations
This series can be further broken down by tracking the cumulative number of AS's that have been allocated to each of the 5 current RIRs. This in indicated below.
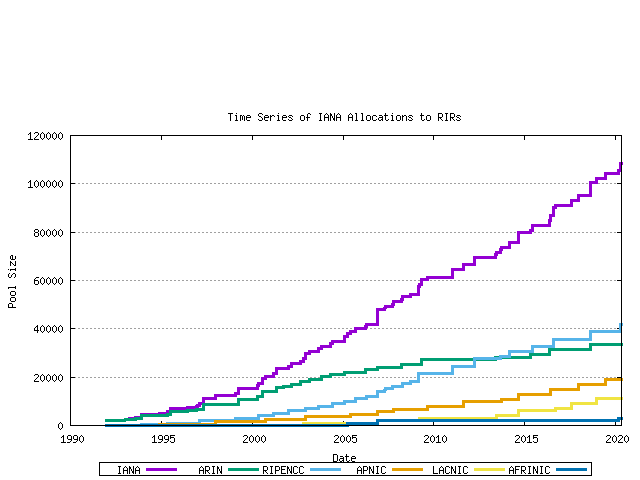
Figure 3 - Cumulative IANA AS block allocations per RIR
Assignments
RIRs perform assignments of AS numbers to ISPs and end user entities. The cumulative number of assigned AS numbers over time is shown in the following figure.
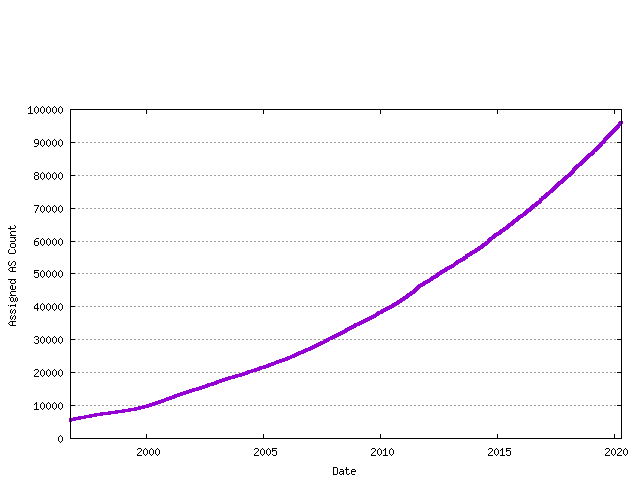
Figure 4 - Cumulative RIR AS assignments
This data can be further categorized by the assigning RIR.
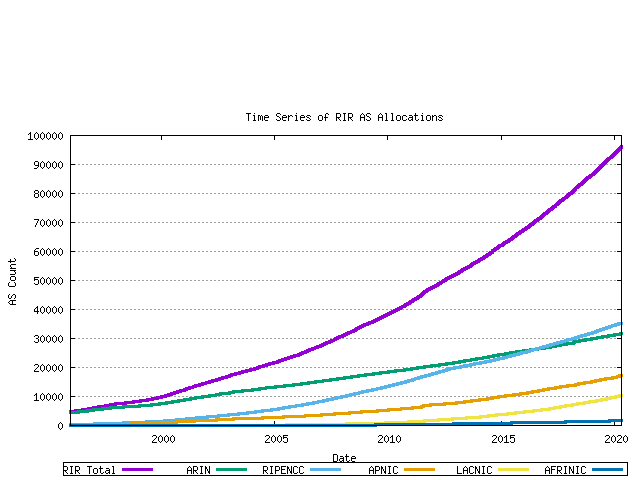
Figure 5 - Cumulative RIR AS assignments per RIR
RIR Pools
Each RIR allocates from its IANA-Allocated number pool. When the pool reaches a low threshold amount a further 1024 AS number block is allocated by IANA to the RIR. The pool size within each RIR can be derived from the allocation and assignment series data, producing the following graph. The total RIR pool size current is in the range of 4,000 to 7,000 AS numbers across the RIR system.
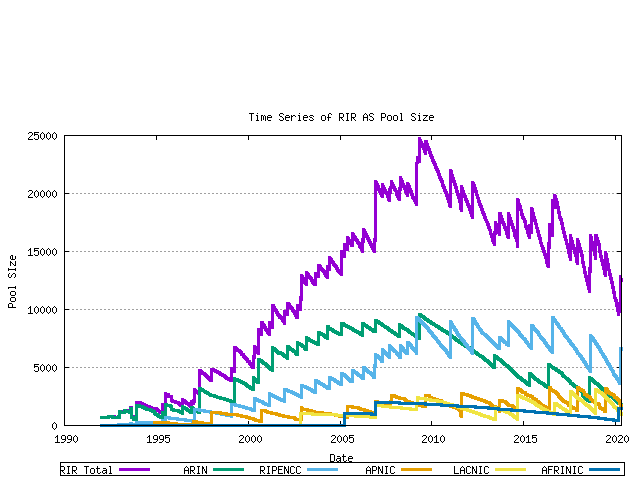
Figure 6 - RIR AS Number Pool size
Advertisements
The next data set is the number of unique ASN's advertised in the BGP routing table over time. This data has been regularly collected since 1997, and the total data series is shown below. The data has three distinct phases: the pre-Internet boom prior to 1999, the sharp upward growth during the boom period from 1999 until early 2001, and the post-boom data.
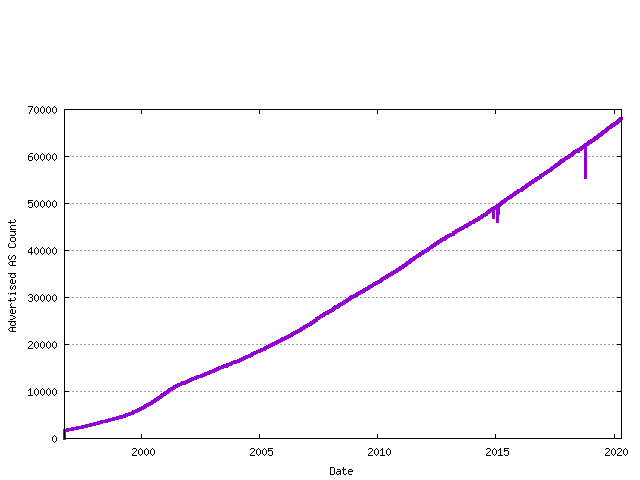
Figure 7 - Advertised AS Count
The difference between the assigned AS number count and the advertised AS number count is the unadvertised AS count. The following figure shows the number of advertised and advertised ASs as a time series.
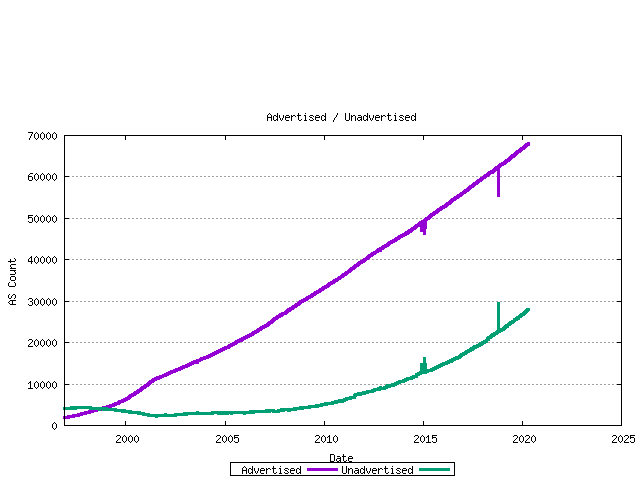
Figure 8 - Advertised / Unadvertised AS Count
The ratio of unadvertised to advertised AS numbers can be plotted over time.
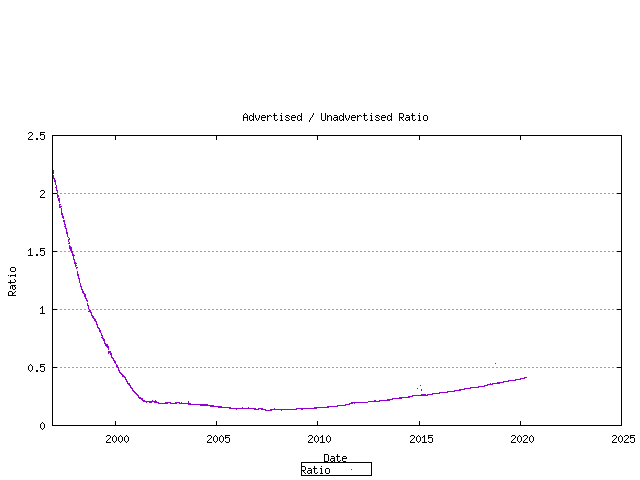
Figure 9 - Advertised / Unadvertised AS Count
Taking the current set of assigned AS numbers, the set of advertised and unadvertised AS numbers can be matched against the RIR date of assignment. This is shown below.
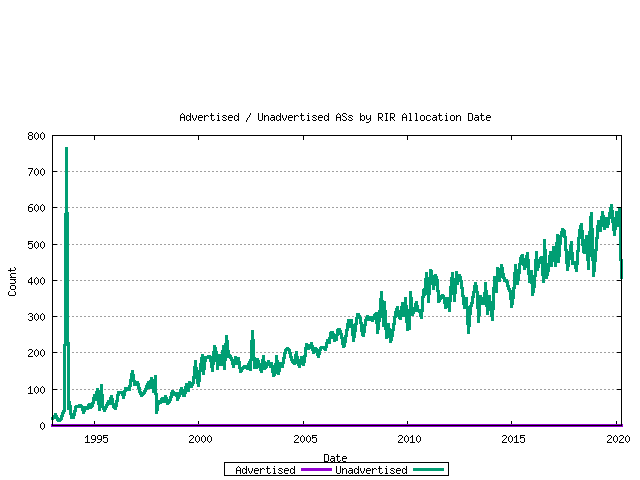
Figure 10 - Advertised / Unadvertised Assignment Series
The ratio between these values for each month is shown below.
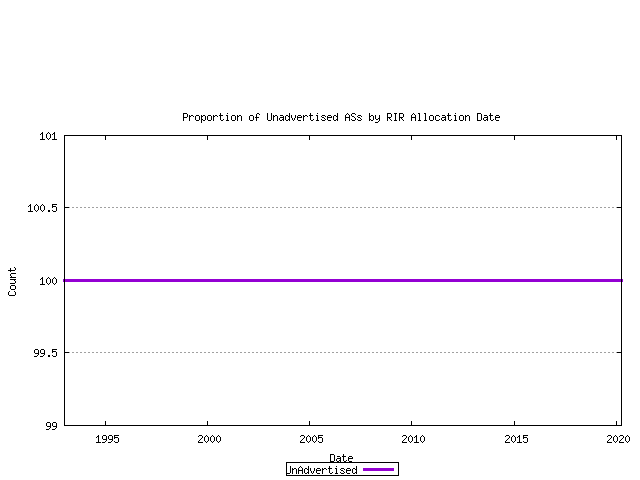
Figure 11 - Advertised / Unadvertised Ratio Series
The complete picture of AS number allocations, assignments and advertisements can be assembled from these sequences.
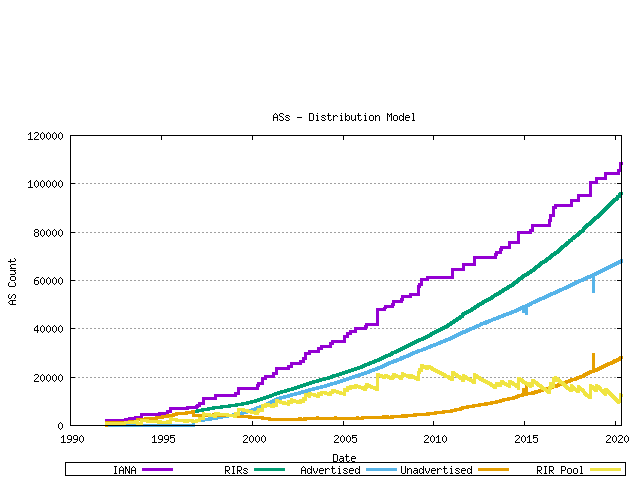
Figure 12 - AS Allocation and Assignment Series
Trend Projection Models for AS Number Consumption
This section makes some estimates about future AS number consumption, looking at the next decade of consumption. The methodology used here is that of using previous allocation series to generate a trend model, and use that trend to extrapolate likely future consumption levels. The technique used here is to perform a least squares best fit on the data and the logarithm of the data values, derive the best fit slope and intercept to generate a trend series. This is used for a linear (constant growth) model. An accelerating growth model is generated by exponentiating the trend logarithm data to create a best fit trend model that exhibts exponential growth.
The first data series analysed in this fashion is that of the IANA allocation series. The past 900 days of IANA allocation activity have been analyzed using both linear and exponentrend analysis. The outcomes are indicated below.
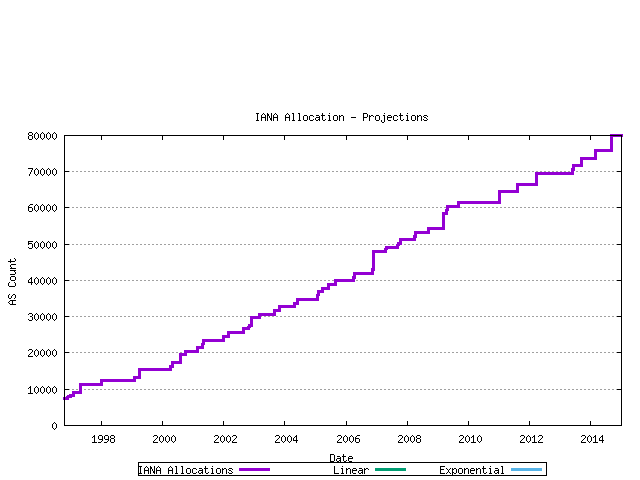
Figure 13 - IANA Allocation projection
The second view is that of projection of the RIR allocation series. Again linear and exponential models are used in the projections.
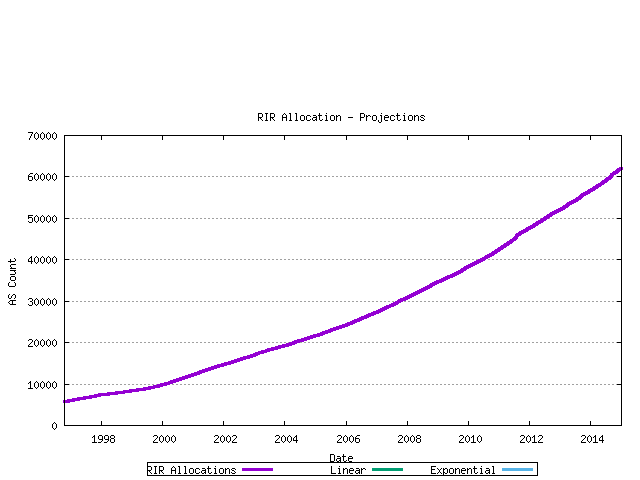
Figure 14 - RIR Assignment projection
The third view is that of projection of the advertised AS count. Again linear and exponential models are used in the projections.
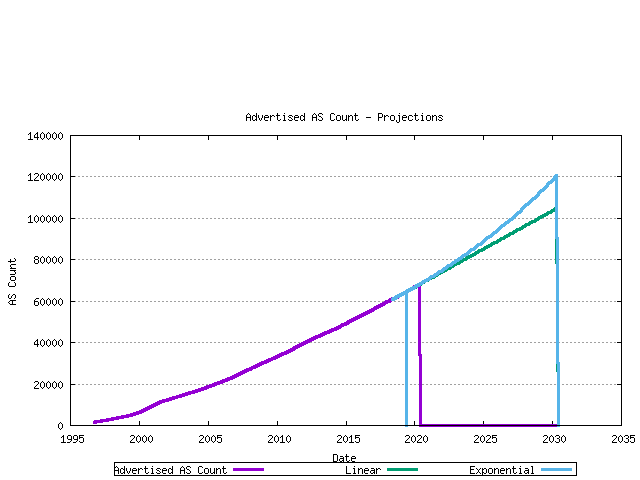
Figure 15 - RIR Assignment projection
Modelling AS Number Consumption
The final step is to generate a model of AS number consumption. The model used here is to project forward the number of ASs found in the Internet's BGP table (advertised ASs), and also model the best fit projection of the ratio of unadvertised to advertised AS numbers. These two series will allow the projection of the total assigned AS numbers. Together with a model of the behavior of the RIR AS number pool, a complete AS number consumption model can be generated. The modelling uses the most recent 800 days as the baseline data for this exercise.
The first series is the projection of the unadvertised AS count / advertised AS count ratio. This is shown in the following figure, with a linear best fit superimposed on the measured data.
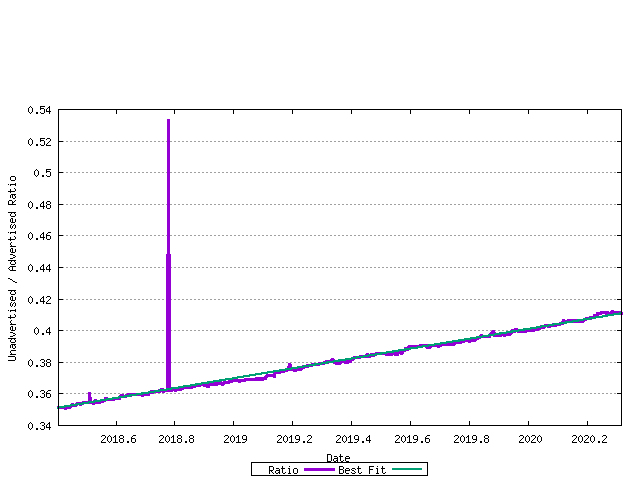
Figure 16 - unadvertised / advertised AS Ratio best fit
The next step is to model the advertised AS number count. The previous section looked at both linear and exponential trend models. This is shown in the figure below.
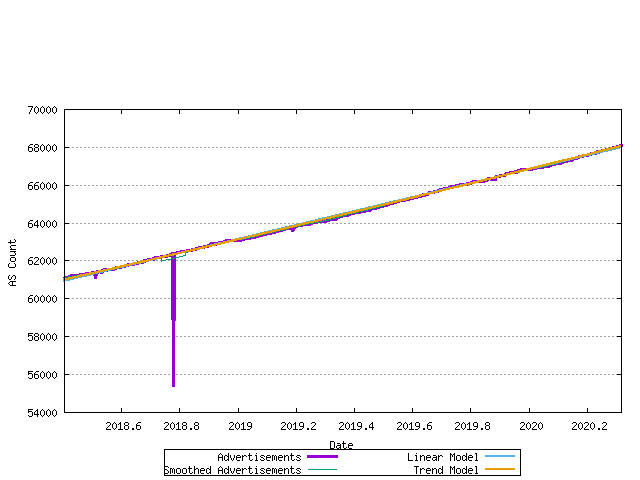
Figure 17 - Allocation Rate - linear and exponential trend best fit
The most recent data and the correlation to the linear and best fit models is shown in the figure below.
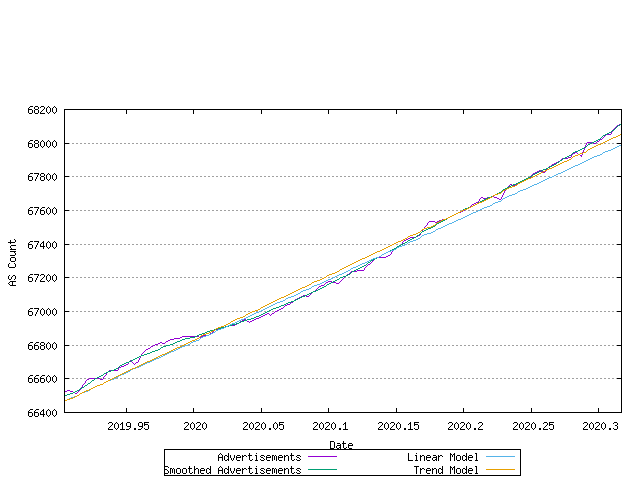
Figure 18 - Allocation Rate - linear and exponential trend best fit
The error between the original data series and the linear and exponential trend models is shown below. The closer the values in these series are to zero, the better the fit.
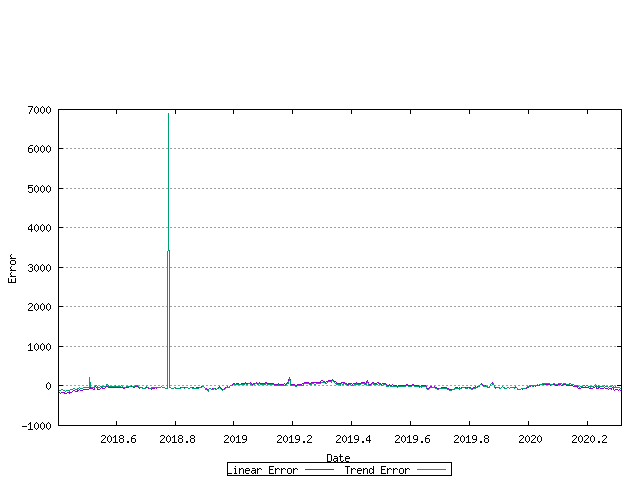
Figure 19 - Allocation Rate - linear and exponential trend error
A best fit to the data can be established by looking at the first order differential of the data. If the first order differential is constant, then a linear trend model would be the best fit to the data. This is shown in the following figure.
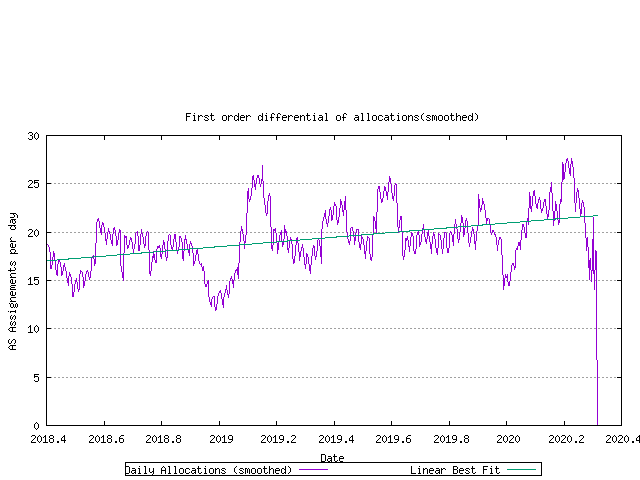
Figure 20 - First order differential of allocation rate
There is a rising trend in this data, indicating that an exponential model may be a better fit. here the first order differential of the log of the data is shown in the following figure.
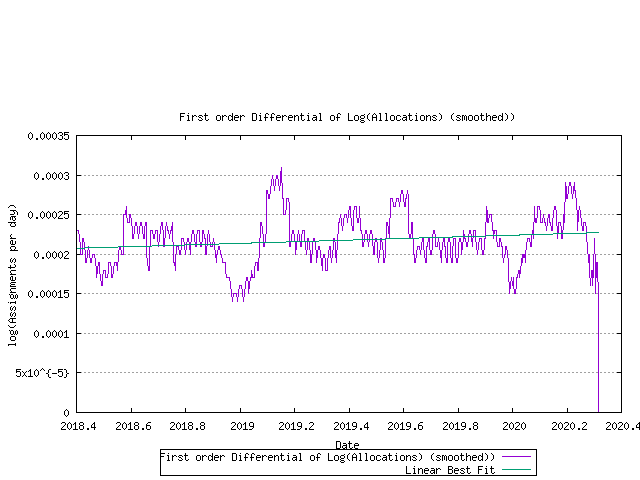
Figure 21 - First order differential of log(allocation rate)
Using this exponential trend model of advertised AS number growth and a linear trend model of the ratio of unadvertised to advertised AS numbers, it is now possible to model each RIR's projected AS allocation rate and then look at the predicted behaviour of the RIR pool size for each RIR. This is shown below.
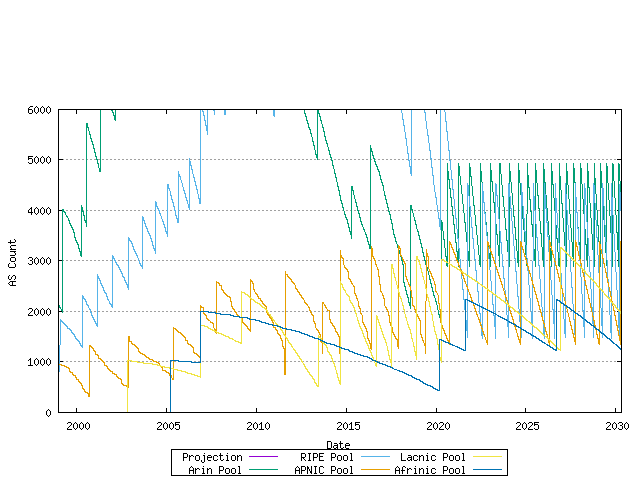
Figure 22 - RIR Pool size - projection
Using this model of each RIR's relative rate of allocation, it it possible to generate a model of AS number consumption.
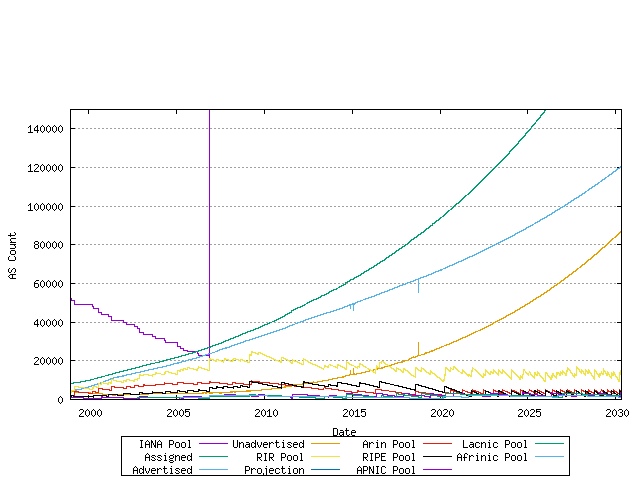
Figure 23 - Predictive model of AS Number consumption