The ISP Column
A monthly column on all things Internet
Other Formats:


|
The ISP Column
A monthly column on all things Internet
|
|
|
|
|
|
Other Formats:
|
|
|
|
|
Predicting the future is easy. The hard bit is always getting it right.
 Obviously
there are a limitless ways to look into the future and make some pronouncement.
In terms of professional occupations its up there with a few others as a candidate
for being the oldest one in the books. Whether its consulting the flight of
birds in the sky or performing feats of mathematical manipulation on a series
of measurements of stock prices, or simply making wild-eyed guesses, there's
no end of the various ways we've come up with to guess at the unknowable.
Obviously
there are a limitless ways to look into the future and make some pronouncement.
In terms of professional occupations its up there with a few others as a candidate
for being the oldest one in the books. Whether its consulting the flight of
birds in the sky or performing feats of mathematical manipulation on a series
of measurements of stock prices, or simply making wild-eyed guesses, there's
no end of the various ways we've come up with to guess at the unknowable.
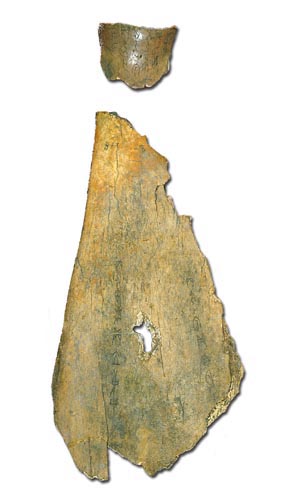
One of the more fascinating methods of divination, and one of the oldest recordedf forms of writing, can be seen in
the National Palace Museum in the city of Taipei, where a collection of Oracle Bones is on display. In this very ancient Chinese method of
divination the questions would be engraved on the surface of a shell or bone fragment, and surrounding it would be a number of potential
answers. On the reverse side of the bone an indentation would be drilled into the shell. The shell would then be placed over heat. The
indentation forms a stress point in the bone, and the heat causes the bone to crack outward from the indentation with a sharp snapping sound.
The sound of the snap, and the length, direction and strength of the crack would form the basis of the divination.
These days we've managed to replace the bone with a spreadsheet. While its often
a lot faster, its far less dramatic as a piece of theatre, and its always questionable
whether the accuracy of the divination has improved any case .
In this article I'd like to revisit a particular piece of analysis that has been a topic of considerable interest at various times over the past decade or more. The basic question is "how long can the IPv4 address pool last in the face of a continually growing network?" We've seen in the industry press at regular intervals dire reports that the IPv4 sky is falling and somewhere on the globe they've "'run out" of addresses. Once again its probably time to take a more considered look at the problem and see what numbers come out from this exercise using data collected up to 2003.
The initial design of IPv4 was extremely radical for its time in the late 1970's. Other contemporary vendor-based computer networking protocols were designed within the constraints of minimizing the packet header overhead in order to cram the maximal amount of data into the relatively sparse network bandwidths of the time, and address spans were defined within the overall assumption that the networks were deployed as islands of mainframe-based connectivity. In many protocol designs 16 bits of address space in the packet header was considered an extravagance, particularly so since in many cases the vendor hadn't even sold anywhere near 2 to the 16th power of numbers of computers. To dream of a multitude of computers, each attached to a single global network was a very far fetched dream, and then to use a globally unique address framework of 32 bits to number them was truly outlandish. After all, 2 to the power of 32 is just under 4.5 billion, and at the time this was somewhere around ten to twenty times the number of telephone handsets in the world. Someone was possibly making some very grand assumptions indeed about the future of the Internet!
To further add to the radical nature of the exercise, the Internet Network Information Center was prepared to hand out unique chunks of this address space to anyone that wanted it. Address deployment architectures in contemporary protocols did not have the address space to support such extravagance, nor did they even see a need for global uniqueness of addresses, so everyone numbered their isolated networks starting at the equivalent of '1', and progressed from there. When corporate mergers forced a network merger it was invariably time for a network consultant's feeding frenzy as both networks required complete redesign. Whereas, it seemed, the Internet address architecture was pre-built for inter-connection. It was as if it was the phone system being constructed from the outside in.
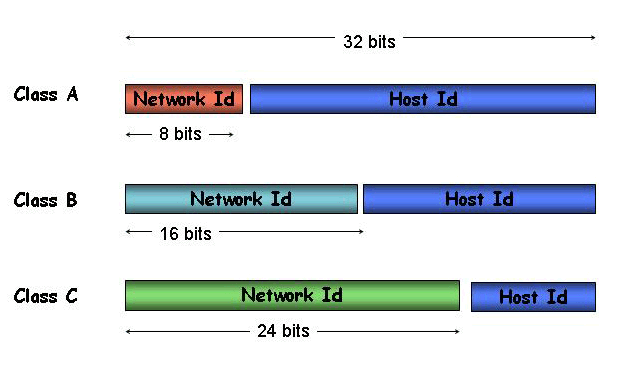
IP uses the address to express two aspects of a connected device: the identity of this particular device (endpoint identity) and the location within the network where this device can be reached (location or forwarding identity). The original IP address architecture used the end point identity to allow devices to refer to each other in end-to-end application transaction, but within the network itself, it used a sub-field of the address to undertake forwarding. The architectural assumption behind this scheme was that all devices that shared a common network sub-field were grouped together, and could pass packets between each other without required any form of IP network forwarding.
The resultant network architecture had two fields; a network identifier and a host identifier within that network. The first incarnation of this architecture used a division at the first octet: the first 8 bits were the network number, and the following 24 bits were the host identifier. The underlying assumption was deployment across a small number of very large networks. This view was subsequently refined, and the concept of a Class-based address architecture was devised. One half of the address space was left as a 8/24 bit structure, called the Class A space. This allowed for up to 127 networks each with 16,777,216 host identities. One quarter of the remaining space used a 16/16 bit split, allowing for up to 16,128 networks, each with up to 65,536 hosts, the Class B space. A further one eighth of the remaining space was divided using a 24/8 bit structure, allowing for 2,031,616 networks, each with up to 256 hosts, the Class C space. The remaining one eighth of the space was held in reserve.
This address scheme was devised in the early 1980's, and within a decade it was pretty clear that there was a problem. It was running out! The reason was an evident run on Class B addresses. While very few entities could see their IP network spanning millions of computers, the personal desktop computer was now a well established part of the landscape, and networks of just 256 hosts were just too small. So if the Class A space was too big, and the Class C too small, then Class B was just right!
Consequently, Class B networks were being assigned to networks at an exponentially increasing rate. Projections from the early 1990's forecast exhaustion of the Class B space by the mid-1990's. Obviously there was a problem here of relatively immediate proportion and the Internet Engineering Task Force (IETF) took on the task of finding some solutions. There were a number of responses devised by the IETF. As a means of mitigation of the immediate problem the IETF altered the concept of a network identifier. Rather than being a Classful fixed length identifier of either 8, 16 or 24 bits in size, the network identifier would be any length at all, and a network identifier was now the couplet of an IP address prefix and the bit length of the network part. The boundary between the network and host part could change across the network, so rather than having 'networks' and 'sub-networks' as in the Class-based address architecture, there was the concept of a variable length network mask. This was termed the "Classless" address architecture, and the step was considered to be a short term expediency to buy some additional time. The longer term plan was to develop a new IP architecture that could encompass a much larger connectivity domain than was possible with IPv4.
Well, we now have IPv6 as the longer term outcome. But what has happened to the short term expediency of the Classless address architectures in IPv4? It appears to have worked very well indeed so far, and now the question is how long can this short-term solution last?
Predicting the point of IPv4 address exhaustion has happened from time to time since the early 1990s within the IETF. The initial outcomes were clearly visible by the mid-1990's: the Classless address architecture was very effective in improving the address utilization efficiency, and the pressures of ever-increasing consumption of a visibly finite address resource were alleviated. But we're well beyond that time now. One boom later there's a big Internet out there, and its probably good to understand where we are heading with the underlying network address pool.
So lets prepare an Oracle Bone, scribe up the question, and light to the fire to see what the IPv4 address future looks like.
There are three stages in address allocation. The pool of IP addresses is managed by the Internet Assigned Numbers Authority, IANA. Blocks of addresses are allocated to Regional Internet Registries, who in turn allocate smaller blocks to Local Internet Registries (LIRs) or ISPs.

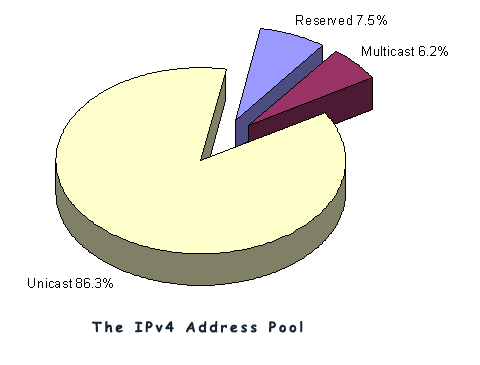
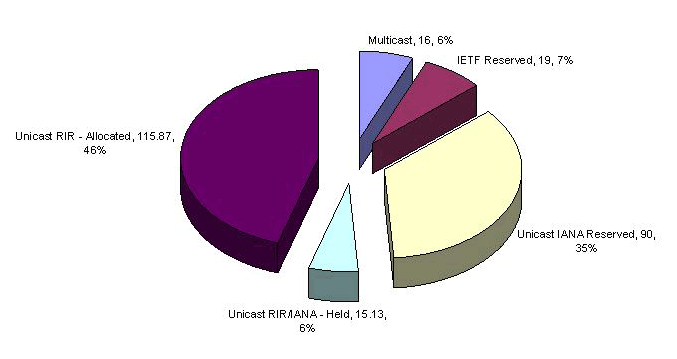
Currently there are 3,707,764,736 addresses that are managed in this way. It is probably easier to look at this in terms of the number of "blocks" where each block is the same size as the old Class A network, namely 16,777,216 addresses. The total address pool is 221 /8 s, with a further 16 /8's reserved for Multicast use, 16 /8's held in reserve, and 3 /8's are designated as not for use in the public Internet. So the way the address space as been divided up is shown in the following pie chart.
In looking at futures there are three places to look for data:
So the first place to look is the IANA registry file. Perhaps the most striking aspect of this record is that there is nothing older than 1991! This exposes one of the problems with analyzing such data, in that there is a difference between the current status of a registry, and a time-stamped log of the transactions that were made to the registry over time. The data published by the IANA is somewhere between the two, but the log data is incomplete and the current status of some address blocks is very unclear.
The registry reveals that of the 221 /8 blocks 90 are still held as unallocated by the IANA, and the remaining 131 have already been allocated in various ways.
The IANA registry also includes the date of allocation of the address block, so its possible to construct a time series of IANA allocations.
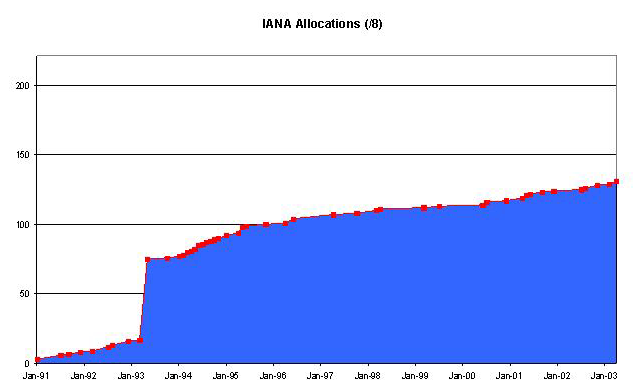
The data relating to allocations prior to 1995 looks like its not the actual date of allocation (as IANA allocations were performed through the 1980's), so it appears that the useable data starts in 1995. So if we take the data starting from 1995 and perform a linear regression to find a best fit of an exponential projection, its possible to make some predictions as to the time it will take to exhaust the remaining 50 /8's. (Assuming of course that the underlying and consistent model of growth is one where the expansion of the network is proportional to its size, rather than being a constant growth factor.)
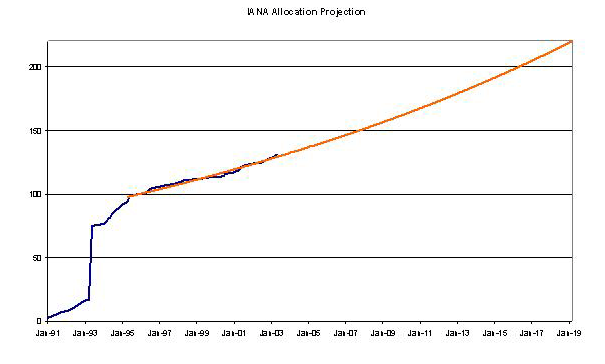
The projection of 2019 is perhaps surprising, as it seems that the network is bigger now than ever, yet the amount of additional address space required to fuel further accelerating growth for more than a decade is comparatively small.
There are perhaps three reasons why this is the case, and the turning point when these aspects gained traction in the Internet appeared to be around 1995.
The first 1.6 billion addresses (equivalent to some 100 /8 blocks) were allocated using the Class-based address architecture. Since this date address allocation has used a Classless architecture, and this has allowed for significantly improved efficiencies to be achieved in using the address space.
The Regional Internet Registries (RIR's) came into the picture, and started using conservation-based policies in address allocations. The RIR process requires each address applicant to demonstrate that they can make efficient and effective use of the address space, and this has dampened some of the wilder sets of expectations about an enterprises' address requirements.
Address Compression technologies became widely deployed. Dynamic Network Address Translation devices (NATs) have, for better or worse, become a common part of the network landscape. NATs allow large 'semi-private' networks to use a very small pool of public addresses as the external view of the network, while using private address space within the network. Dynamic Host Configuration Protocol ( DHCP) has allowed networks to recycle a smaller pool of addresses across a larger set of intermittently-connected devices.
Will these factors continue to operate in the same fashion in the future? Will future growth in the use of public address space operate from a basis of a steadily increasing accelerated growth? Of course there are some real weaknesses in the assumptions behind this form of extrapolation, and we'll look at some of these in further detail later. The assumptions made in this exercise are that it depends on the continuity of effectiveness of the RIR policies and their application, continuity of technology approaches and the absence of any disruptive triggers. While the RIR's have a very well regarded track record in terms of application of a policy of fair conservation of the address resource, and there are strong grounds for confidence that this will continue, obviously the latter two assumptions about technology and disruptive events are not all that comfortable. With that in mind the next step is to look at the RIR assignment data.
The RIR's also publish a registry of their transactions in "stats" files. For each currently allocated or assigned address block the RIR's have recorded, among other items, the date of the transaction that assigned an address block to a LIR or ISP. Using this data we can break up the 131 /8 blocks further, and its evident that the equivalent of 116 /8 blocks have been allocated or assigned by the RIR's, and the remaining space, where there is no RIR allocation or assignment record is the equivalent of 15 /8 blocks
These transactions can again be placed in a time series, as shown below.
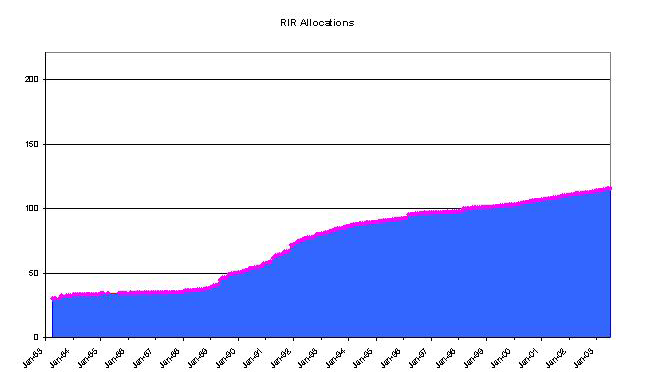
The post-1995 data used to extrapolate forward using the same linear regression technique described above, to find a curve of best bit using the same underlying growth model assumptions:
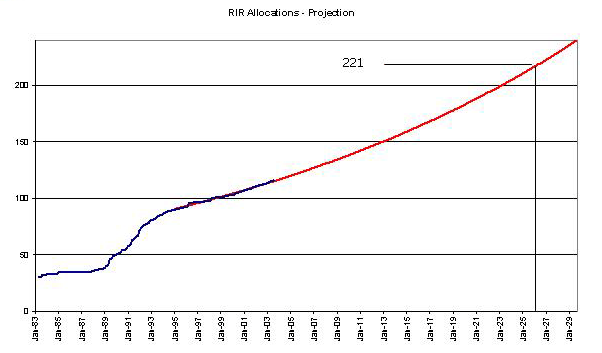
This form of extrapolation gives a date of 2026 for the time at which the RIR's will exhaust the number pool. If the withheld 16 /8's are bought into play, 2029 would be predicted by this approach.
Again the same caveats about the weakness of this approach as a reliable predictor apply here, and the view forward is based on the absence of large scale disruptions, or some externally-induced change in the underlying growth models for address demand.
Once addresses are assigned to end networks, the expectation is that these addresses will be announced to the network in the form of routing advertisements. So some proportion of these addresses are announced in the Internet's routing table. How large is the address space covered by the routing table?
Analysis of the BGP routing table at the Route-Views router provides an interesting answer in terms of the amount of advertised address space:
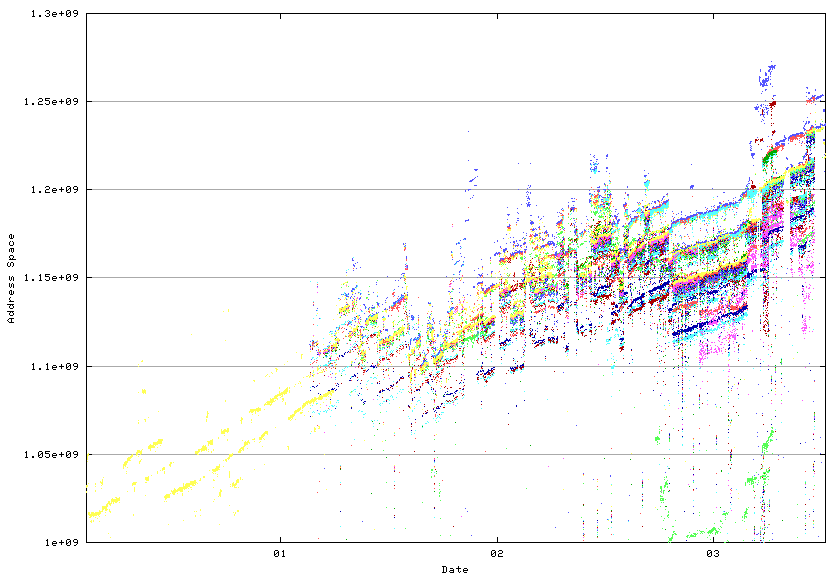
Route-Views has over 30 inter-domain routing peers, and each peer sends it a complete set of advertisements. The figure shows the amount of address space spanned by each peer over time. The measurements are taken every 2 hours, and the data spans from February 2000 until the present.
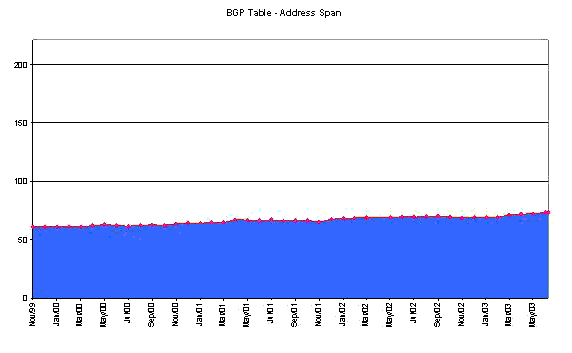
This aggregated view of the Internet is challenging to distill into a single time series of data. An alternative approach is to take a single view of the address span of the Internet. This is the view from one point, inside the AS1221 network operated by Telstra:
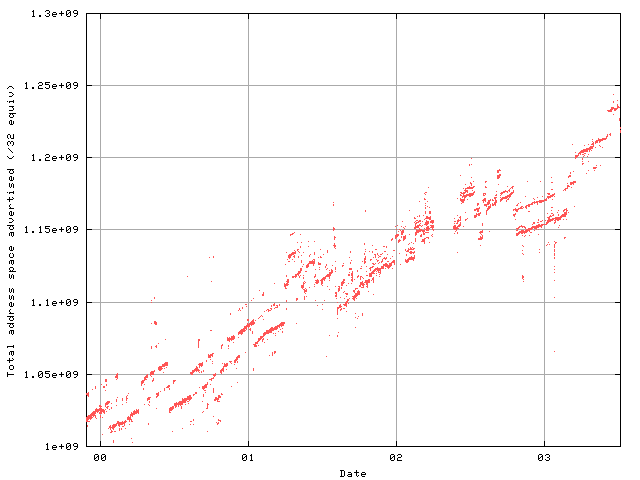
In terms of isolating a picture of address growth over time, its a bit better, but there's still a lot of instability.
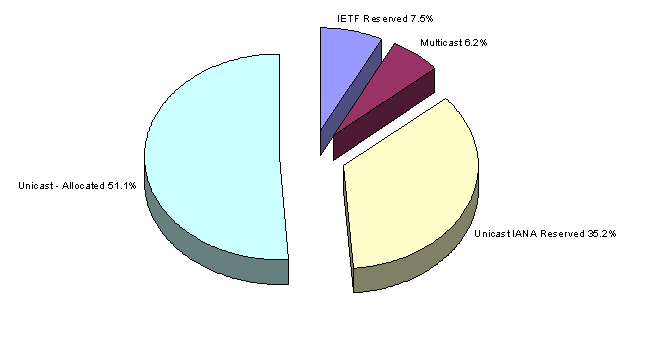
Using the most recent data from AS1221, we can now break up the allocated address space into "announced" and "unannounced" categories. This now reveals a clearer view of the complete disposition of the IPv4 address space
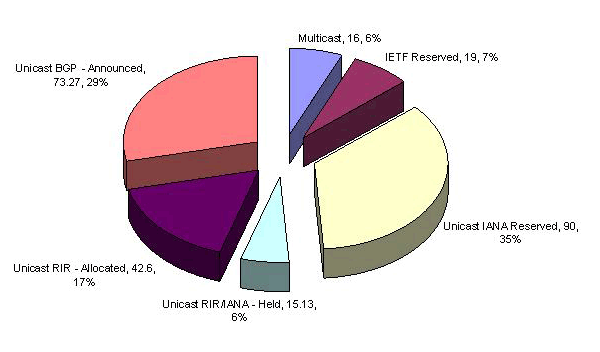
Some 29% of the space is announced in the BGP routing table, while 17% has been allocated to an end user or LIR but is not announced on the public Internet as being connected and reachable. 6% of the address space is held by the RIR's pending assignment or allocation (or at least there is no RIR recorded assignment of the space), while 35% of the total space remains in the IANA unallocated pool. A further 6% of the space is held in reserve by the IETF.
Returning to the view of total announced address space, as gathered from the perspective of AS1221, it is possible to plot a time series of the smoothed BGP data.
And, again using the same set of assumptions about the underlying growth model, where the growth in the total advertised address space is proportional to the size of the advertised address pool, extrapolate forward.
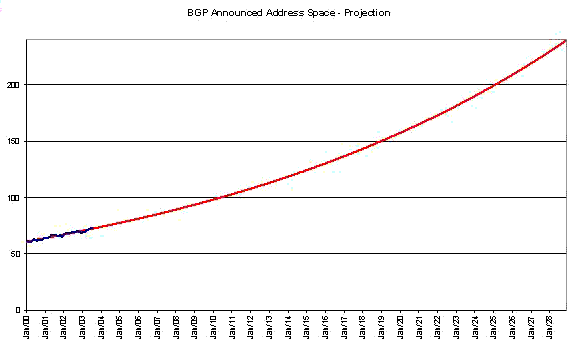
The outcome from this view, with a predicted address exhaustion date of around 2029, is slightly different to the RIR allocation prediction, but certainly consistent within the bounds of the relatively large level of uncertainty behind the assumptions being made to undertake the prediction.
The data sets from IANA, the RIR's and the BGP table can be directly compared.
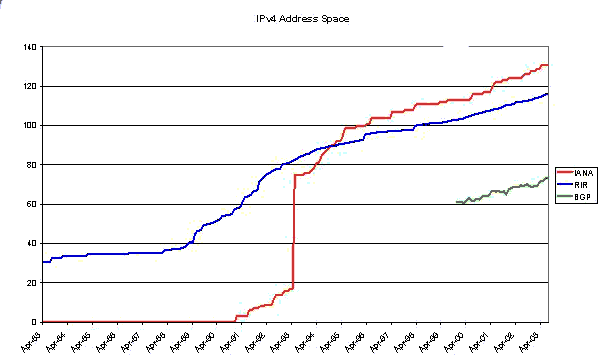
The range over which these three data sets can be directly compared is limited to the last three years. The next question is whether the three series are in step with each other, or whether there are different growth rates that are visible. One way to look at this is to look at the differences in the three series, which correspond to the amount of address space held by the RIR's pending future allocation or assignment and the amount of address space held by LIRs, ISPs or end users that is assigned but not announced
The LIR space of unannounced but allocated address space is a very large component of the total IPv4 address pool. It spans some 17% of the total address space, or the equivalent of 42 /8's. Is this a legacy of the address allocation policies in place before the RIR system came into operation in the mid 1990's, or some intrinsic inefficiency in the current system? If its the latter, then its likely that this pool of unannounced addresses will grow in direct proportion to the growth in the announced address space, while if its the former then the pool will remain relatively constant in size in the future.
We can look back through the RIR allocation data and look at the allocation dates of unannounced address space. This view indicates that the bulk of the space is a legacy of earlier address allocation practices, and that since 1997, when the RIR operation was fully established, there is an almost complete mapping of RIR allocated address space to BGP routing announcements. (There is a set of allocations where no data is recorded for the assignment, and these appear to be the result of pre-1995 allocations. They are shown here with a date of January 1983.) The recent 2003 data indicates that there is some lag between recent allocations and BGP announcements, most probably due to the time lag between an LIR receiving an allocation and subsequent assignments to end users and advertisement in the routing table.
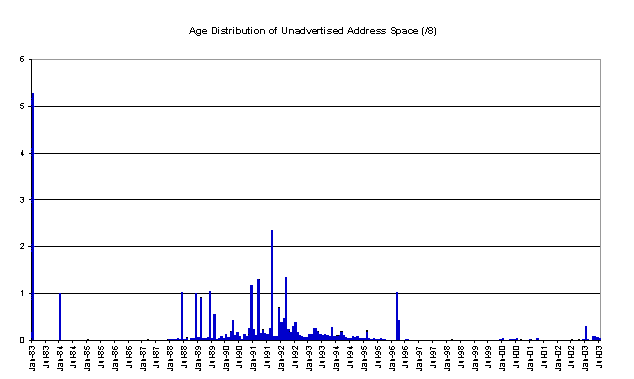
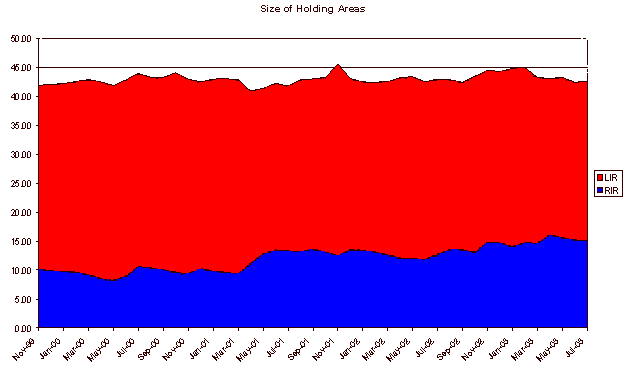
As this pool of addresses is large, its behaviour over time is critical to the entire forward projection. So if we take a cumulative view of the size of this unadvertised address pool we can gain some view as to whether this pool is continuing to grow, and at what rate.
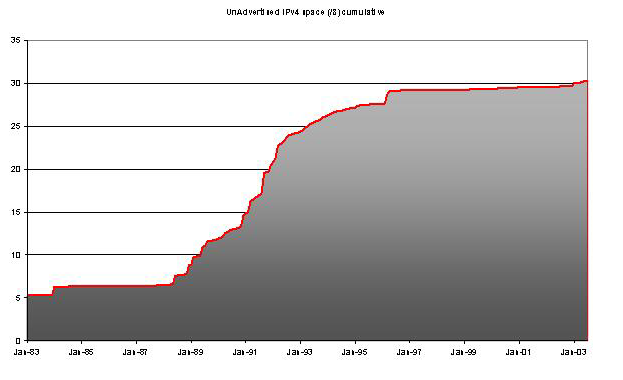
The slope of the growth of this unadvertised allocated address space in the period 1997 - 2002 is relatively small, so there is little growth in the unadvertised address space in recent time.
It is now possible to construct a model of the address distribution process, working backward from the BGP routing table address span using a number of assumptions:
The amount of RIR-allocated or assigned address space that remains unannounced in the BGP routing tables will increase slowly over time. The model used here is that of a slowly increasing percentage of the total announced space, plus a shorter term oscillation spanning 2 /8 blocks in size. The rationale for the slow increase in the LIR assignment inefficiency lies in consideration of the increasing costs of achieving high allocation efficiency as the size of the address pool increases
The amount of address space held by the RIR's grows slowly over time. There is a shorter period of oscillation imposed upon this pool, as each RIR will receive a /8 allocation from IANA when its existing managed pool is assigned beyond a set threshold (currently 80% assigned), and this additional allocated space is then assigned to the same level before a new IANA allocation is made to the RIR. The rationale for the gradual increase in the pool size again lies in the slowly increasing assignation inefficiencies associated with managing increasingly larger address pools.
From the sum of the BGP table size and the LIR holding pool we can derive the total RIR-managed address pool. To this number is added the RIR holding pool low size and its low threshold where a further IANA-allocation is required. This allows a view of the entire system, projected forward over time, where the central driver for the projection is the growth in the network itself, as described by the size of the announced IPv4 address space.
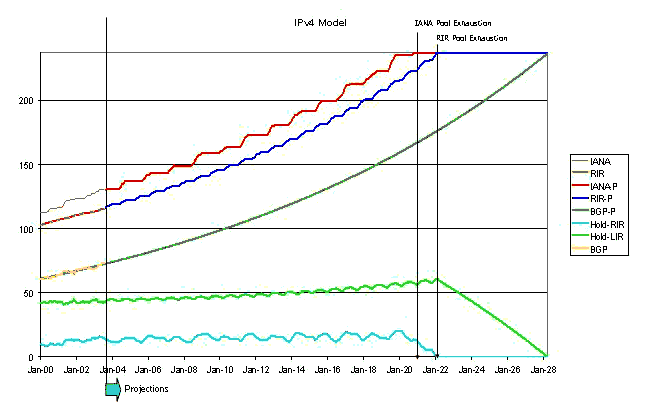
It would appear that the point of effective exhaustion is the point where the RIR's exhaust available address space to assign. In this model, RIR exhaustion of the unallocated address pool would occur in 2022.
Of course such projections are based on the underlying assumption that tomorrow will be much like today, and the visible changes that have occurred in the past will smoothly translate to continued change in the future. There are some obvious weaknesses in this assumption, and many events could disrupt this prediction.
Some disruptions could be found in technology evolution. An upward shift in address take up rates because of an inability of NATs to support emerging popular applications is a possibility. The use of personal mobile IP devices (such as PDAs in their various formats) using public IPv4 addresses would place a massive load on the address space, simply due to the very large volumes associated with deployment of this particular technology.
Other disruptions have a social origin, such as the boom and bust cycle of Internet expansion in the late 1990's and early 2000's. Another form of disruption in this category could be the adoption of a change in the distribution function. The current RIR and LIR distribution model has been very effective in limiting the amount of accumulation of address space in idle holding pools, and in allocating addresses based on efficiency of utilization and conformance to a workable hierarchical model of address-based routing. Other forms of global resource distribution use a geo-political framework, where number blocks are passed to national entities, and further distribution is a matter of local policy (such a system is used in the E.164 number space for telephony). The disruptive nature of such a change would be to immediately increase the number of 'holding' points in the distribution system, locking away larger pools of address space from being deployed and advertised and generating a significant upward change in the overall address consumption rates due to an increase in the inefficiency of the altered distribution function.Assuming a smooth continuity of growth in demand where growth rates are proportional to the size of the Internet, and assuming a continuation of the current utilization efficiency levels in the Internet, and assuming a continuing balance between public address utilization and various forms of address compression, and assuming the absence of highly disruptive events, then it would appear that the IPv4 world, in terms of address availability, could continue for another two decades or so without reaching any fixed boundary.
Is the IPv4 sky falling? A further two decades out is way over the event horizon for any form of reliable prediction in this business. So if we restrict the question to at most the next decade, then we can answer with some level of comfort that there is really no visible evidence of IPv4 exhausting its address pool within this timeframe.
Or at least that's the way I read the cracks in my Oracle Bone!
The above views do not represent the views of the author’s employer, the Telstra Corporation. They were possibly the opinions of the author at the time of writing this article, but things always change, including the author's opinions!
GEOFF HUSTON holds a B.Sc. and a M.Sc. from the Australian National University. He has been closely involved with the development of the Internet for the past decade, particularly within Australia, where he was responsible for the initial build of the Internet within the Australian academic and research sector. Huston is currently the Chief Scientist in the Internet area for Telstra. He is also a member of the Internet Architecture Board, and is the Secretary of the APNIC Executive Committee. He was an inaugural Trustee of the Internet Society, and served as Secretary of the Board of Trustees from 1993 until 2001, with a term of service as chair of the Board of Trustees in 1999 – 2000. He is author of The ISP Survival Guide, ISBN 0-471-31499-4, Internet Performance Survival Guide: QoS Strategies for Multiservice Networks, ISBN 0471-378089, and coauthor of Quality of Service: Delivering QoS on the Internet and in Corporate Networks, ISBN 0-471-24358-2, a collaboration with Paul Ferguson. All three books are published by John Wiley & Sons.
E-mail: gih@telstra.net