|
The ISP Column
A column on things Internet
|
|
|
Other Formats:
|
|
|
|
|
Addressing 2013 - That Was The Year That Was
February 2014
Geoff Huston
Time for another annual roundup from the world of IP addresses. What happened in 2013 and what is likely to happen in 2014? This is an update to the reports prepared at the same time in previous years, so lets see what has changed in the past 12 months in addressing the Internet, and look at how IP address allocation information can inform us of the changing nature of the network itself.
I’ve written up the annual summary of address allocations for a number of years, and it’s a challenge to come up with a novel title each year. This one, That Was The Year That Was is a reference to an album recorded in 1965 featuring Tom Lehrer with songs he originally wrote for the NBC news commentary television program That Was The Week That Was. In a radio interview in 2006 Tom said: “Always predict the worst, and you'll be hailed as a prophet, a friend of mine said.”
The Internet is inexorably changing, and the predominate theme of today's network is the dramatic uptake of the mobile device. Whether it’s an Apple iPhone, or a Samsung Galaxy SIII, a Nokia Lumina, or any one of a myriad of other “smart phones” or “tablets” these mobile devices that have transformed the mobile phone onto an Internet device, the sheer volume of deployment of these devices has been the dominant factor in the growth of the Internet in 2013. But its not just mobile devices, as there has been a new wave of household consumer devices, notably including games consoles and televisions, that are also fuelling growth. We’re also seeing the initial consumer offerings in the Internet of things, with internet-based home lighting systems and other forms of household automation that involve sensors and appliance management, such as energy management, irrigation management and similar.
In December 2013 Gartner released its estimate of the worldwide device sales for PCs, tablets, and mobiles, predicting a total shipment volume of some 2.47 billion units, compares with 2.3 billion units in 2013. The bulk of these units are mobile phones (some 1.9 billion units) with the balance evenly divided between traditional personal computers and tablets. Unsurprisingly, PC market is declining, as consumers switch to use tablets and other mobile devices. Within this market segment its now a Unix (or to be precise Android) world, with some 1.1 billion units shipped with Android, compared with an estimated 360 million Windows devices.
And then there is the all the embedded devices that collectively have been labelled “The Internet of Things”. Gartner have projected that this world of chattering silicon would get to 30 billion devices by 2020. Cisco upped the ante with their prediction of 50 billion such connected things by 2020, and Morgan Stanley went further with a prediction of 75 billion devices connected to the Internet in that time. Other reports have placed this number as high as 100 billion. But its challenging to place these projected numbers into an analytical framework.
The large scale deployment exercised for residential broadband has achieved market saturation in many of the more developed parts of the world where the GDP per capita exceeds some $20,000. Where the GDP per capita is lower the levels of broadband penetration are also lower, perhaps because of the higher rural populations and the basic issues of affordability.
When you put together the mobile and wired numbers together, and look at the population Internet users, the numbers driving growth are still dramatic. The estimated total number of Internet users worldwide grew from 2.30 billion at the start of the year to 2.76 billion by the end of the year, a growth of some 460 million users through 2013.
And of course there is also the estimate of how many devices are connected to today’s Internet. One source of this measurement is Cisco, who estimate that there are some 705 million objects connected to the Internet in January 2014. The other source of such data, the Internet Domain Survey, estimates some 996 million “hosts” advertised in the DNS. A figure of somewhere around 700 million to 1 billion connected devices is perhaps a reasonable estimate for January 2014.
Where are these devices? How is the Internet changing as a result of this activity? Let's use the lens of address allocation records to see what the address allocation records can tell us as to how the Internet fared in 2013.
IPv4 in 2013
In terms of the allocation of public address space as a metric, pace of growth of the Internet slowed down substantially in 2012. The allocation of 65 million addresses in 2013 on top of a base of 3,472 million addresses that were already allocated at the start of the year represents a growth rate of 1.9% for the year. This is approximately one quarter of the growth in 2010 (the last full year before the onset of address exhaustion), and represents the lowest relative growth rate we've seen in recent years.
This low total is due to the exhaustion of available IPv4 address space in the regions served by APNIC (Asia Pacific) and the RIPE NCC (Europe and the Middle East), in previous years. The three RIRs with remaining address pools (AFRINIC, ARIN and LACNIC), together serve 2 billion of the world’s 7 billion population, so on a pro-rata basis based on population counts the 2013 allocation level of 65 million addresses by these three RIRs is approximately equivalent to a global allocation total of some 230 million addresses. This points to an observation that where there are available addresses, the address allocation rate continues at levels that are commensurate with the peak global level of 2010.
| 2005 | 2006 | 2007 | 2008 | 2009 | 2010 | 2011 | 2012 | 2013 | |
| Allocated IPv4 Addresses (Millions) | 174.4 | 168.1 | 203.9 | 203.3 | 189.4 | 248.8 | 201.0 | 114.9 | 65.1 |
| Relative Annual Growth | 8.0% | 7.7% | 8.8% | 8.0% | 6.9% | 8.4% | 6.3% | 3.4% | 1.9% |
Table 1 - IPv4 Allocated addresses by year
| RIR \ YEAR | 2005 | 2006 | 2007 | 2008 | 2009 | 2010 | 2011 | 2012 | 2013 |
|---|---|---|---|---|---|---|---|---|---|
| APNIC | 53.6 | 51.4 | 69.6 | 87.8 | 86.9 | 120.2 | 105.2 | 1.0 | 1.3 |
| RIPE NCC | 61.2 | 55.0 | 60.7 | 44.0 | 43.4 | 56.0 | 43.1 | 40.0 | 2.0 |
| ARIN | 47.2 | 46.5 | 53.0 | 57.1 | 41.1 | 45.2 | 23.5 | 45.0 | 26.5 |
| LACNIC | 10.4 | 10.7 | 14.2 | 12.0 | 10.5 | 13.0 | 24.4 | 21.0 | 28.5 |
| AFRINIC | 0.9 | 2.6 | 5.5 | 1.6 | 5.9 | 8.5 | 9.2 | 7.9 | 6.8 |
In 2013 APNIC allocated 1.3 million addresses, up by 30% from the 1.0 million that were allocated in 2012. APNIC effectively exhausted its general use pool of addresses in April 2011, and since then it has been operating under the terms of a "last /8" policy that limits each allocation to at most 1024 addresses. APNIC recorded some 1,596 individual address allocations in 2013, with an average allocation size of 845 addresses per allocation.
The RIPE NCC also exhausted its general use pool of addresses in mid-September 2012. The RIPE NCC allocated some 2.0 million addresses in 2013, and recorded 1,913 allocations. The average allocation size was 1069 addresses per allocation. There were two entries in the allocation data significantly larger than the last /8 policy’s /22 maximum, a /16 and a /17 which are drawn from 151.216.0.0/13, a block used by the RIPE NCC for temporary assignments. If these two temporary assignments are removed, the remaining 1,911 allocations have an average size of 1,018 addresses.
But what of the other regions? In the case of ARIN the total allocated address count has approximately halved from the 2012 levels. In 2012 the largest allocation record was for a /9 (8M addresses), while in 2013 the largest allocation was for a /11 (2M addresses). The allocations made to the largest entities in the region tend to heavily influence the final outcome in this region. The LACNIC allocation level continues to climb, and the allocation total of 28.5M addresses in 2013 is the largest allocation level for this RIR. On the other hand, the AFRINIC total fell slightly, from 7.9M addresses in 2012 to 6.8M addresses in 2013.
Which economies are leading this continued growth in IPv4 services?
| Rank | 2009 | 2010 | 2011 | 2012 | 2013 | |||||
|---|---|---|---|---|---|---|---|---|---|---|
| 1 | China | 50.67 | China | 45.2 | China | 53.07 | USA | 28.2 | USA | 25.0 |
| 2 | USA | 38.55 | USA | 42.32 | USA | 21.21 | Canada | 16.7 | Brazil | 17.4 |
| 3 | Japan | 11.04 | Rep.Korea | 25.73 | Japan | 16.91 | Brazil | 8.4 | Colombia | 3.8 |
| 4 | Rep.Korea | 10.95 | Japan | 10.02 | Rep.Korea | 7.68 | Russia | 5.3 | Argentina | 1.6 |
| 5 | Russia | 5.46 | Australia | 9.63 | Indonesia | 7.09 | Iran | 4.5 | Egypt | 1.6 |
| 6 | Brazil | 4.19 | India | 9.43 | Brazil | 6.29 | Germany | 3.4 | Canada | 1.4 |
| 7 | UK | 4.19 | UK | 8.13 | India | 6.01 | South Africa | 3.4 | Nigeria | 1.2 |
| 8 | Italy | 4.16 | Germany | 6.97 | France | 5.39 | Italy | 3.3 | Chile | 1.1 |
| 9 | France | 3.85 | Russia | 6.46 | Russia | 5.02 | Colombia | 2.6 | Mexico | 1.1 |
| 10 | Germany | 3.6 | Brazil | 6.29 | Germany | 4.92 | Romania | 2.6 | Seychelles | 1.0 |
Table 3 - IPv4 Allocated addresses - Top 10 Economies
With the exhaustion of IPv4 addresses from APNIC and the RIPE NCC regions, China, Korea, Japan and India no longer are in the top 10 countries for IPv4 address allocations, nor are Russia, Germany, Italy and Romania. Instead, we see countries in the Americas and Africa take their place.
There is one apparent anomaly in this list, namely an allocation of more than 1 million addresses to the Seychelles., an archipelago in the Indian Ocean with some 90,000 inhabitants. There was a single allocation of 1M addresses in July 2013 to an entity named “Cloud Innovation”, which appears to be a cloud services platform which is served via a South African-headquartered telco. The increasing trend to virtualised services and the consequent increase in demand for cloud infrastructure points to a weakness in this type of analysis. While the address registry records note the country of the headquarters of the entity who received the address assignment, there are few , if any, constraints placed on where and how the addresses and the services hosted on platforms using these addresses may be used and accessed. This points to using some caution in taking these per-country allocations too literally.
2013 vs 2012 – A Week-by-Week Comparison of IPv4 Allocations
To what extent did the allocations performed in IPv4 in 2013 differ from those in 2012? The following figures show this for all IPv4 allocations, then per RIR, using a week-by-week breakdown.
|
|
|
|
|
|
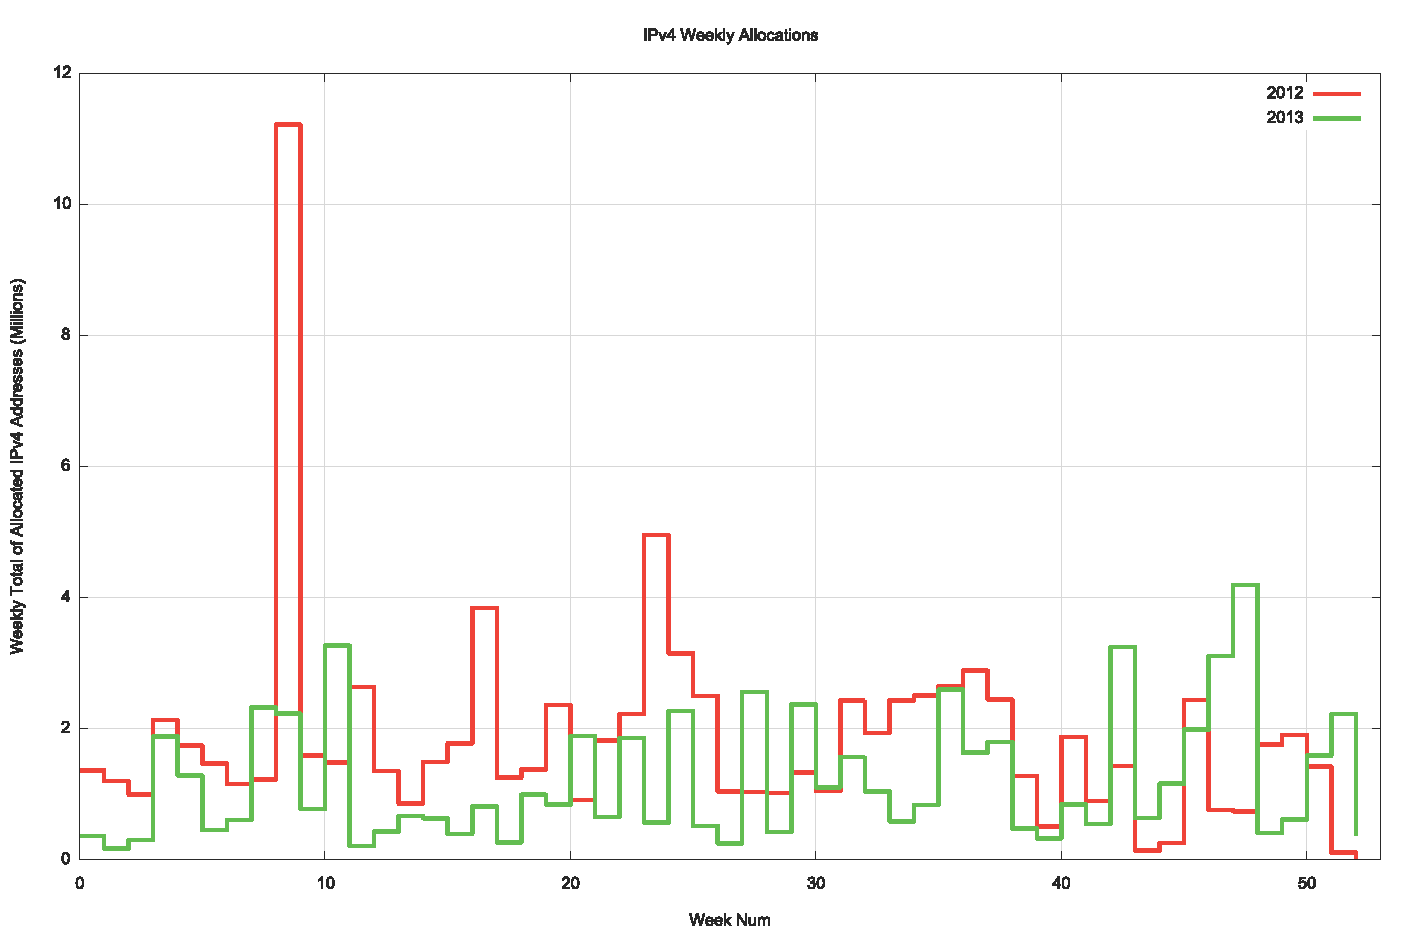
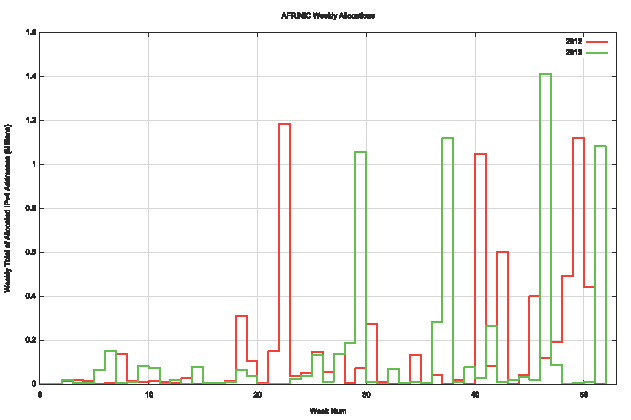
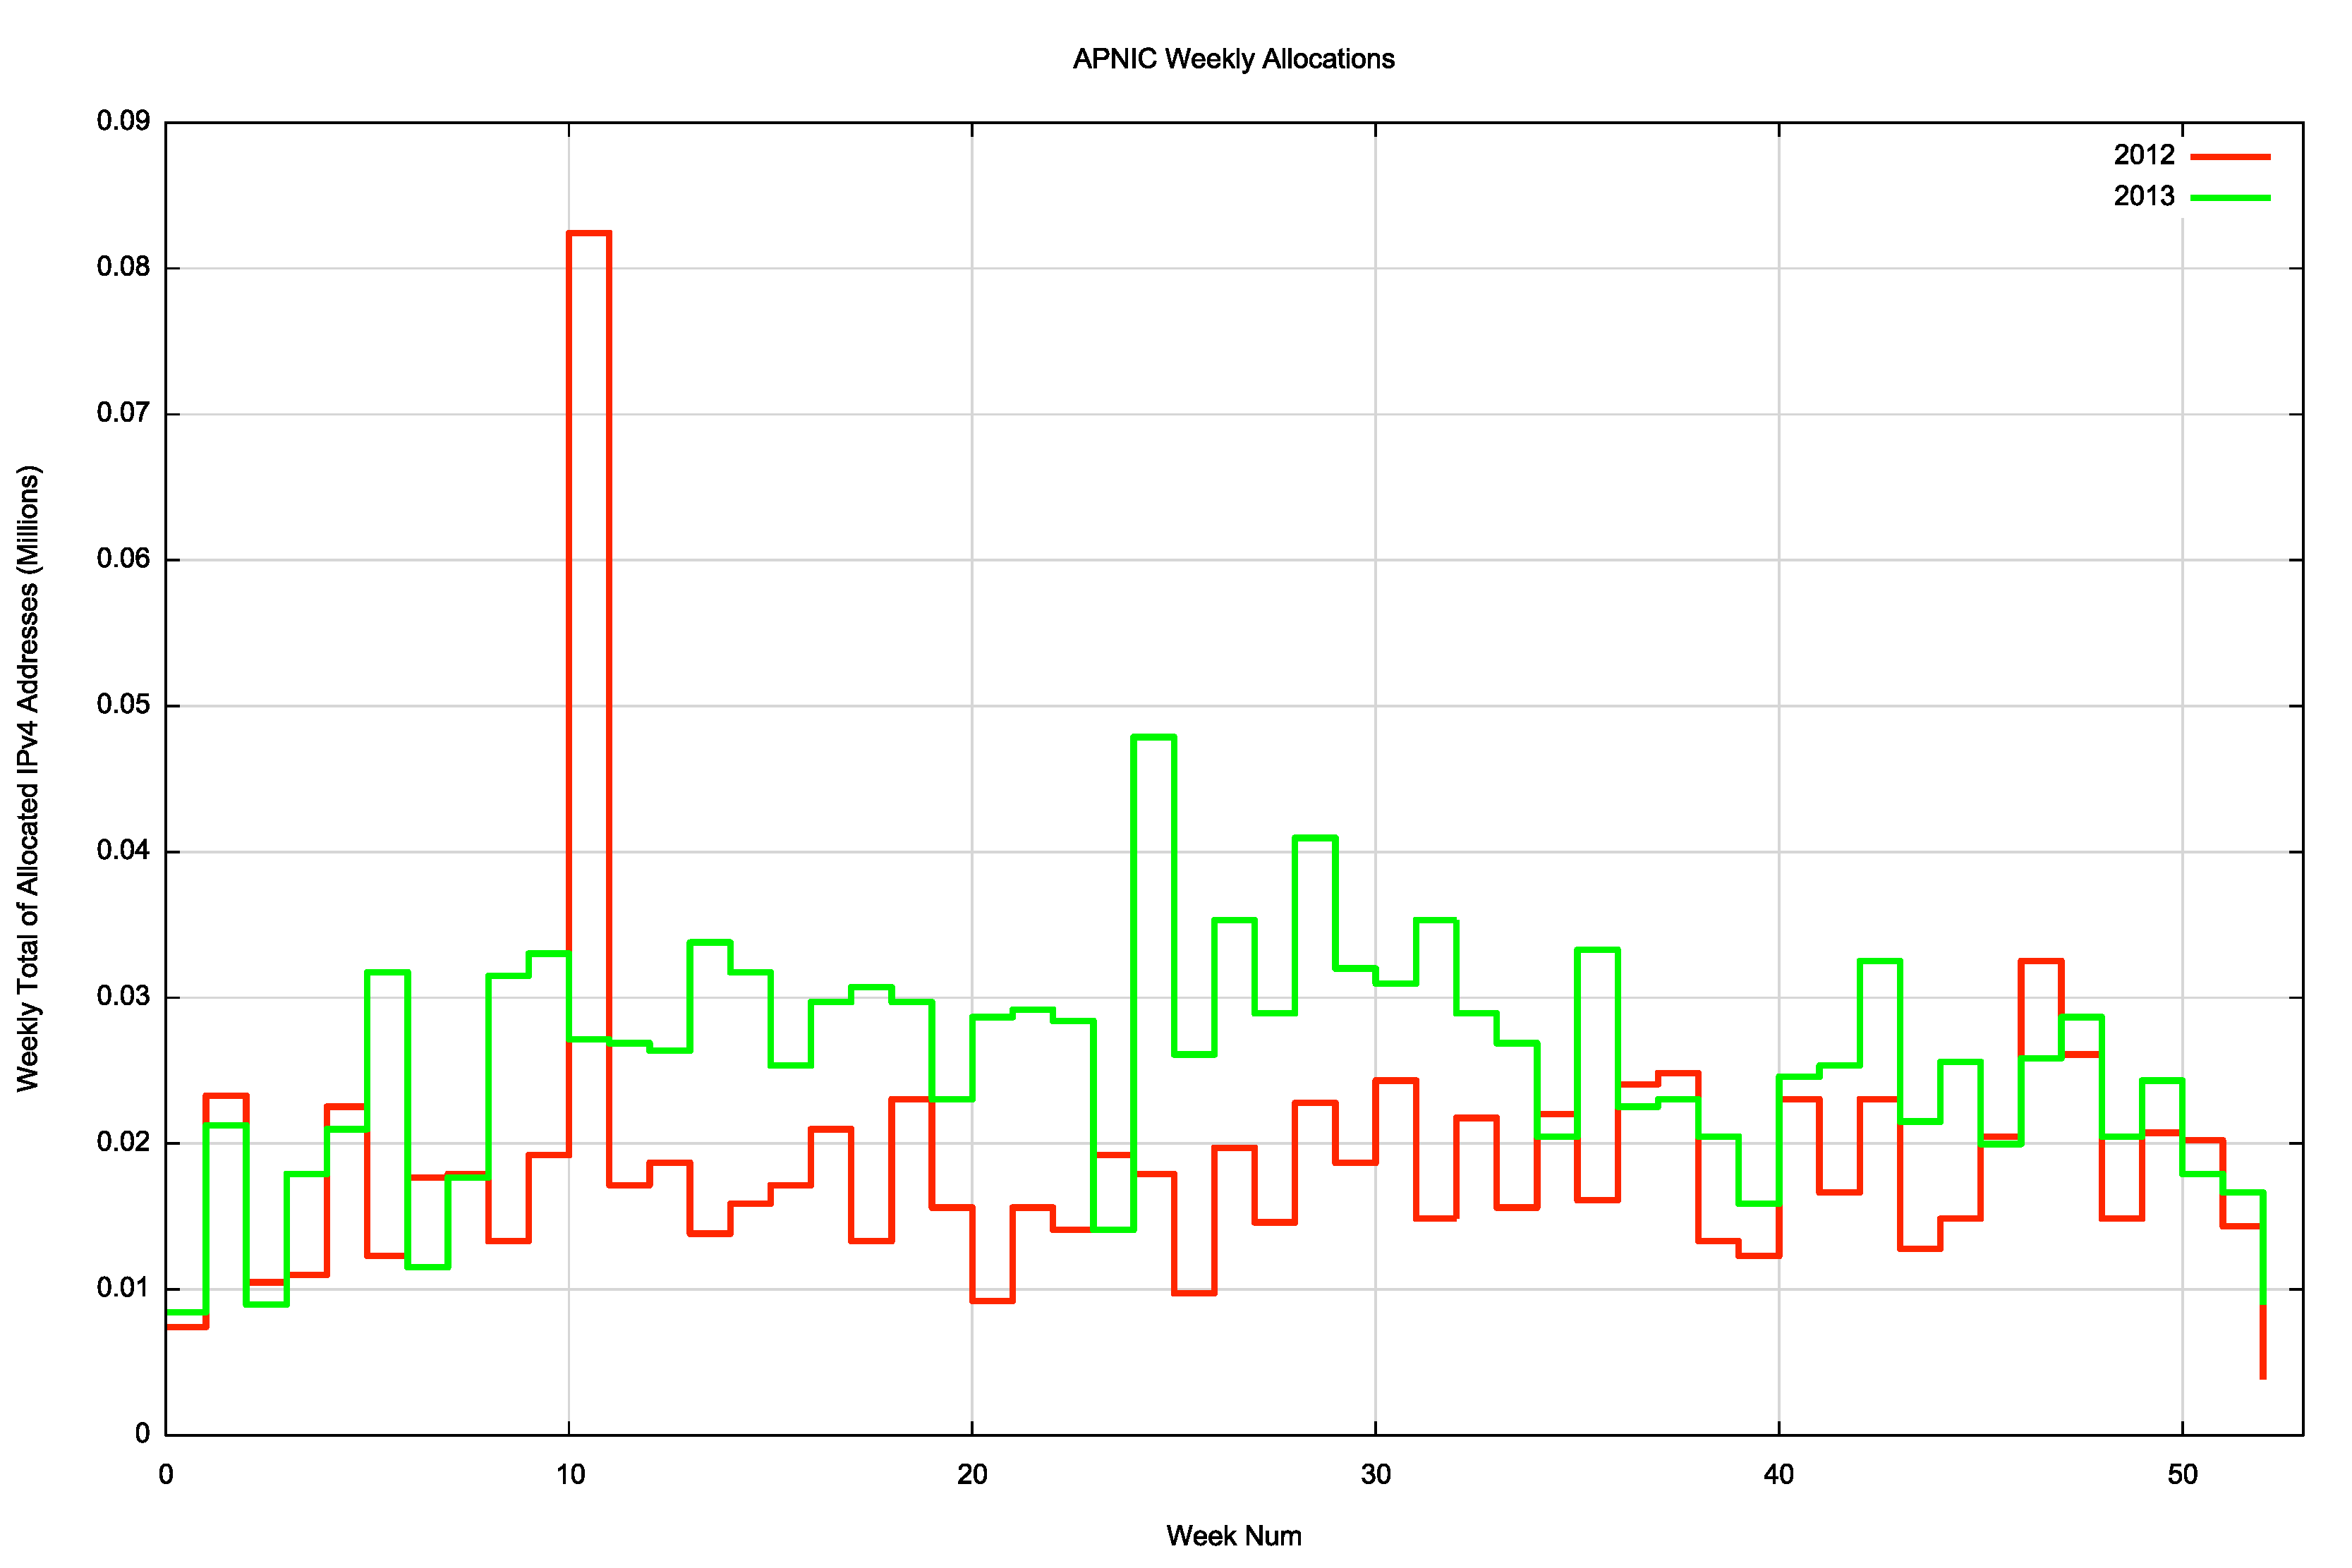
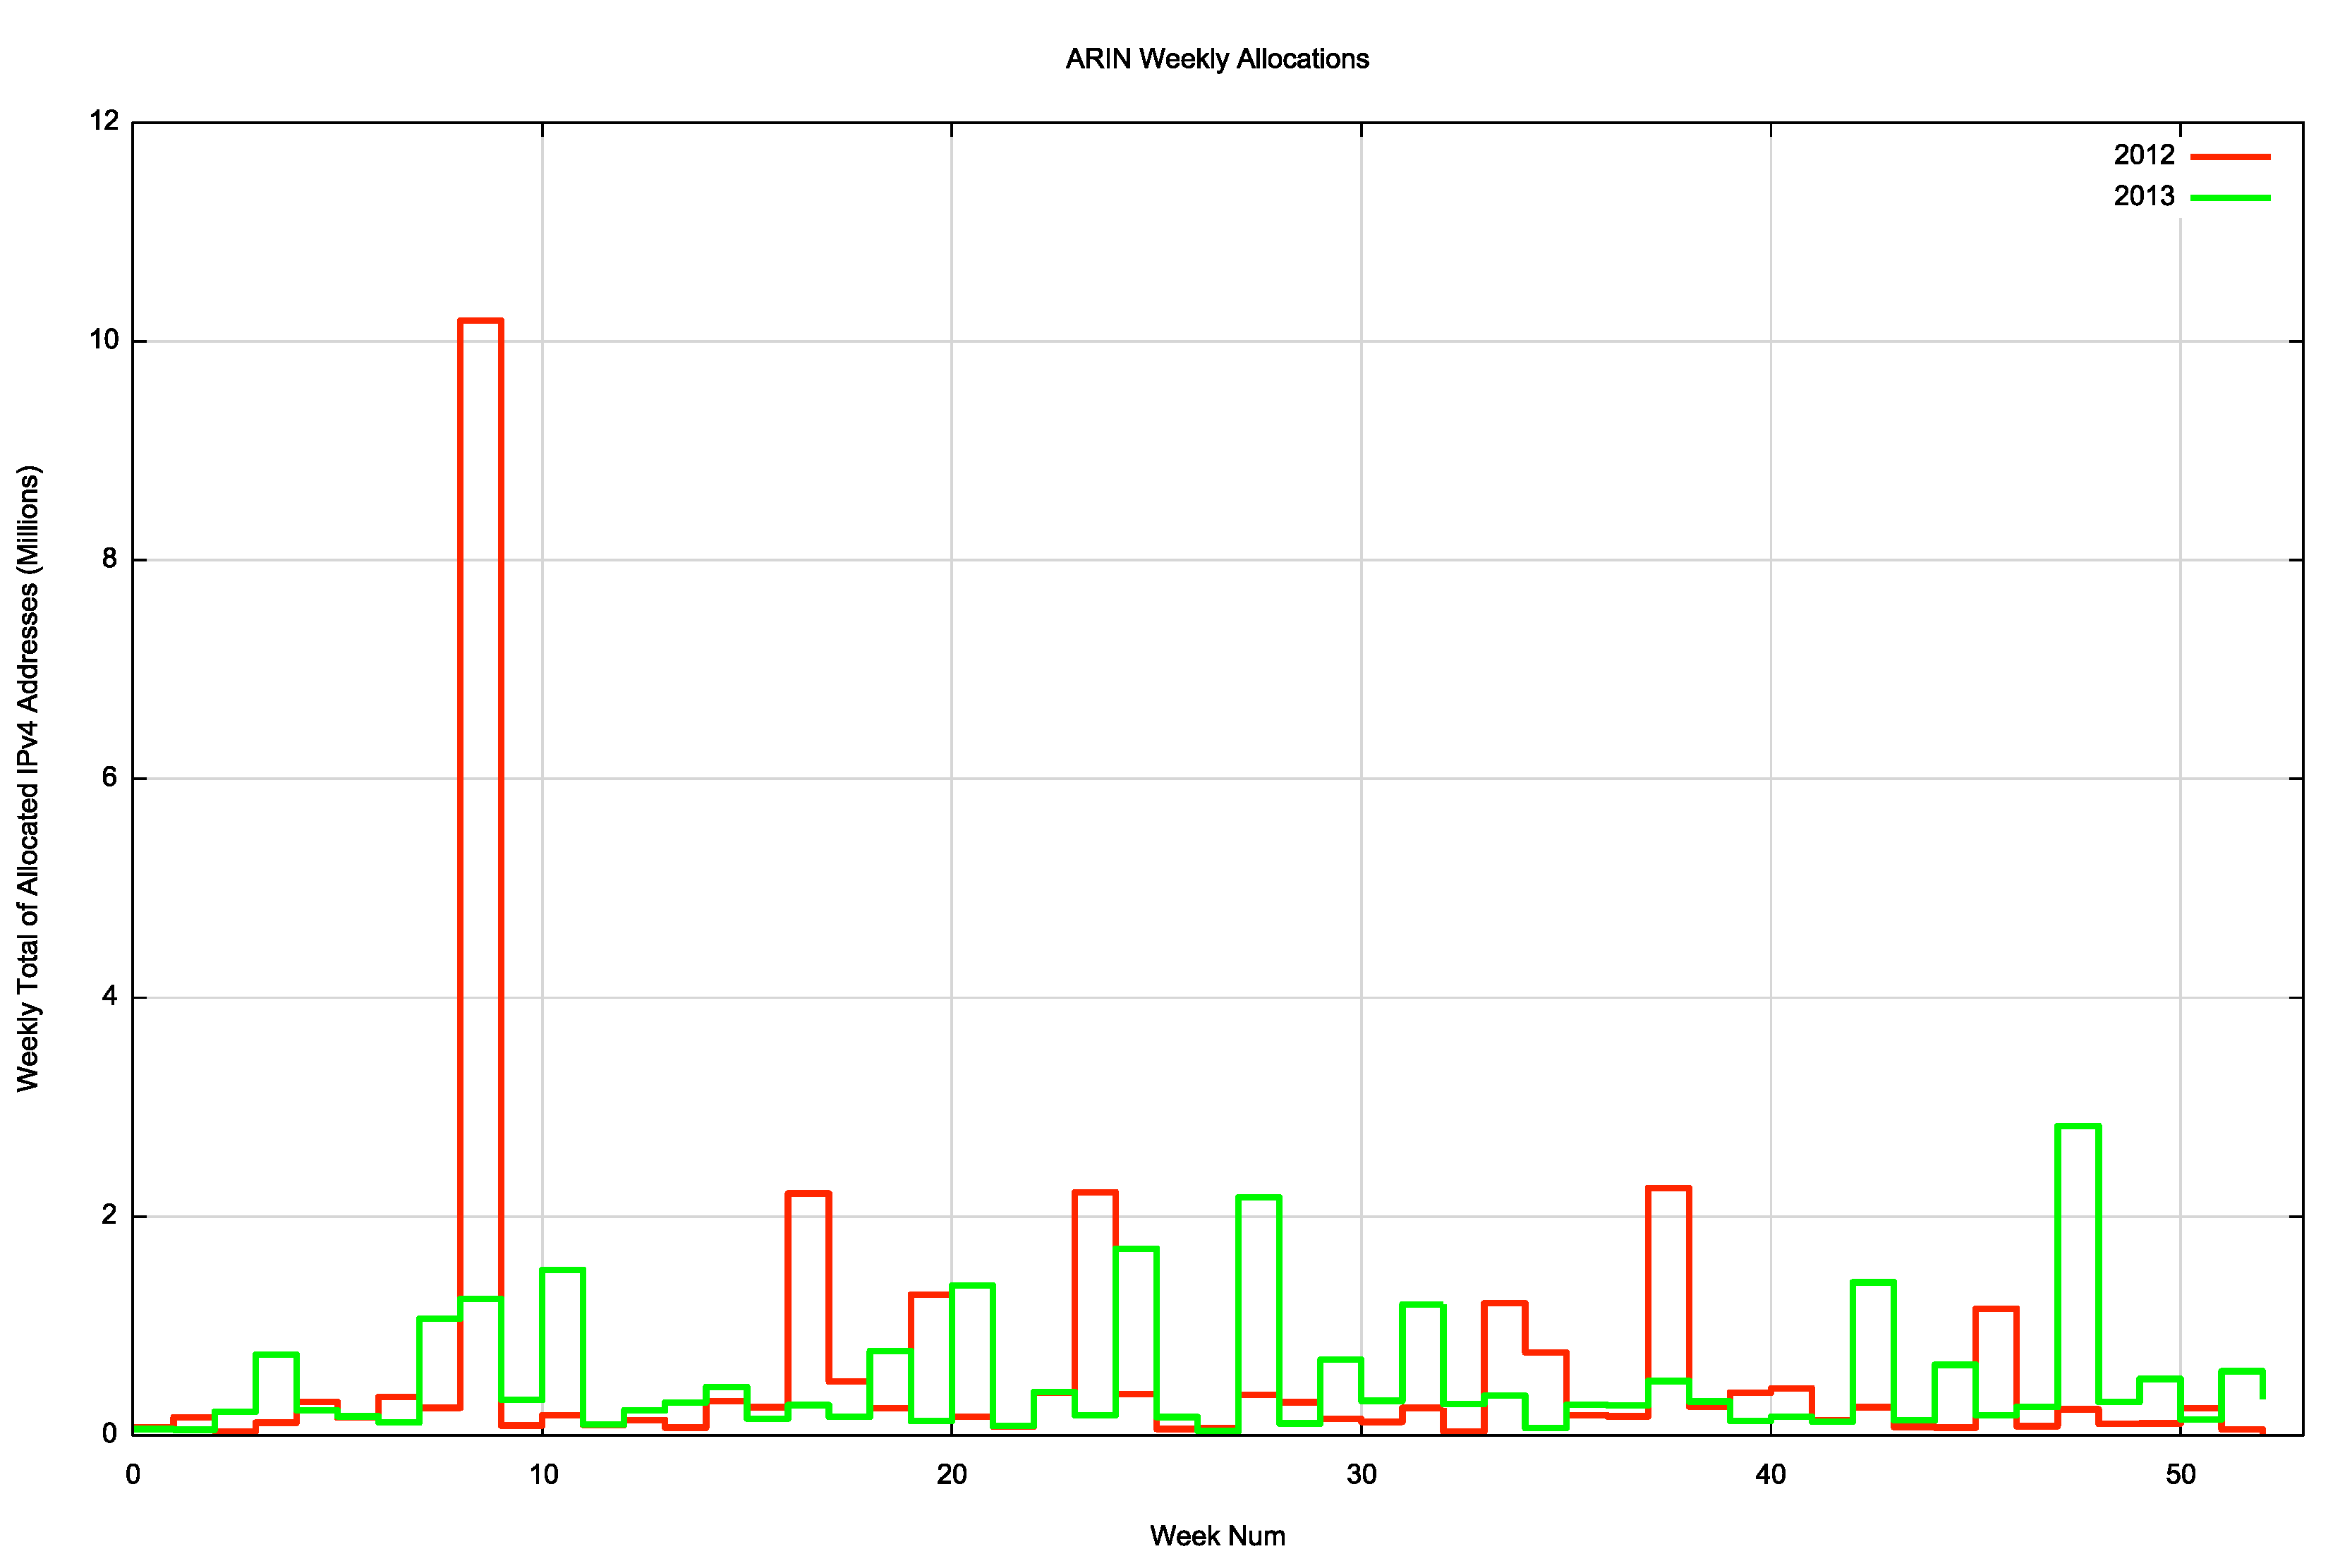
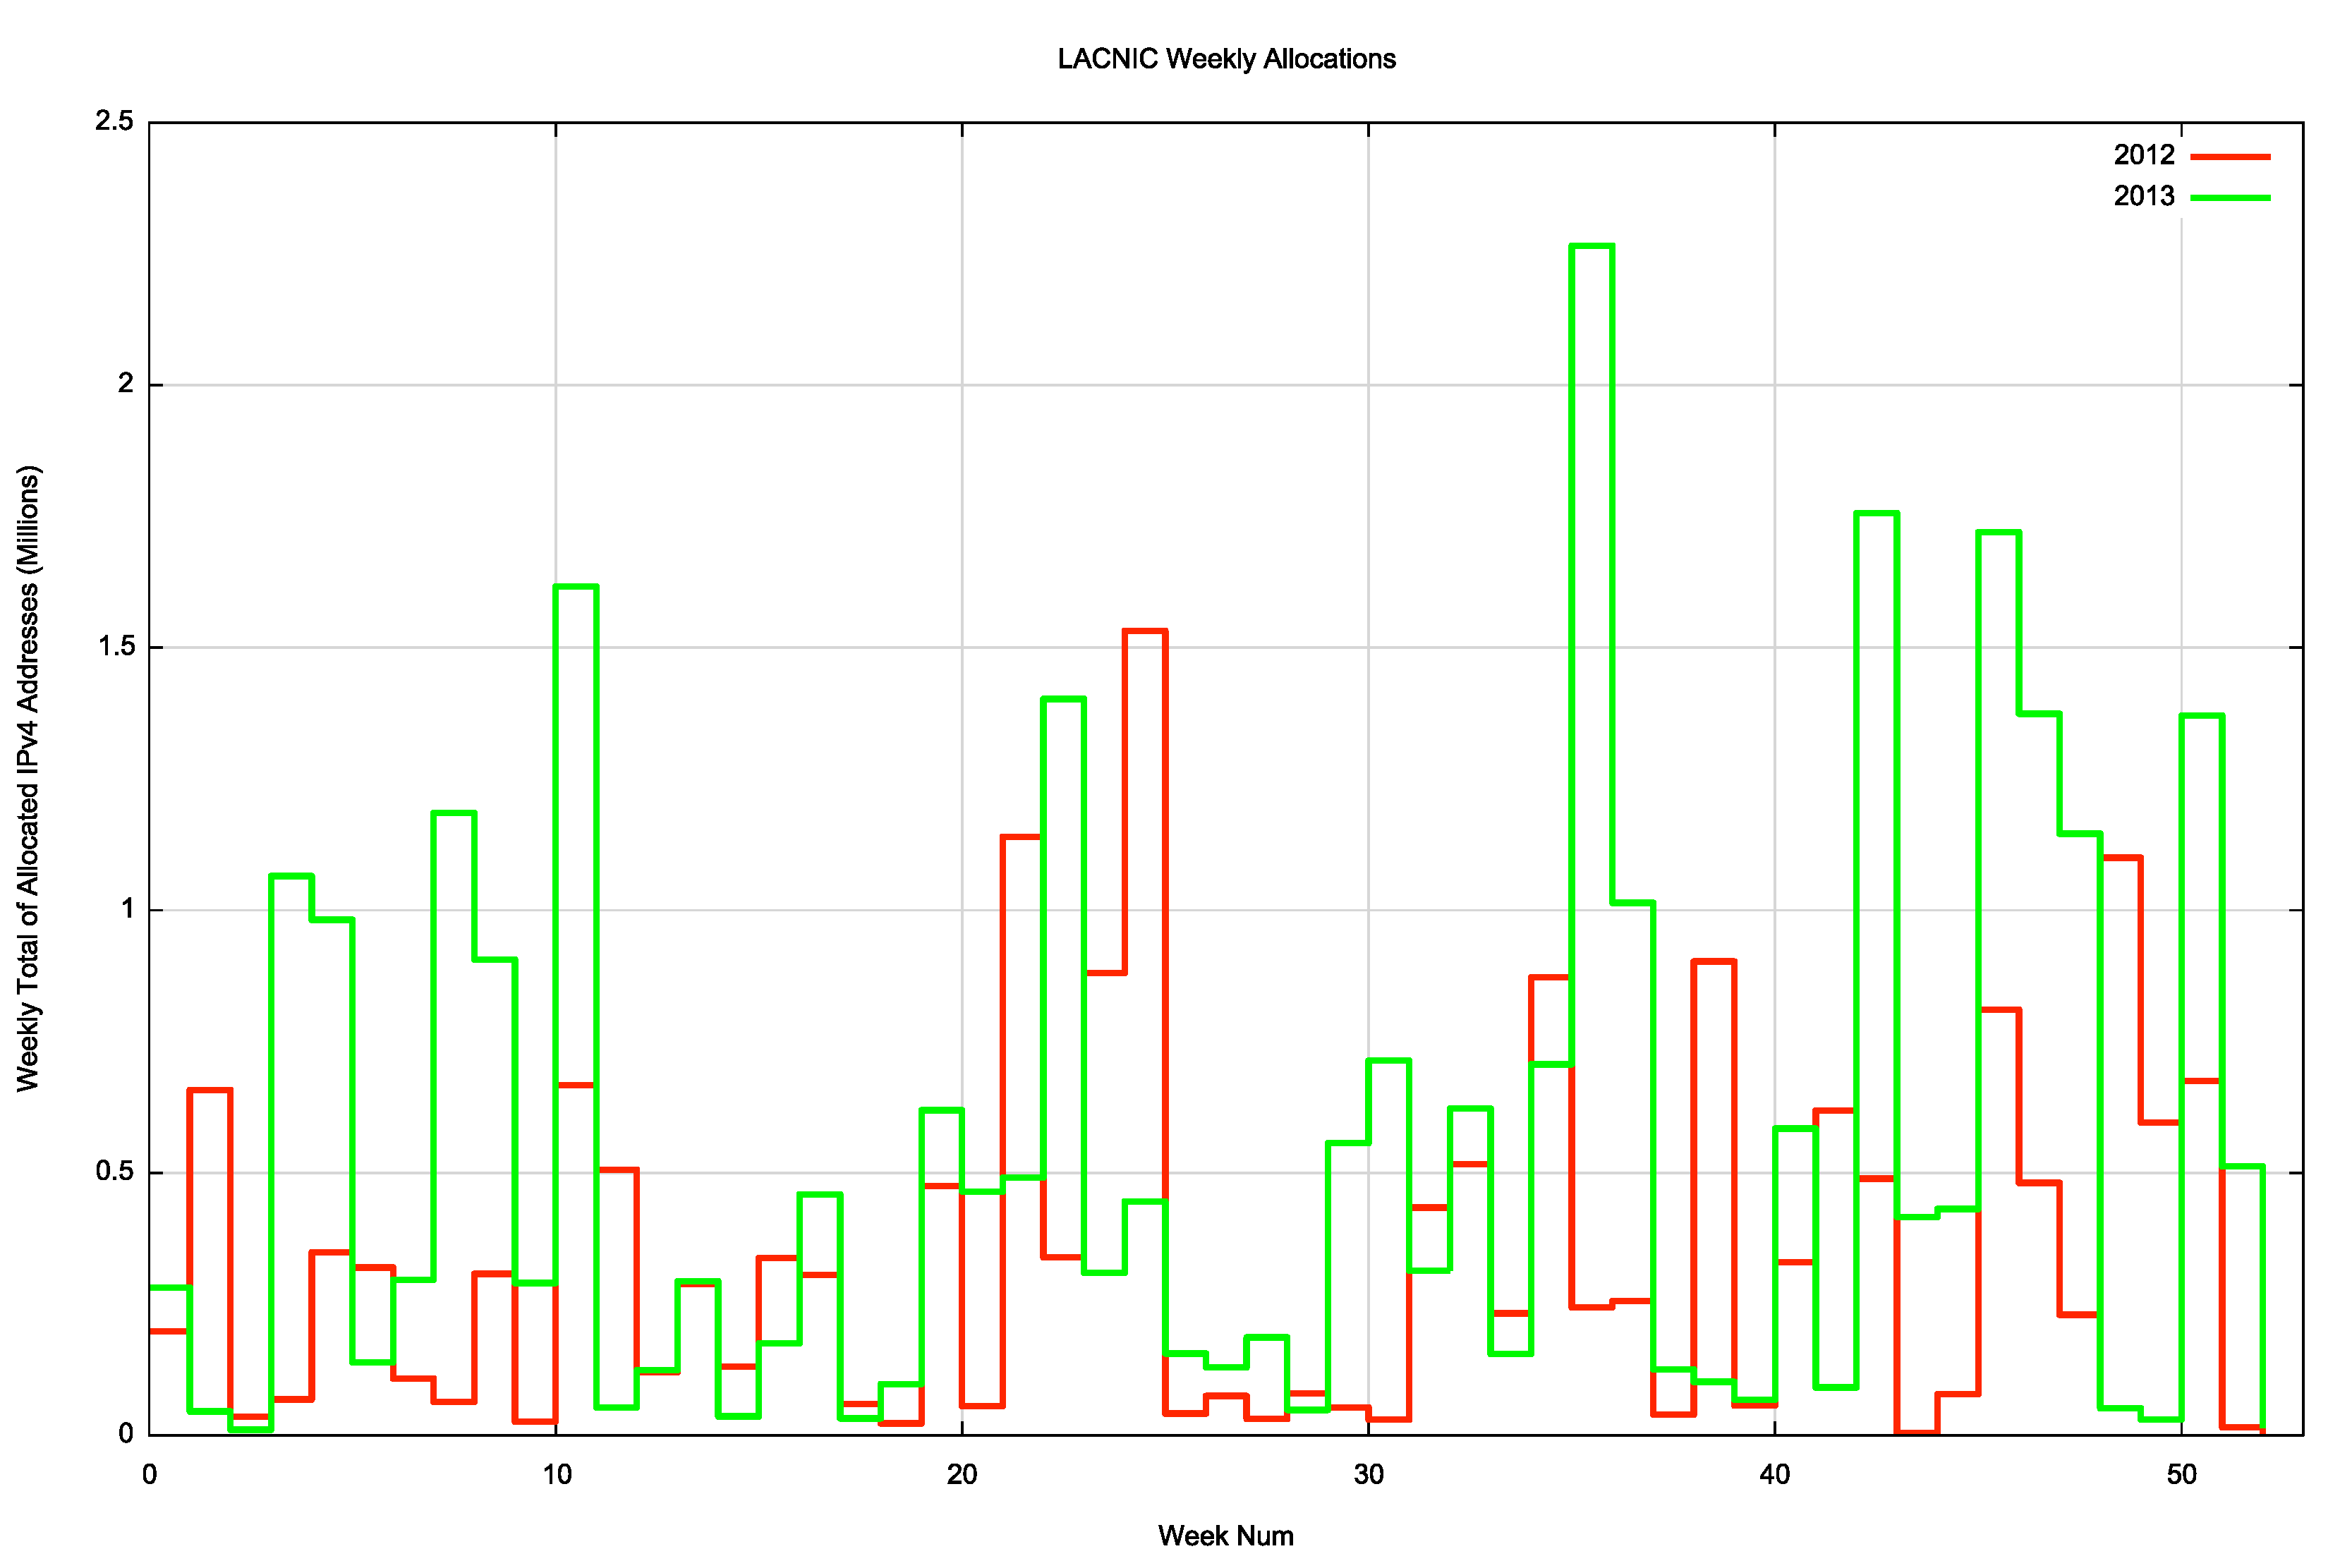
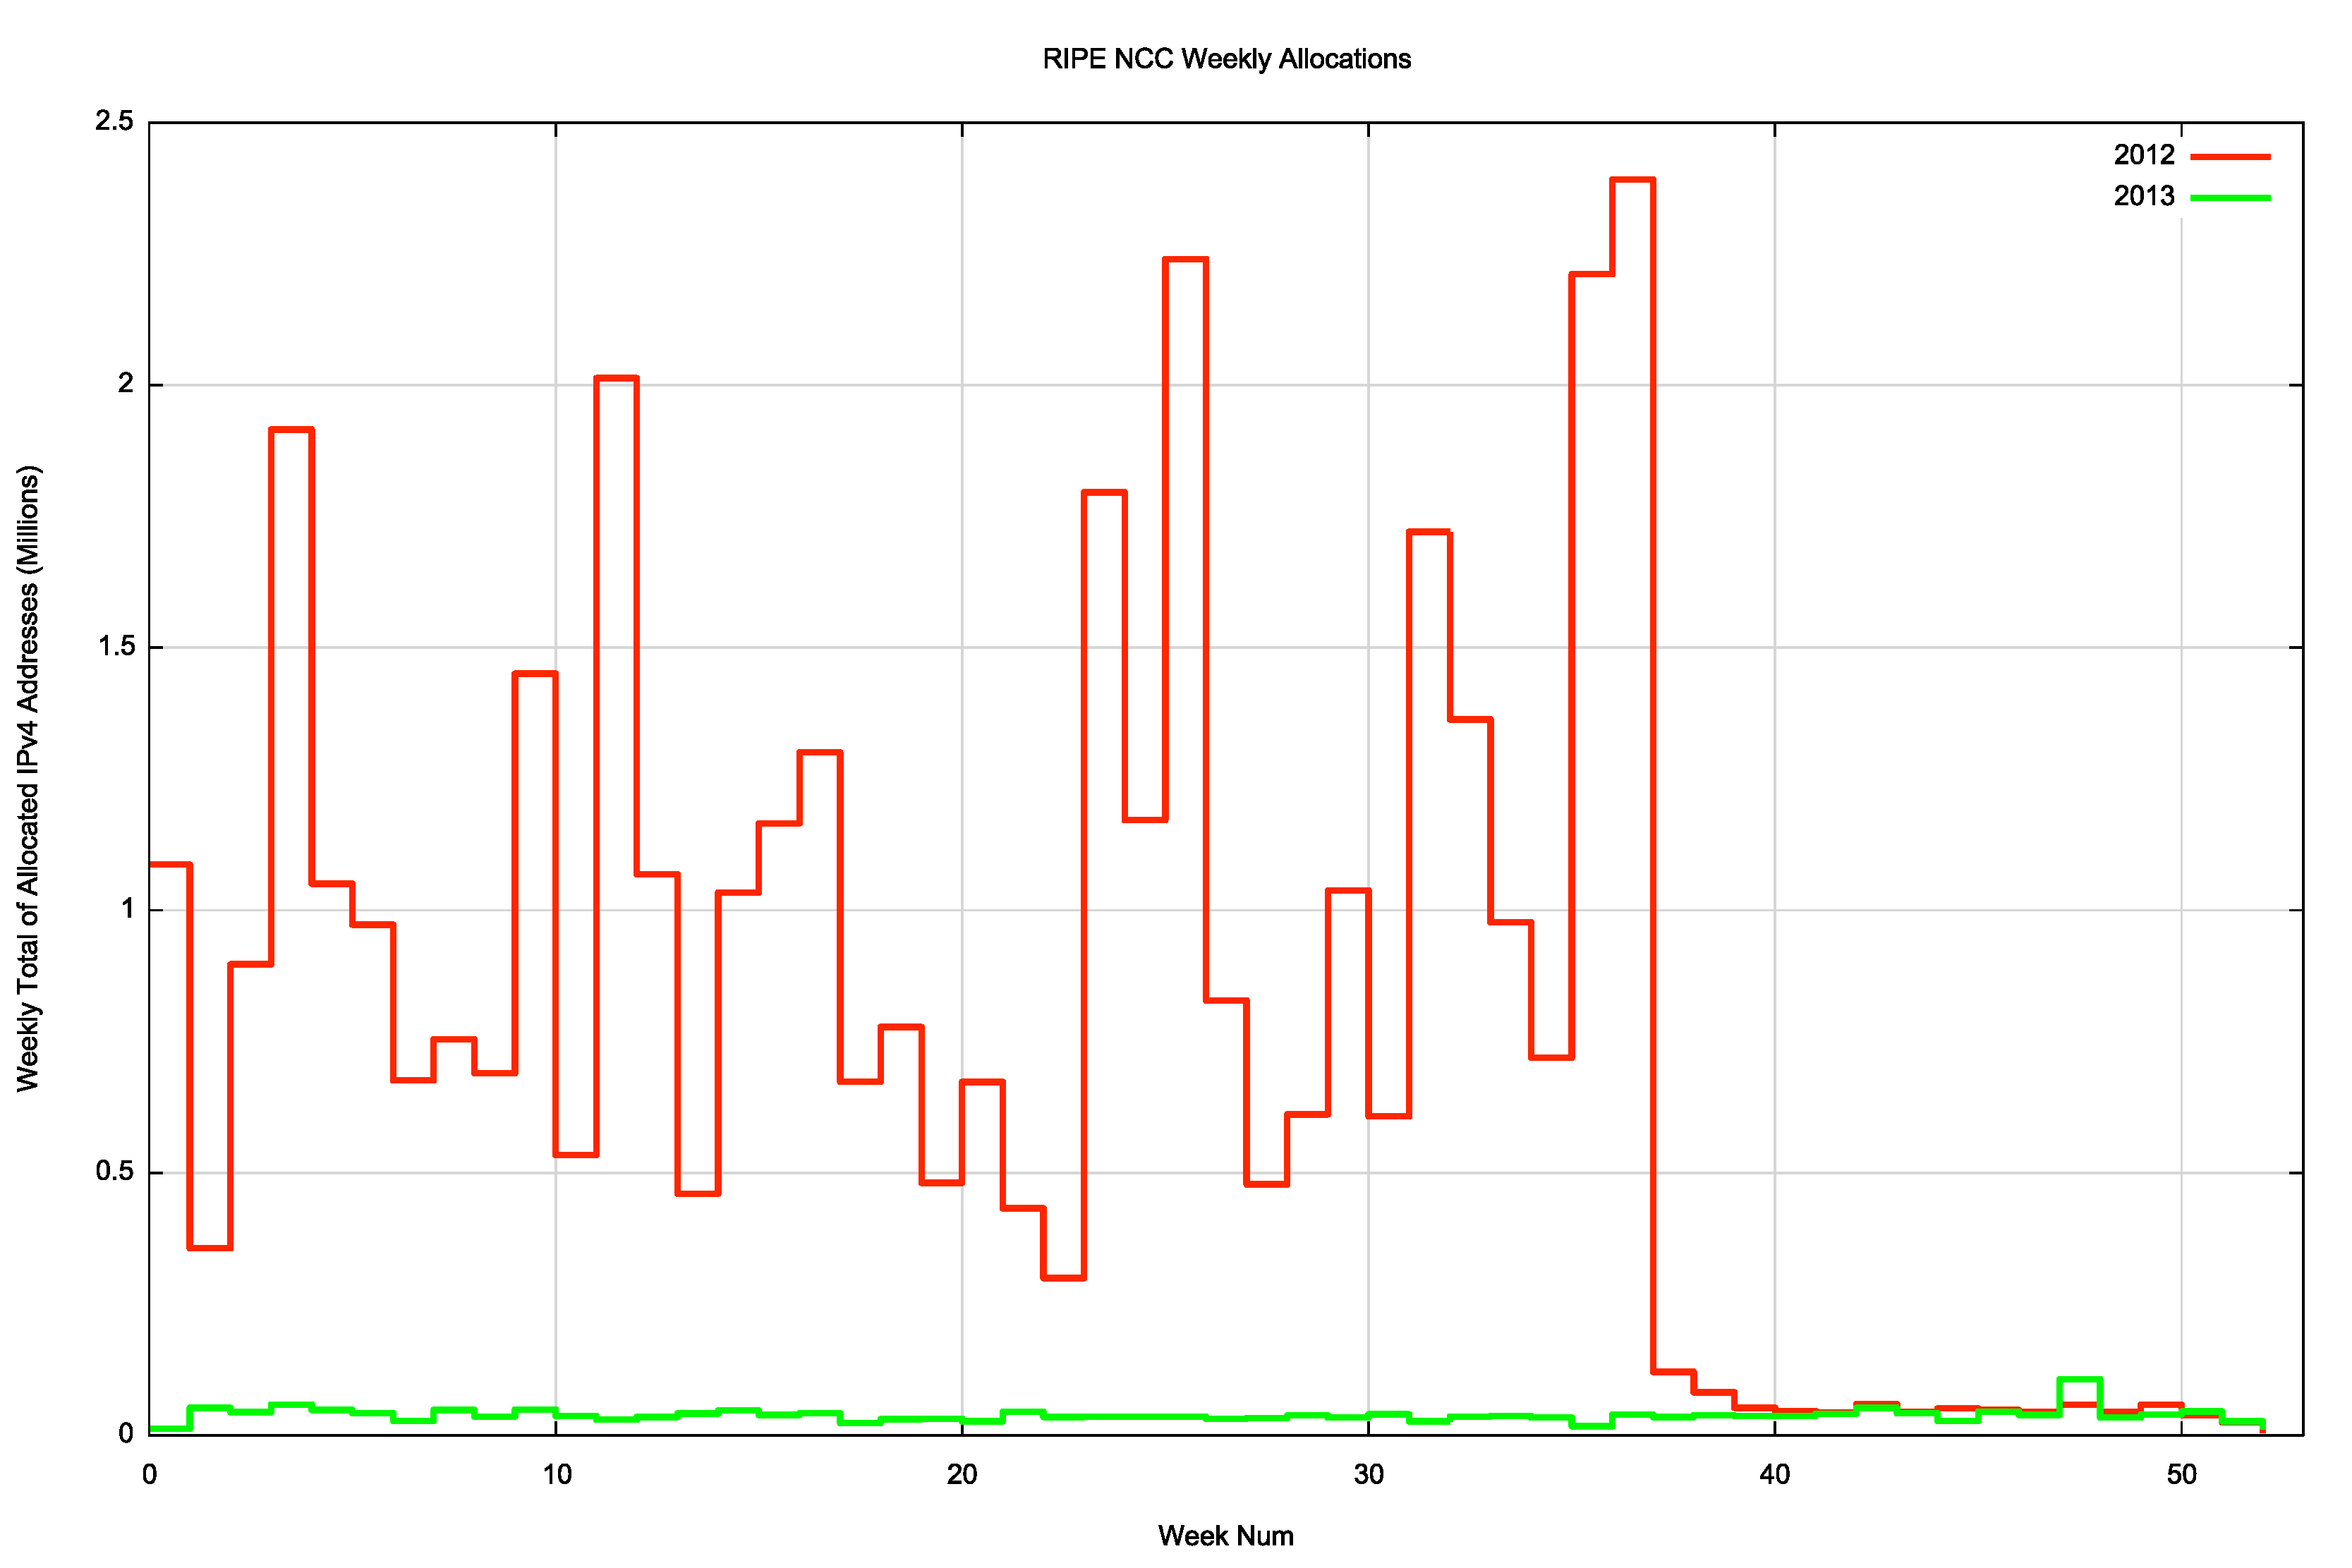
Figures 1-6 - Weekly Address Allocation Levels: 2012 - 2013
The major notable allocation event in 2012 was a set of allocations totalling some 10 million addresses in week 9 by ARIN (mainly to the mobile operator T-Mobile US). While there were a number of allocations of 1-2M addresses through 2013 in ARIN, there was no repeat of such a single large allocation in 2013. The immediate drop of volumes of allocations at the RIPE NCC in September 2012 following exhaustion of their IPv4 address pool was followed by subsequent allocations of up to 1024 addressers per allocation, drawn from the RIPE NCC’s final /8.
There is no clear signs of a "last minute" rush on the three RIRs that still have available IPv4 addresses to distribute for 2013, although the profile of allocations by LACNIC in the second half of 2013 is notably larger than the same period in 2012.
IPv4 Address Distribution
Another way to look at the address distribution is in terms of "skew". If the Internet is populated by a largely homogenous population of service providers then the distribution of address allocations would be relatively uniform, such that the group of largest allocations would not be vastly larger than the group of smallest allocations. On the other hand , if the service provider population is skewed such that there is a small number of very large providers that service the bulk of the user population, then we would expect to see the bulk of addresses being allocated to a small number of providers. One way to look at the level of skew is to use a cumulative distribution plot, comparing the number of allocations to the amount of address space, shown below.
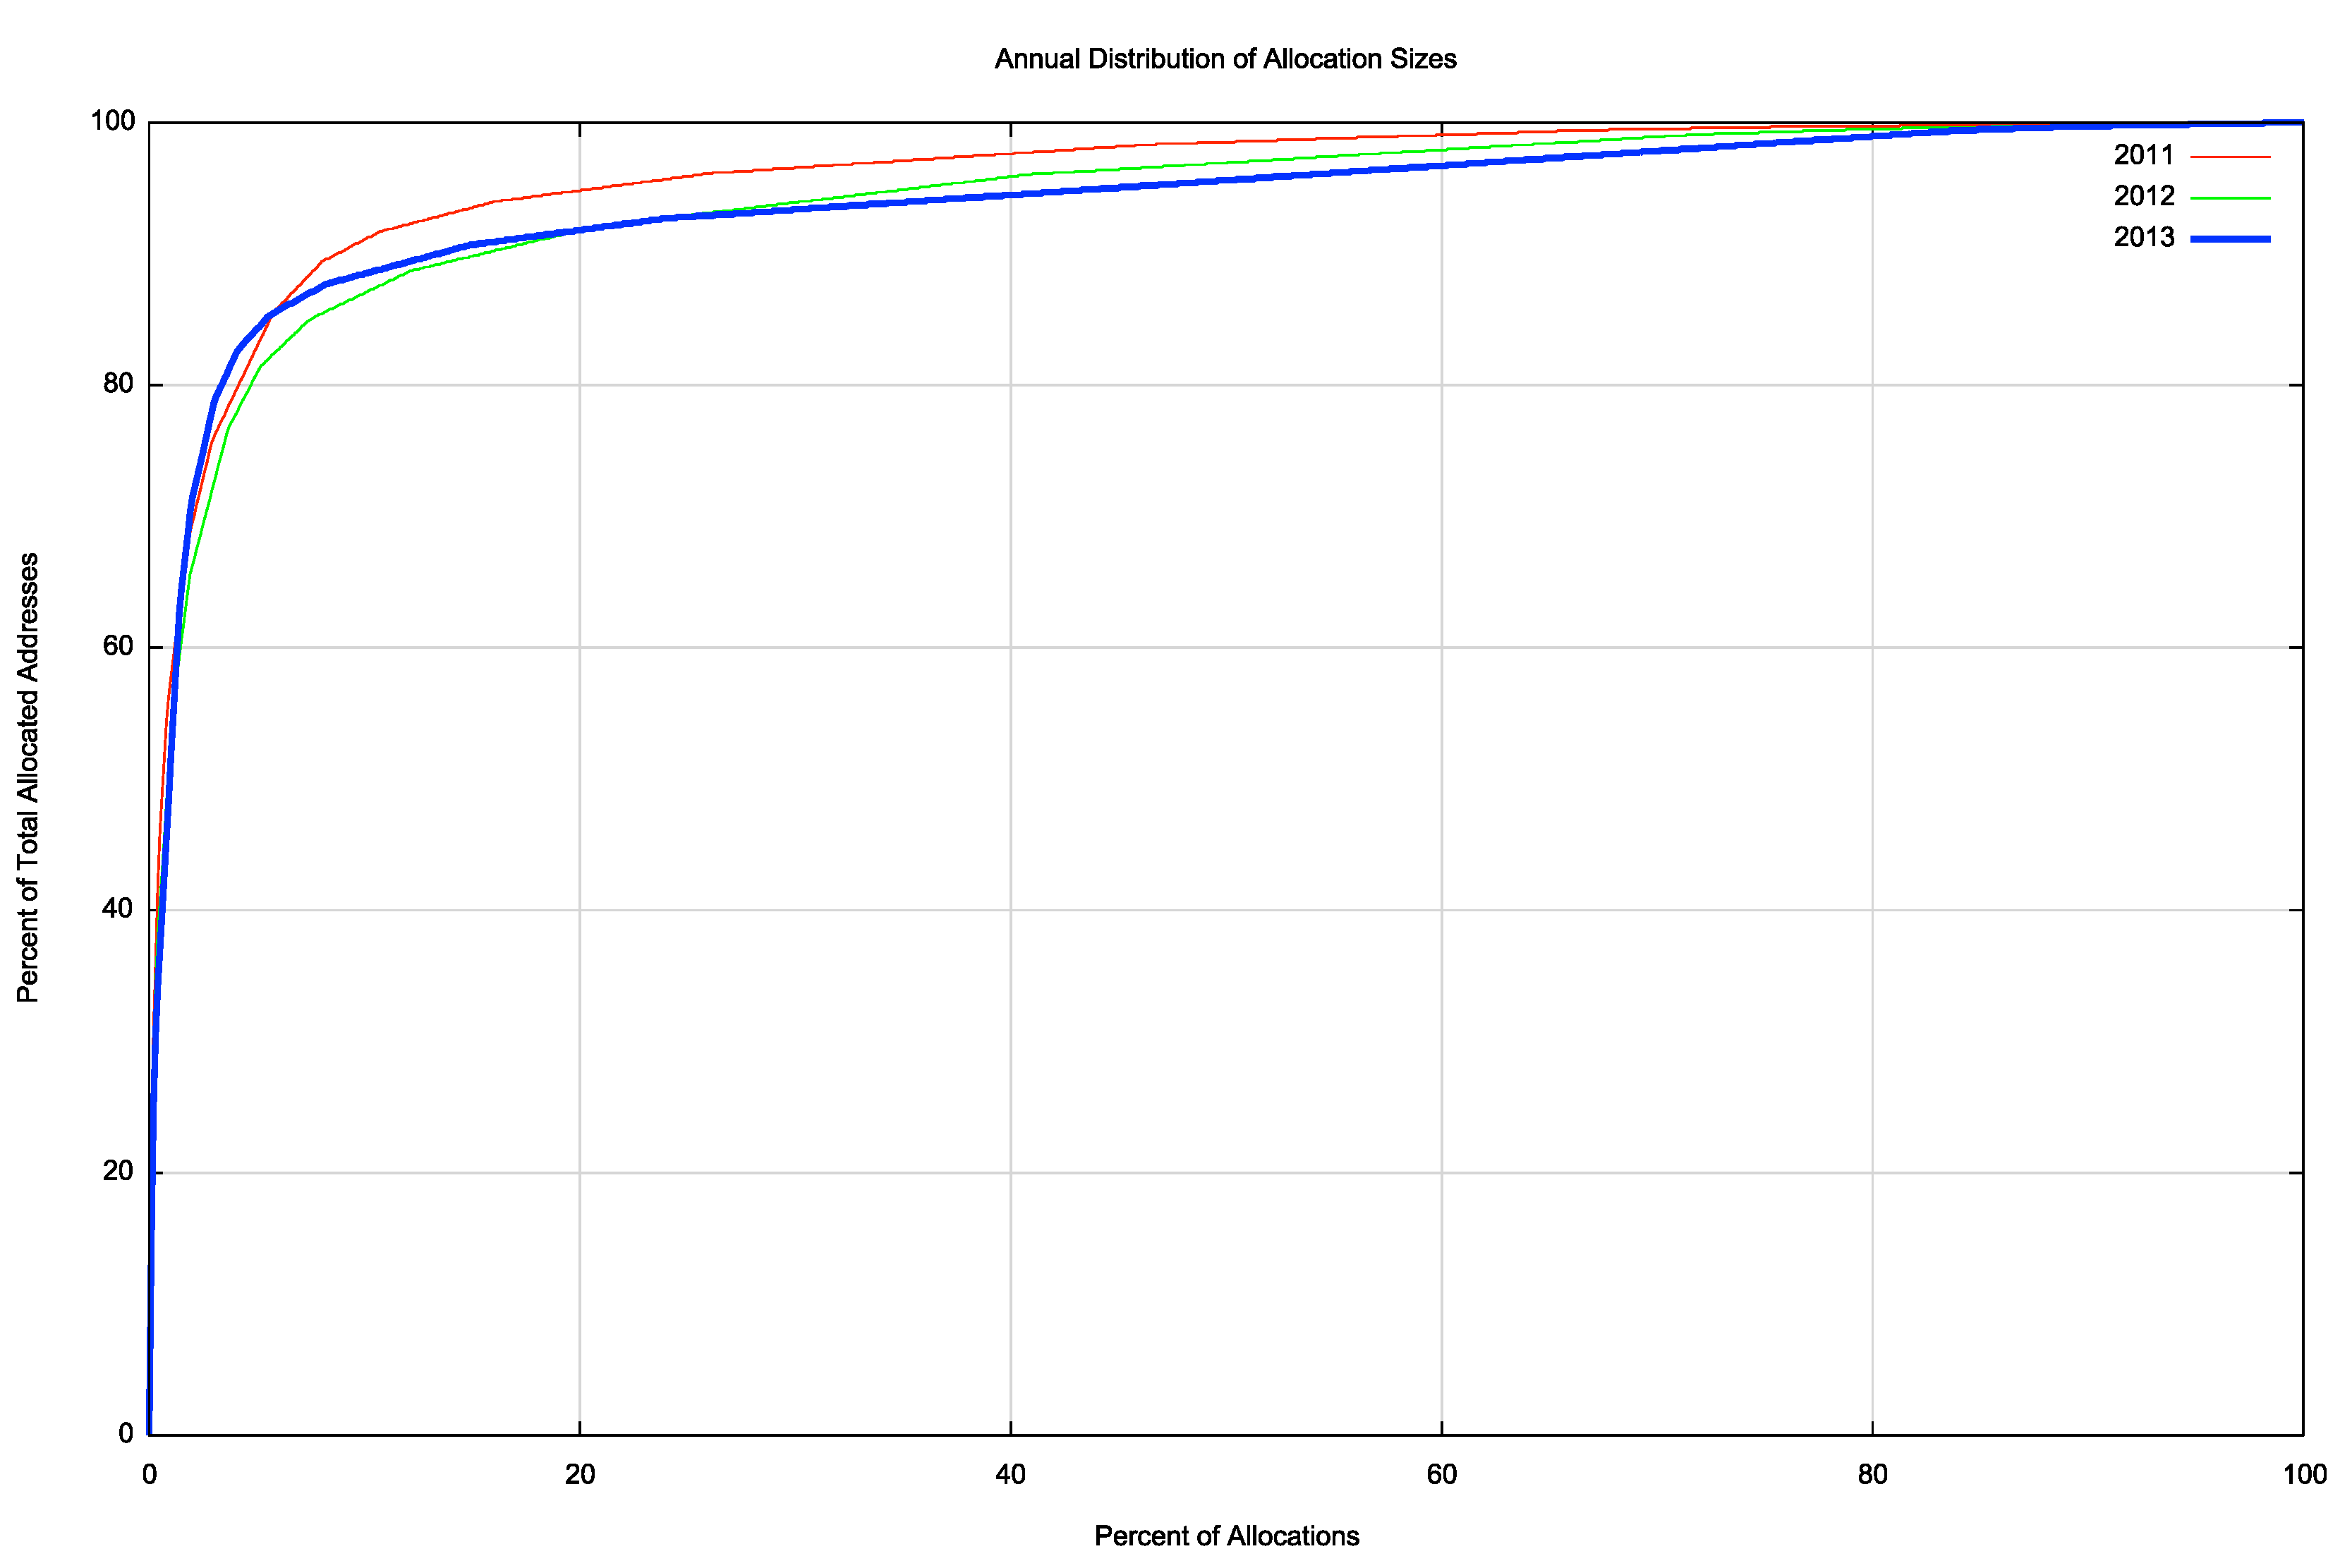
Figure 7 – IPv4 Allocation Distribution CDF 2011 - 2013
Figure 4 shows the address distribution for 2011, 2012 and 2013. The shift over this period shows a relatively steady level in the proportion of address space being allocated to the larger providers. The largest 10% of allocations in 2011 received, 91.1% of the total allocated address space, which fell to 87.0% in 2012, and rose to 88.5%. In 2011 one half of all addresses were allocated to 70 entities, while in 2012 80 entities consumed one half of all addresses, and in 2013 68 entities (Figure 8).
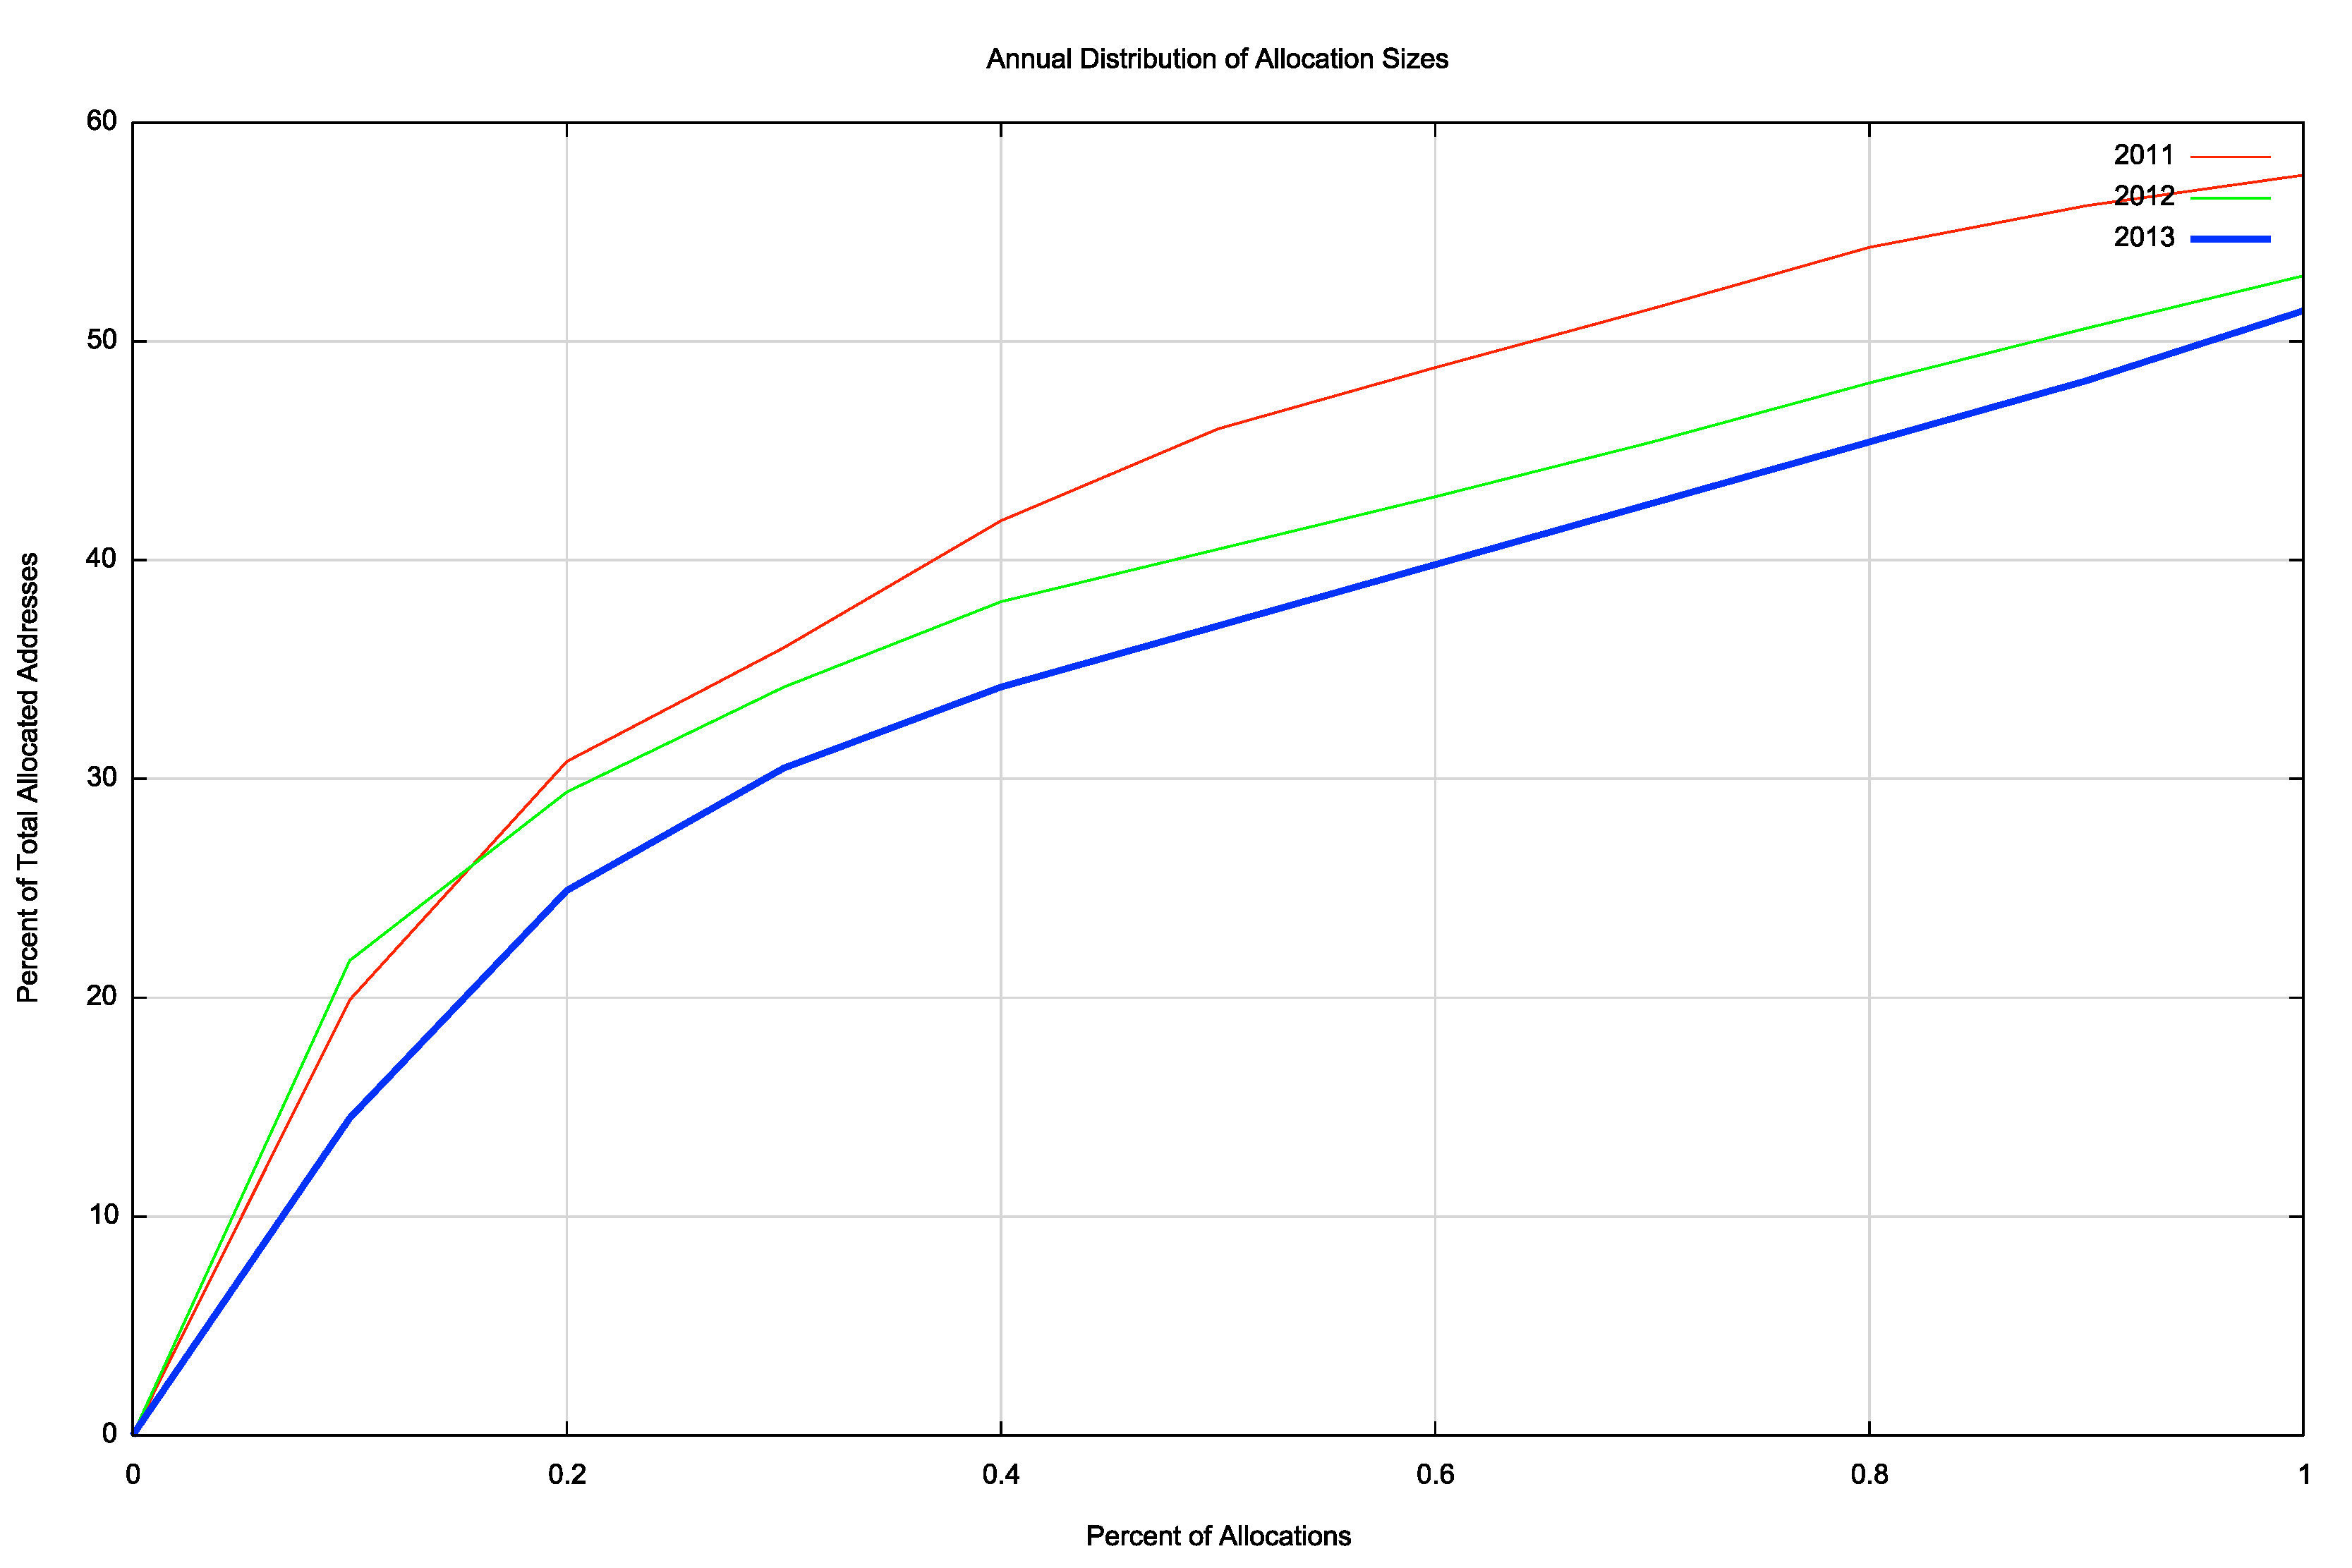
Figure 8 – IPv4 Allocation Distribution CDF 2011 – 2013 – Largest 1%
Who received the largest of these allocations in 2013? The following table lists those organisations who were allocated more than 1 million IPv4 addresses in 2013.
| Rank | Economy | Organization | Addresses (M) |
|---|---|---|---|
| 1 | Brazil | Telefonica Brazil | 5.6 |
| 2 | United States | Amazon | 4.6 |
| 3 | United States | AT&T Internet Services | 4.2 |
| 4 | United States | Akamai | 3.6 |
| 5 | Brazil | Tim Celular S.A. | 2.9 |
| 6 | Brazil | NET Servicos de Comunicatio S.A. | 2.6 |
| 7 | Brazil | Telemar Norte Leste S.A. | 1.3 |
| 8 | Algeria | Telecom Algeria | 1.0 |
| 9 | Seychelles | CloudInnovation | 1.0 |
| 10 | Egypt | Etisalat Misr | 1.0 |
| 11 | Colombia | Colombia Movil | 1.0 |
| 12 | Nigeria | Airtel Nigeria | 1.0 |
| 13 | Colombia | Comcel | 1.0 |
| 14 | Brazil | Global Village Telecom | 1.0 |
| Total | 31.8 |
Table 4 - IPv4 Allocated Addresses - Top 14 allocations for 2013
This "heavy tail" distribution of the largest allocations has not always been the case. In looking at the distribution of IPv4 allocations over the past decade the following table shows the percentage of address space that were allocated to the 1% largest individual allocations and the lower half of the individual allocations.
| IPv4 Allocations | 2001 | 2002 | 2003 | 2004 | 2005 | 2006 | 2007 | 2008 | 2009 | 2010 | 2011 | 2012 | 2013 |
|---|---|---|---|---|---|---|---|---|---|---|---|---|---|
| Top 1% | 30% | 39% | 38% | 38% | 51% | 45% | 51% | 47% | 50% | 49% | 60% | 63% | 51% |
| Lower 50% | 5% | 5% | 4% | 3% | 1% | 2% | 1% | 1% | 1% | 1% | 1% | 2% | 4% |
Table 5 - IPv4 Allocated addresses
What appears to have happened across the period 2000 - 2005 was a marked phase of aggregation in this industry, where the economies of scale in a mass market for Internet services started to exercise significant influence over the deployment of services on the Internet. This picture has remained relatively consistent since 2005, and the largest 100 Internet enterprises across the world appear to undertake at least one half of the volume of deployment of new Internet services. To the extent that the Internet on the 1990's was a poster child of a strongly competitive environment and highly diverse supply industry in the communications sector, the 2000's has seen the Internet progress into an environment which is dominated by economies of scale and large scale supplier enterprises. A marketplace that is strongly influenced by a small number of larger enterprises is often not as agile in areas of technical and service innovation, and competitive pressures are not as strong a factor when one or two providers assume a dominant market position.
The distribution of addresses in the IPv4 Internet paints a picture of an industry that has now completed a process of aggregation, and the pressures that will lead to further evolution of the Internet in the coming years will probably be different to those that drove the Internet of some years ago. This concentration of resources into a small number of carriage and service providers was initially evident in the so-called developed economies, but, as the 2013 number suggest, we are now seeing a similar concentration appear in other parts of the world. The widespread use of mobile devices has managed to side step the capital and logistical barriers of installing a wired infrastructure as a precursor to a providing Internet access, so we are seeing various mobile providers in many parts of the world experiencing a rapid expansion in its customer base, with a corresponding demand on IP addresses.
IPv4 Address Exhaustion
The Internet continues to rely very heavily on IPv4, and the consumption of a further 65 million addresses in 2013 leaves 132 million addresses in the pool of unallocated addresses, or a total of some 23 months if we were able to access these addresses at the same rate as we have been to date. However this is not quite the case.
As at the end of 2013 the total of allocated and assigned addresses was 3,537,312,600 (or the equivalent of 210.84 /8s). The RIRs had some 13,2281,088 (7.88 /8s) marked as “available” and 12198312 (0.7 /8s) marked as “reserved”. The IANA is holding 20,466,432 (1.22 /8s) in its global pool, and there are 592,708,864 (35.33 /8s) marked by the IETF as reserved for various purposes.
Assuming that the process of exhaustion will consume both the available and RIR-reserved pools as well as the IANA pool, then the total addresses left at the start of 2014 were 164,945,832. How long will these addresses last?
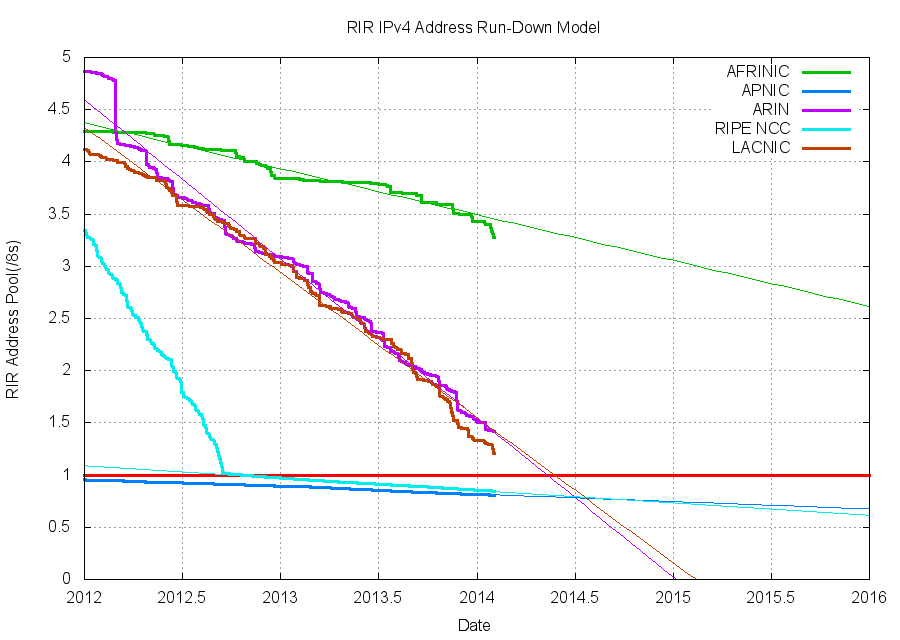
Figure 9 – RIR Address Exhaustion Model
Figure 6 shows the fit of models of address consumption on each of the RIR’s recent assignments. These figures indicate that ARIN and LACNIC have both some 12 months remaining before they exhaust their respective remaining address pools. A more detailed analysis of the situation (see http://ipv4.potaroo.net), taking into account the dispersal of the remaining IANA-held addresses, and also factoring in the exact definition of “exhaustion” in each RIR, leads to a current prediction of exhaustion for LACNIC in January 2015, and for ARIN in February 2015. The uncertainty of these predictions can be quantified to some extent, and the variance of these two predictions is shown below in Figure 7. In the case of ARIN the 80% probability interval extends across a 9 month interval from September 2014 to June 2015. For LACNIC the same 80% probability interval is from December 2014 to March 2015. AFRINIC’s remaining address pool will last until 2022 at current consumption rates.
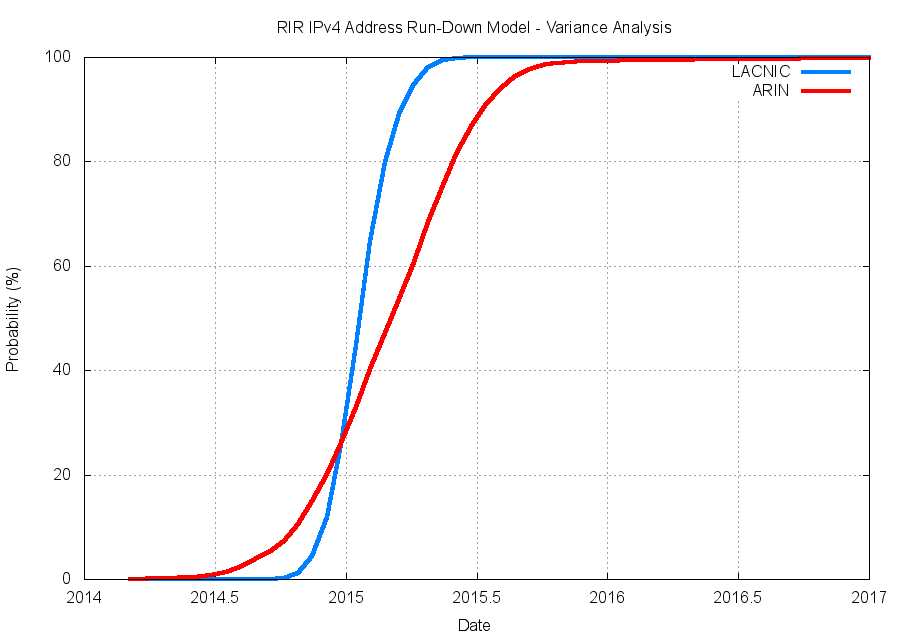
Figure 10 – Variance of the RIR Address Exhaustion Model for ARIN and LACNIC
IPv6 in 2013
These days the story of IPv4 address allocations is at best only half od the story, and to complete the picture its also necessary to look at how IPv6 has fared over 2013. IPv6 uses a somewhat different address allocation methodology than IPv4, and it is a matter of choice for a service provider as to how large an IPv6 address prefix is assigned to each customer. The original recommendations published by the IAB and IESG in 2001 (RFC3177) envisaged the general use of a /48 as an end site prefix. Subsequent consideration of long term address conservation saw a more flexible approach being taken with the choice of the end site prefix size being left to the service provider, and today's IPv6 environment has some providers using a /60 end site allocation unit, some use a /56, and other providers use a /48. This variation makes a comparison of the count of allocated IPv6 addresses somewhat misleading, as an ISP using /48's for end sites will require 256 times more address space to accommodate the same customer base as a provider who uses a /56 end site prefix, and 65,000 times more address space than an ISP using a /60 end site allocation.
So for IPv6 let's use both the number of discrete IPv6 allocations and the total amount of space that was allocated to see how IPv6 fared in 2011.
Comparing 2012 to 2013 the number of individual allocations of IPv6 address space has risen by some 20%, from 3,304 to 4,018 allocations. While this is now more than half the number of allocations of IPv4 addresses, IPv6 still has further ground to cover to attain parity in terms of deployment with IPv4.
| Allocations | 2005 | 2006 | 2007 | 2008 | 2009 | 2010 | 2011 | 2012 | 2013 |
|---|---|---|---|---|---|---|---|---|---|
| IPv6 | 240 | 234 | 475 | 860 | 1,236 | 2,436 | 3,587 | 3,304 | 4,018 |
| IPv4 | 4,774 | 5,646 | 6,312 | 6,969 | 6,701 | 7,758 | 10,061 | 8,619 | 7,110 |
Table 6 - Number of individual Address Allocations, 2005 - 2012
The amount of IPv6 address space distributed in 2013 has risen by some 40% over 2012 levels. There does appear to be increasing levels of interest in IPv6 over this year.
| Addresses | 2005 | 2006 | 2007 | 2008 | 2009 | 2010 | 2011 | 2012 | 2013 |
|---|---|---|---|---|---|---|---|---|---|
| IPv6 (/32s) | 26,991 | 9,792 | 6,678 | 80,996 | 1,064 | 5,835 | 15,018 | 17,756 | 24,107 |
| IPv4 (/32s)(M) | 174.4 | 168.1 | 203.9 | 203.3 | 189.4 | 248.8 | 201.0 | 114.9 | 65.1 |
Table 7 – Volume of Address Allocations, 2005 - 2012
Regionally its been a mixed year for IPv6. For the RIPE NCC, serving Europe and the Middle East there was a significant growth in the number of IPv6 allocations over the past year. But in ARIN, APNIC and AFRINIC the allocations fell from 2012 levels. Proportionally, the highest growth was evident in LACNIC, where the number of IPv6 allocations more than doubled over 2012 levels.
| Allocations | 2005 | 2006 | 2007 | 2008 | 2009 | 2010 | 2011 | 2012 | 2013 |
|---|---|---|---|---|---|---|---|---|---|
| RIPE NCC | 93 | 89 | 158 | 427 | 622 | 1,042 | 1,647 | 1,756 | 2,149 |
| ARIN | 59 | 69 | 210 | 227 | 378 | 623 | 1,038 | 611 | 560 |
| APNIC | 54 | 43 | 63 | 161 | 190 | 666 | 641 | 599 | 540 |
| LACNIC | 31 | 16 | 25 | 29 | 33 | 50 | 132 | 253 | 696 |
| AFRINIC | 3 | 17 | 19 | 16 | 13 | 55 | 129 | 83 | 73 |
| 240 | 234 | 475 | 860 | 1,236 | 2,436 | 3,587 | 3.302 | 4,018 |
Table 8 - IPv6 allocations by RIR
The assignment data tells a slightly different story. Table 9 shows the number of allocated IPv6 /32's per year (Table 9) and dividing addresses by allocations gives the average IPv6 allocation size in each region (Table 10). Of note is the jump in average allocation size in AFRINIC and LACNIC in 2012, and a fall in the average allocation size in APNIC. The overall average allocation size is slightly larger than a /30. The difference here point to some differences in IPv6 allocation policies between the regions, as well as some difference in the IPv6 applicants (large scale core infrastructure vs edge networks) between the regions.
| IPv6 Addresses (/32s) | 2005 | 2006 | 2007 | 2008 | 2009 | 2010 | 2011 | 2012 | 2013 |
|---|---|---|---|---|---|---|---|---|---|
| RIPE NCC | 17,495 | 6,481 | 1,251 | 606 | 602 | 1,867 | 2,425 | 3,729 | 6,390 |
| ARIN | 57 | 52 | 137 | 14,488 | 249 | 579 | 2,280 | 1,675 | 12,580 |
| APNIC | 9,373 | 3,226 | 5,237 | 141 | 174 | 3,239 | 9,506 | 3,807 | 4,662 |
| LACNIC | 53 | 16 | 39 | 65,749 | 30 | 46 | 652 | 4,325 | 608 |
| AFRINIC | 3 | 17 | 14 | 12 | 9 | 104 | 155 | 4,203 | 67 |
| 26,981 | 9,792 | 6,678 | 80,996 | 1,064 | 5,835 | 15,018 | 17,739 | 24,107 |
Table 9 - IPv6 address allocation volumes by RIR
| Average IPv6 Allocation | 2005 | 2006 | 2007 | 2008 | 2009 | 2010 | 2011 | 2012 | 2013 |
|---|---|---|---|---|---|---|---|---|---|
| RIPE NCC | 188.12 | 72.82 | 7.92 | 1.42 | 0.97 | 1.79 | 1.47 | 2.12 | 2.97 |
| ARIN | 0.97 | 0.75 | 0.65 | 63.82 | 0.66 | 0.93 | 2.20 | 2.74 | 22.46 |
| APNIC | 173.57 | 75.02 | 83.13 | 0.88 | 0.92 | 4.86 | 14.83 | 6.36 | 8.63 |
| LACNIC | 1.71 | 1.00 | 1.56 | 2,267.21 | 0.91 | 0.92 | 4.94 | 17.09 | 0.87 |
| AFRINIC | 1.00 | 1.00 | 0.74 | 0.75 | 0.69 | 1.89 | 1.20 | 50.64 | 0.92 |
| 112.42 | 41.85 | 14.06 | 94.18 | 0.86 | 2.40 | 4.19 | 5.37 | 6.05 |
Table 10 – Average IPv6 address allocation size by RIR
| Rank | 2009 | 2010 | 2011 | 2012 | 2013 | |||||
|---|---|---|---|---|---|---|---|---|---|---|
| 1 | United States | 349 | United States | 556 | United States | 924 | United States | 549 | United States | 485 |
| 2 | Germany | 86 | Australia | 146 | Australia | 176 | UK | 199 | Brazil | 473 |
| 3 | UK | 66 | Germany | 124 | Germany | 160 | Germany | 187 | UK | 248 |
| 4 | Netherlands | 56 | UK | 106 | UK | 150 | Russia | 186 | Russia | 246 |
| 5 | Australia | 53 | Russia | 102 | Russia | 147 | Netherlands | 124 | Germany | 195 |
| 6 | Russia | 46 | Netherlands | 86 | France | 110 | Australia | 113 | Netherlands | 134 |
| 7 | Japan | 32 | China | 86 | Canada | 107 | France | 111 | France | 132 |
| 8 | France | 29 | Indonesia | 72 | Netherlands | 107 | Sweden | 90 | Sweden | 112 |
| 9 | Czech Rep. | 29 | Japan | 62 | Sweden | 96 | Argentina | 78 | Australia | 102 |
| 10 | Sweden | 27 | France | 60 | Czech Rep. | 88 | Poland | 77 | Italy | 98 |
Table 11 - IPv6 allocations by Economy
Table 12 shows the amount of IPv6 address space assigned on a per economy basis for the past 5 years (using units of /32s). In 2012 the major allocations were /20 address blocks to entities in Argentina and Egypt. The address space allocated to the United States was down on 2011 levels, as was the IPv6 address allocations to China.
| Rank | 2009 | 2010 | 2011 | 2012 | 2013 | |||||
|---|---|---|---|---|---|---|---|---|---|---|
| 1 | United States | 225 | Japan | 2,518 | China | 8,997 | Argentina | 4,178 | United States | 12,553 |
| 2 | Germany | 143 | Germany | 600 | United States | 2,205 | Egypt | 4,098 | China | 4,135 |
| 3 | UK | 61 | United States | 523 | Spain | 641 | China | 3,136 | UK | 791 |
| 4 | Australia | 45 | China | 339 | UK | 384 | United Sates | 1,346 | Germany | 654 |
| 5 | Netherlands | 44 | Belgium | 270 | Venezuela | 262 | Italy | 635 | Russia | 529 |
| 6 | Russia | 43 | France | 181 | Mexico | 261 | Russia | 414 | Netherlands | 488 |
| 7 | Japan | 33 | Australia | 100 | Netherlands | 229 | Germany | 380 | Brazil | 450 |
| 8 | France | 24 | Sweden | 94 | Germany | 187 | UK | 353 | France | 429 |
| 9 | Czech Rep. | 21 | Russia | 94 | Russia | 146 | Canada | 325 | Italy | 339 |
| 10 | Sweden | 21 | UK | 94 | Australia | 124 | Japan | 283 | Poland | 275 |
Table 12 - IPv6 Address Allocation Volumes by Economy
The major IPv6 allocations in 2013 by end entity are shown in Table 13.
| Rank | Country | Organisation | Address Count (/32s) |
|---|---|---|---|
| 1 | United States | US Department of Defence | 8,192 |
| 2 | United States | GoDaddy Inc | 4,096 |
| 3 | China | eGovnet | 2,048 |
| 4 | China | China TieTong Telecommunications Corporation | 2,048 |
| 5 | Romania | UPC Romania SRL | 32 |
| 6 | United States | AT&T Internet Services | 16 |
| 7 | Brazil | Telemar Norte Leste S.A. | 16 |
| 8 | Brazil | Brasil Telecom S/A - Filial Distrito Federal | 16 |
| 9 | United States | Hargray Communication Group, Inc | 16 |
| 10 | United States | Veracity Networks LLC | 16 |
| 11 | South Africa | Telkom SA Ltd. | 16 |
Table 13 – Largest IPv6 Address Allocations in 2012 by Organisation
Notable here are two large allocations of multiple /22 prefixes to the US department of Defence and a /20 allocation to GoDaddy, a US enterprise who specialises in services associated with domain name registration.
The Outlook for the Internet
The past five years has shown that the Internet is now an integral part of the portfolio of conventional business activity across the world, and the deployment of internet services and the opening up of markets through deployment of Internet services is subject to the same economic opportunities and constraints as any other business activity. Those economies that were adversely impacted by the global financial situation saw a drop in the expansion of new Internet services and a drop in their demands for IP address allocations across 2009-2011, while other economies that managed to avoid the worst impacts of a financial recession continued to see growth in new Internet markets across those years.
The past three years has been dominated by the mass marketing of mobile internet services, and the growth rates for 2013 perhaps might have been the highest so far recorded were it not for the exhaustion of the IPv4 address pools in the Asia Pacific region and Europe and the Middle East. In address terms this growth is being masked by the use of Carrier Grade NATs in the mobile service provider environment, so that the resultant demands for public addresses in IPv4 are quite low. In theory there is no such requirement for IPv6 to use NATS, and if the mobile world were deploying dual stack ubiquitously then this would be evident in the IPv6 address allocation data. Unfortunately no such broad scale of deployment of IPv6 was visible in the address statistics for 2013. This points to a mobile Internet whose continued growth in 2013 remains, for the most part, highly reliant on NATs, and this, in turn, points to some longer term elements of concern for the continued ability of the Internet to support further innovation and diversification in its portfolio of applications and services.
We are witnessing an industry that is no longer using technical innovation, openness and diversification as its primary means of propulsion. The widespread use of NATs limit the technical substrate of the Internet to a very restricted model of simple client/server interactions using TCP and UDP. The use of NATs force the interactions into client-initiated transactions, and the model of an open network with considerable flexibility in the way in which communications took place is no longer being sustained. Today's internet is serviced by a far smaller number of very large players, each of whom appear to be assuming a very strong position within their respective markets. The drivers for such larger players tend towards risk aversion, conservatism and increased levels of control across their scope of operation. The same trends of market aggregation are now appearing in content provision, where a small number of content providers are exerting a dominant position across the entire Internet.
This changing makeup of the Internet industry has quite profound implications in terms of network neutrality, the separation of functions of carriage and service provision, investment profiles and expectations of risk and returns on infrastructure investments, and on the openness of the Internet itself. While the recent US Count of Appeals decision invalidating the anti-blocking and anti-discrimination rules in the Federal Communication Commission's Open Internet Order was a decision made on grounds of interpretation of regulatory test, the underlying momentum of many actors in the Internet carriage sector to play an active role in brokering content to users has been evident for many years. Even without this Appeals Court decision it was always going to be challenging to construct an efficient, fully open and neutral IP carriage infrastructure upon a platform that has run out of the basic currency of IP addresses.
Over the coming 12 months we will witness the final stages of address exhaustion in IPv4 in North and South America. It would be heartening to think that at the same time we are going to see some significant moves in the deployment of IPv6, fuelled by this increasing pressure of address scarcity.
But at this point we can only wait and see. I'll review what happened in 2014 some 12 months from now.
![]()
Disclaimer
The above views do not necessarily represent the views of the Asia Pacific Network Information Centre.
![]()
About the Author
GEOFF HUSTON is the Chief Scientist at APNIC, the Regional Internet Registry serving the Asia Pacific region.