|
The ISP Column
A column on things Internet
|
|
|
Other Formats:
|
|
|
|
|
Who Uses Google's Public DNS?
November 2013
Geoff Huston
Much has been said about how Google uses the services they provide, including their mail service, their office productivity tools, file storage and similar services, as a means of gathering an accurate profile of each individual user of their services. The company has made a very successful business out of measuring users, and selling those metrics to advertisers. But can we measure Google as they undertake this activity? How many users avail themselves of their services? Perhaps that's a little ambitious at this stage, so maybe a slightly smaller scale may be better. Let's just look at one Google service. What I would like to describe here is the results of an extended effort to measure which of the world’s Internet user population are users of Google’s Public DNS Service.
How do folk get to use Google’s Public DNS service? One way is for end users to configure their systems to use Google’s Public DNS service by following the configuration instructions at https://developers.google.com/speed/public-dns/docs/using. Yes, its as simple as placing 8.8.8.8 into the locally configured list of DNS resolvers. Most of the time this should Just Work. Of course there are some times, perhaps where there is DNS traffic interception going on, that your efforts to use a particular DNS resolver might well be thwarted by the actions of these middleware interceptors that intercept your DNS query packets, and answer them via a local DNS resolver, who then spoofs the identity of Google’s DNS resolvers in their response back to you. However, for many users it does work exactly as intended. And it’s not just individuals who have taken advantage of this service. It’s also evident that larger networks and ISP platforms have also availed themselves of this Google service, and they appear to use Google’s DNS resolvers as DNS forwarders from their own DNS resolver services.
Can we actually measure the extent to which end users and networks make use of Google’s DNS services?
Why is this question of interest?
It’s worth noting that almost everything we do on the Internet starts with a domain name. Whether it’s browsing the web, Twitter, Facebook, videos, talking, or almost any other form of application, the universal way of connecting to a service is by resolving the service’s domain name to an IP address, then starting a communications session with the identified remote service point. If one could see the entire panoply of DNS queries in one single view, then one would have a comprehensive picture of what everybody is doing on the Internet, in real time. But it’s not really necessary to have such a comprehensive view. As any statistician could tell you, it is possible to construct a comprehensive picture of the Internet from a far smaller sample set. Google’s Public DNS service is apparently very successful. Many folk direct their queries to these Google servers. Sometimes its faster, sometimes its more complete, but whatever the reason, many users have gone down this path. So I’d like to look at just how much of the Internet’s user population has their DNS queries answered by Google. And from that measurement data maybe we could make a guess as to just how complete Google's DNS-derived picture of the Internet might look like.
Measurement Technique
We had started along this path by looking for something entirely different. We were interested to measure the extent to which users pass their DNS queries to DNS resolvers that perform DNSSEC validation. During this investigation, at the start of 2013, Google announced that they would be turning on DNSSEC validation for their resolvers. At that point we were interested to understand to what extent would this announcement alter the overall landscape of DNSSEC validation.
How can we measure what end users do? Broadly speaking, there are two forms of approach. The first is to instrument a service that is very widely used and conduct the measurement exercise from that platform. Of course the precondition here is to have access to a widely used service point and be permitted to add various forms of action scripts into that service environment. The second approach is to inject the measurement code into the user’s environment, and have the user perform the measurement test directly. We have been using this latter approach for some years now, based on using the online advertisement network as a means of gaining access to the user environment, and then using a simple script embedded in the ad to request the user to perform a fetch of a small set of URLs.
If we carefully construct the URLs that are presented to end users to fetch, then it is possible to expose a number of aspects of the user’s environment. The basic approach is to use three URLs, where the DNS names are respectively DNSSEC-signed, DNSSEC-signed with invalid signatures and are not DNSSEC-signed at all. These considerations relate to the use of unique URLs at each invocation of the experiment. It is critical to avoid the interception of these URL resolution and fetch tasks being trapped by intermediate DNS and WEB caches, as we need to intuit end user behaviour based on interactions we see at the authoritative DNS and web servers for the experiment’s URLs. That means that we use an environment that is a little unwise in a normal context, in that the DNS is served from a single authoritative name server, rather than the more typical configuration of 2 or perhaps 3 name servers. Also, we use a DNS name where we have quite deliberately broken the DNSSEC signature. And of course every name contains unique components, and we apply the DNSSEC signatures across these unique name components.
Analysing the Experimental Technique
The DNS is both simple and incredibly complicated. Its simple in so far as its a protocol where a client generates a query as a DNS packet, and sends it to a DNS resolver, and the DNS resolver returns the packet as an response. If the queried name exists, the resolver is expected to have placed the details of the answer into the answer section of the DNS packet. Otherwise, the response is expected to have an appropriate diagnostic code set. Question. Answer. Simple.
And the model of resolution can equally be presented in extremely simple terms. To answer the question, the resolver asks the DNS name server that is “authoritative” for the zone being queried, and passes that response back to thew resolver. Figure 1 shows the DNS in this naive manner.

Figure 1 - A Naive view of DNS Resolution
But of course this naïve view conveniently covers up a massive amount of detail and complexity in the DNS. Hidden behind this seemingly simple query/response interface is a distributed database of hundreds of millions of individual entries, served from a set of some tens of millions of DNS resolvers. Their interconnection is highly varied, and the resultant system behaviour is not only diverse, but at times completely perverse as well! A small snapshot of the internal structure of DNS resolvers is shown in Figure 2.
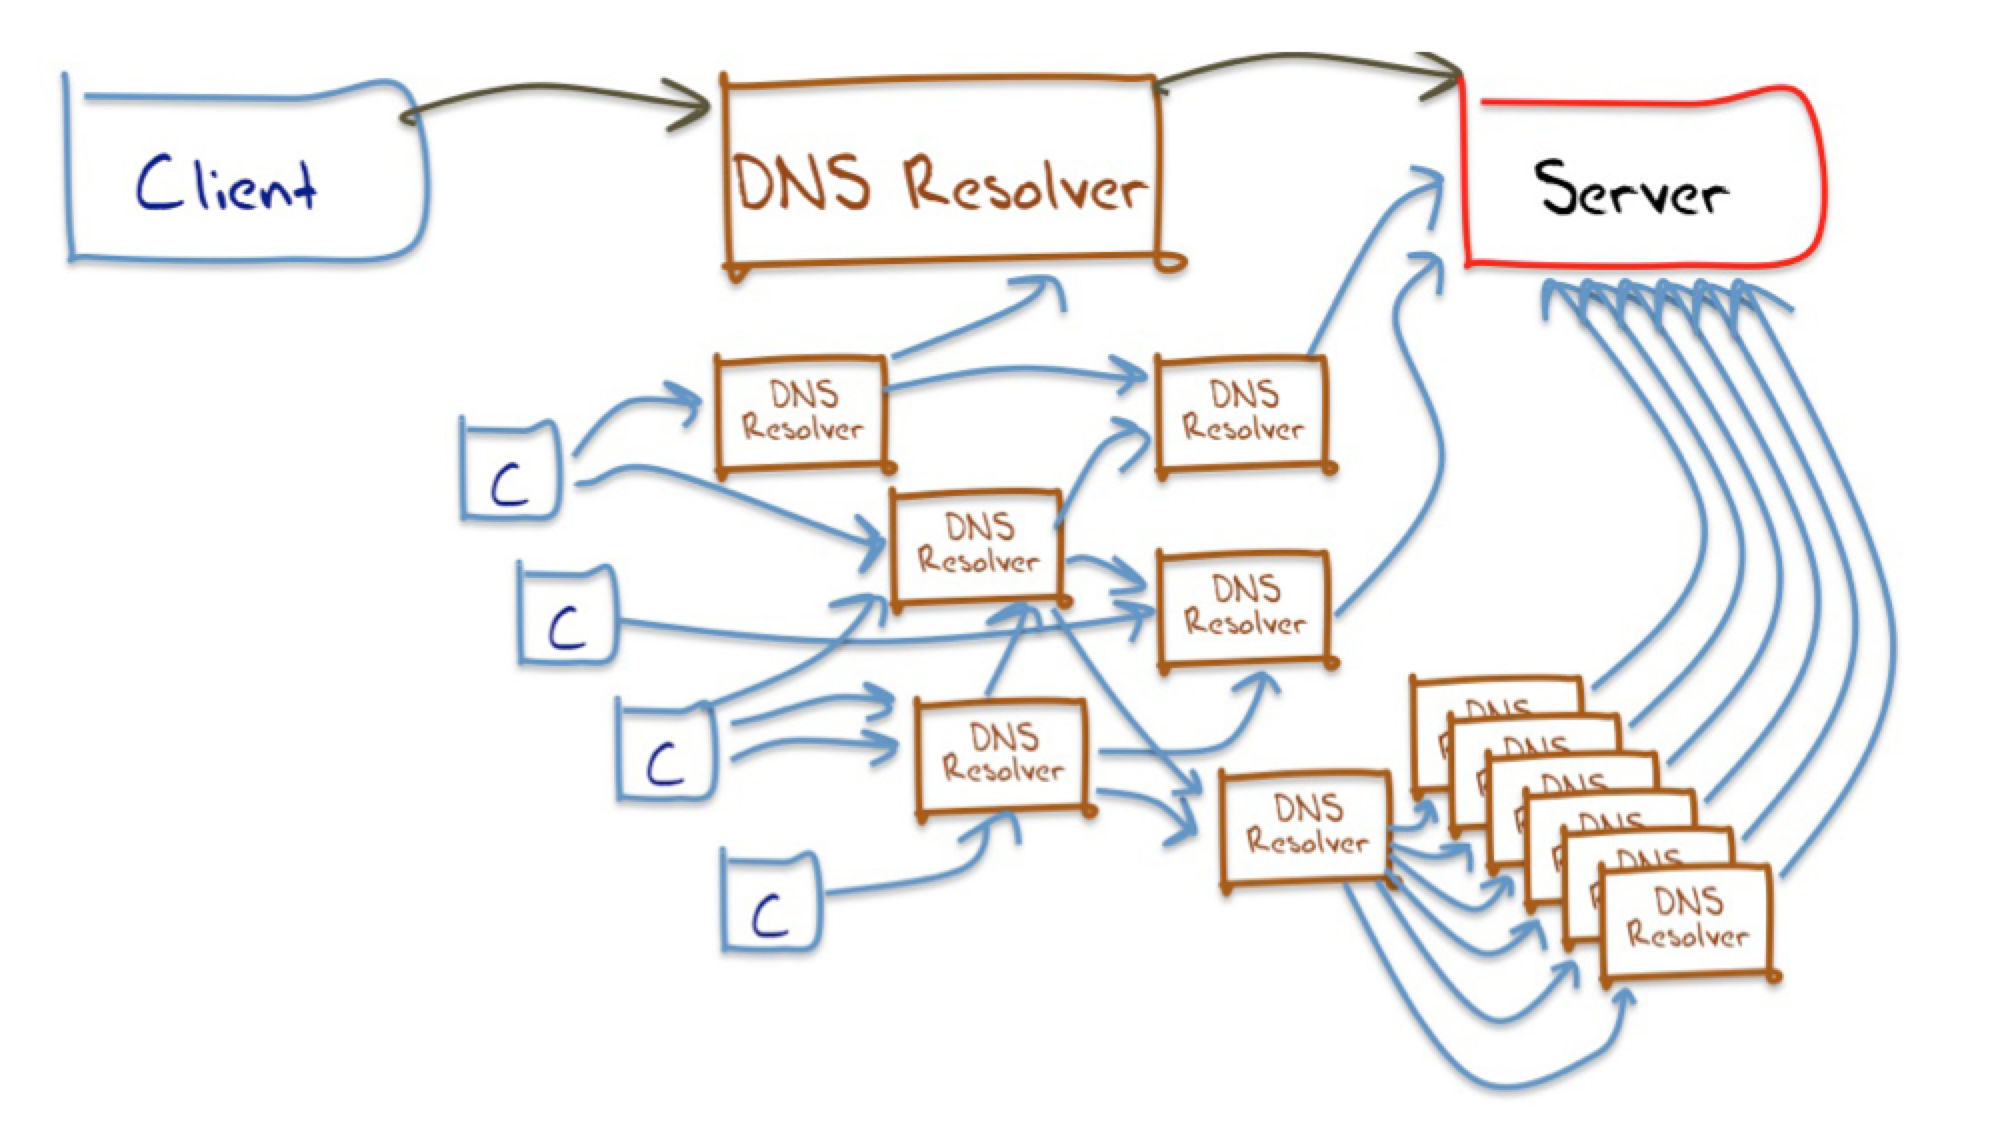
Figure 2 – Some forms of DNS Resolver query paths
However, this level of internal structure of the DNS is not directly visible. DNS queries have no “trail” information. When resolver A forwards a DNS query to resolver B, it has no ability to describe its motives in so doing. It cannot identify the client that triggered the original query, nor expose the internal logic that lead to the resolver generating this query nor the logic that selected this particular resolver as the resolver to receive this query.
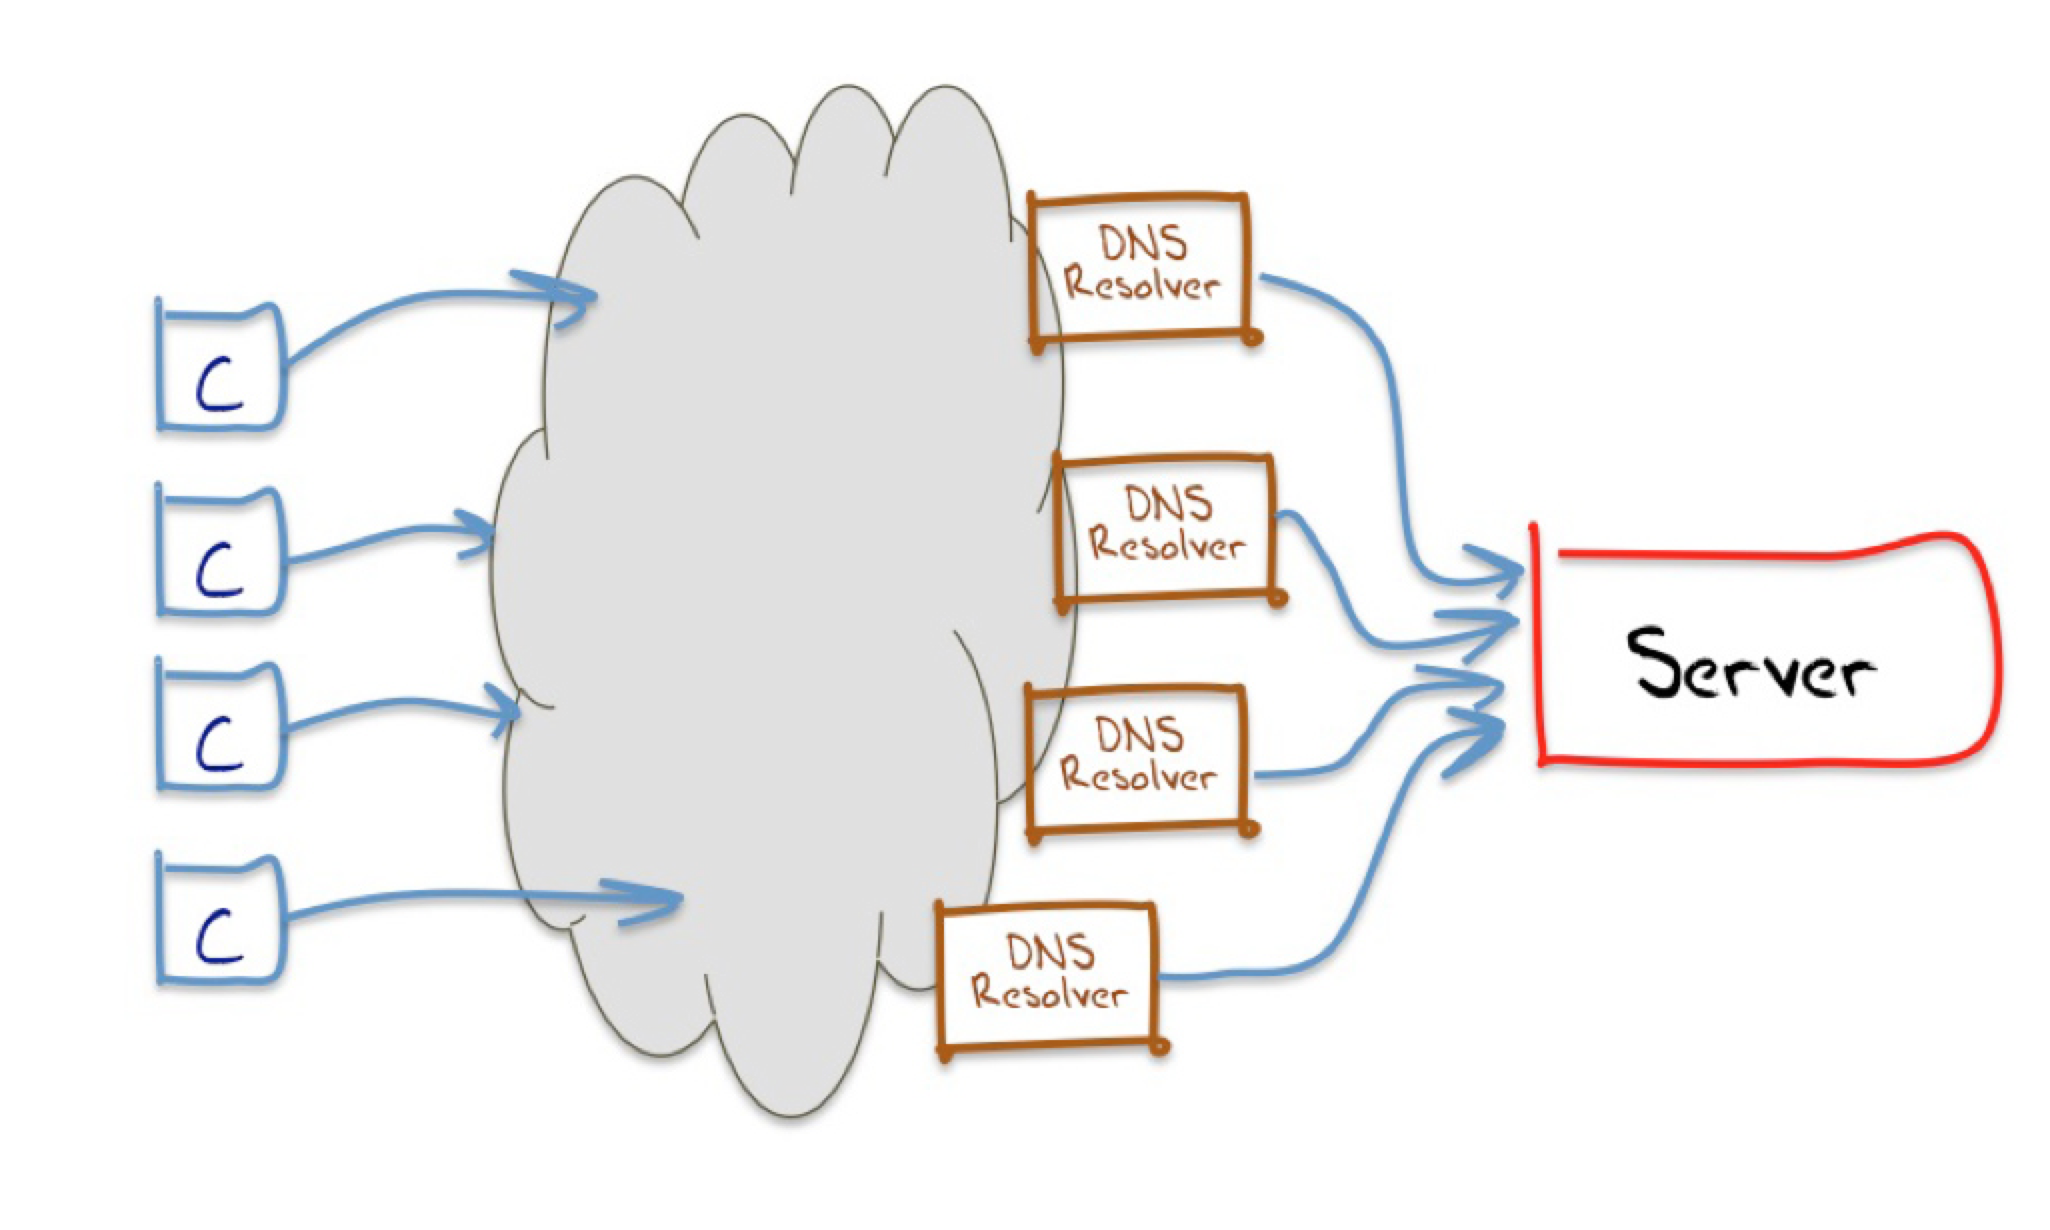
Figure 3 – A Working Model of DNS Resolution
So when we want to ask: “How much of the Internet’s end user base uses Google’s Public DNS Service?” it probably makes some sense to explain how we will go about answering that question. The simplification we use here is look at the DNS world from the perspective of the authoritative name server, which tends to cut out all the intermediate DNS resolvers. What we are left with is, from the perspective of the authoritative name server, a “visible” DNS resolver (Figure 3). By itself, this simplification would still not really help. However, if we pass every client a completely unique DNS name to resolve, then so as long as we keep track of the association of clients to unique DNS names, we can associate each client with the visible resolver or resolver(s) that they use.
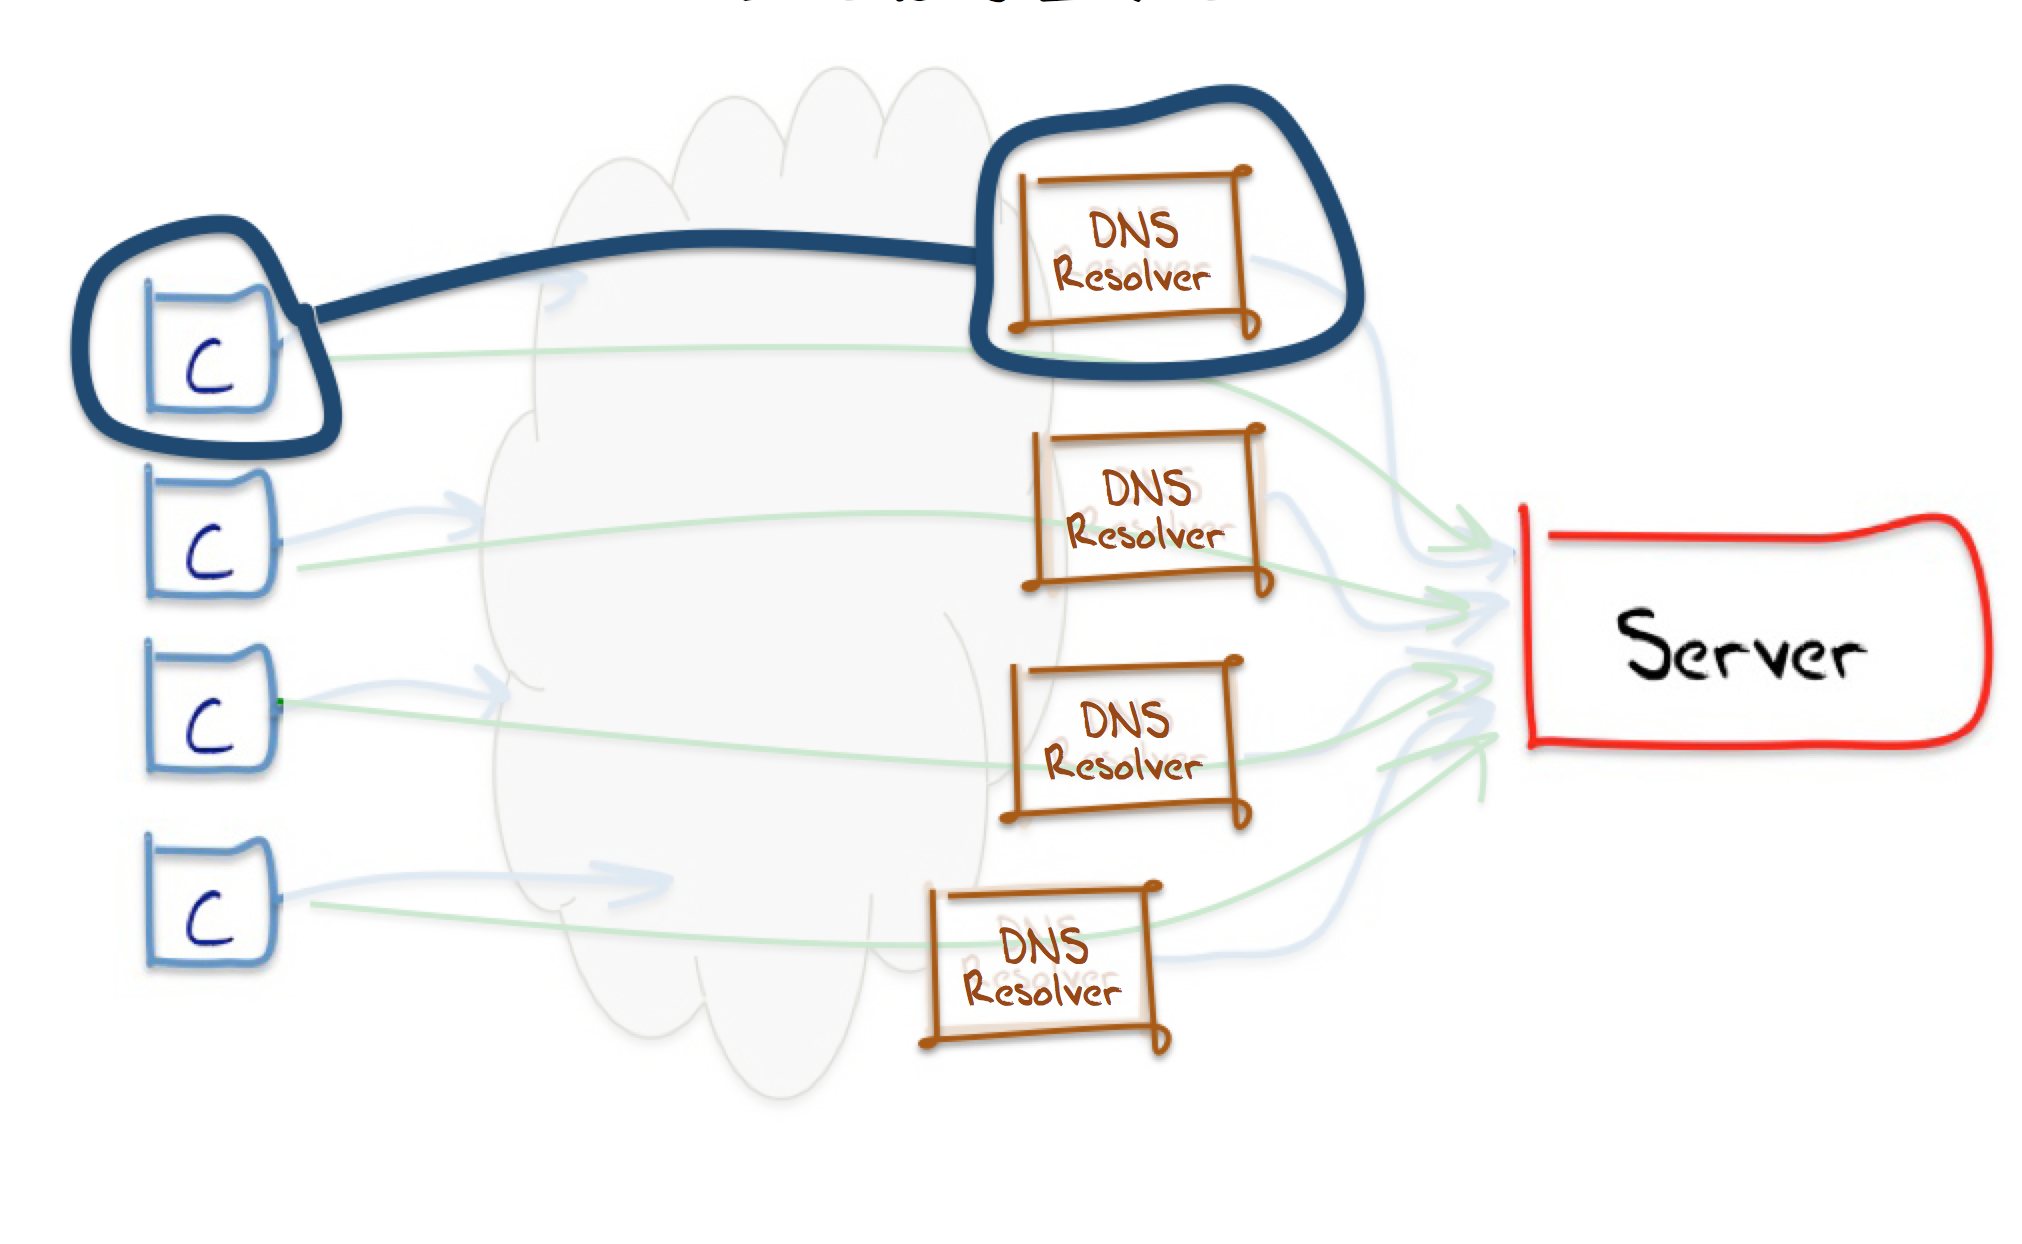
Figure 4 – Mapping Users to Visible Resolvers
Of course the client may have selected this resolver themselves, in which case they may be directly aware of which resolvers they use. Or they may be using a local access network, that has a local resolver that passes all its requests to a recursive forwarder who, in turn,… and so on. In this case the selection of the visible resolver may well be a choice that is completely opaque to the end user. So when we say that a client is “using a Google DNS service”, what we mean in this context is that the visible resolver that ultimately passes the DNS query to the authoritative name server is part of the Google Public DNS resolver collection.
Results
We ran an online advertisement with these URLS as fetch targets from the 9th to the 26th of May 2013. The experiment was invoked by 2,498,497 clients over this period. 92.8% of these experiments used visible resolvers that were not operated by Google. The other 7.2% of clients ultimately had their queries passed to the experiment’s authoritative name server from Google’s DNS servers.
That’s a very large number for a relatively recent service offering. The uptake of use of this service is certainly very impressive.
And if the logs of these DNS resolvers provide a useful insight as to the real time online activities of the end user population, then having a clear view of the activities of some 7% of the entire end user population of the Internet is a particularly valuable observational vantage point!
We can drill down into these numbers to get a bit more detail. The URL that is invalidly DNSSEC-signed returns a somewhat unhelpful error code back to the client, namely a SERVFAIL error, indicating some unspecified error on the part of the DNS server. All Google’s DNS servers perform DNSSEC validation, so they will return these codes to the DNS client who posed the query. If the client has alternate resolvers configured, then they will interpret this response as grounds to repeat the query to the alternate resolvers. From this behaviour we can see the number of clients who exclusively use Google’s Public DNS services, and those who have alternate servers. We observed that 5.3% of users exclusively used Google’s DNS servers, while 1.9% used Google in conjunction with other DNS resolvers.
Given that the end client’s IP address can also be geo-mapped into a country of origin with a reasonably level of certainty, its also possible to see if particular countries make significant use of Google’s service.
| Rank | CC | Count | ALL | MIXED | NOT | Country |
| 1 | VN | 25,784 | 39.2% | 2.8% | 58.0% | Vietnam |
| 2 | JM | 1,413 | 27.5% | 0.5% | 72.0% | Jamaica |
| 3 | GT | 1,720 | 25.3% | 11.1% | 63.5% | Guatemala |
| 4 | BN | 410 | 20.0% | 36.1% | 43.9% | Brunei Darussalam |
| 5 | ID | 50,935 | 19.0% | 5.4% | 75.6% | Indonesia |
| 6 | LA | 300 | 18.7% | 7.3% | 74.0% | Lao People's Democratic Republic |
| 7 | TR | 47,816 | 18.3% | 1.6% | 80.0% | Turkey |
| 8 | HN | 931 | 18.1% | 18.9% | 62.9% | Honduras |
| 9 | AZ | 6,970 | 17.9% | 31.2% | 50.8% | Azerbaijan |
| 10 | TZ | 297 | 16.2% | 23.6% | 60.3% | United Republic of Tanzania |
| 11 | NI | 992 | 16.0% | 40.1% | 43.8% | Nicaragua |
| 12 | BO | 1,295 | 16.0% | 17.3% | 66.7% | Bolivia |
| 13 | EG | 34,719 | 14.9% | 4.0% | 81.1% | Egypt |
| 14 | GH | 912 | 14.7% | 6.7% | 78.6% | Ghana |
| 15 | PS | 2,779 | 14.2% | 38.9% | 46.8% | Occupied Palestinian Territory |
| 16 | IT | 76,489 | 13.9% | 0.5% | 85.6% | Italy |
| 17 | DZ | 7,397 | 13.2% | 24.0% | 62.8% | Algeria |
| 18 | BD | 712 | 12.8% | 9.4% | 77.8% | Bangladesh |
| 19 | MY | 32,041 | 12.1% | 2.1% | 85.8% | Malaysia |
| 20 | UA | 25,124 | 11.9% | 2.7% | 85.4% | Ukraine |
Table 1 – Use of Google’s Public DNS by Country – May 2013</p>
The table shows the adoption of Google’s Public DNS by country. In terms of the relative level of penetration within countries this certainly shows that if Google’s aim through this facility was to provide services to the developing world, then this list is consistent with that overall objective, in so far as there is a relatively high level of representation here from such economies.
Further Results
Of course in June of this year Edward Snowden fled the United States, and released material relating to the until then covert eavesdropping activities of the National Security Agency of the United States. There has been some resulting public concern about the extent to which our online activities generate a rich plume of digital exhaust, and the extent to which others have been sniffing these fumes and generating accurate profiles of ourselves, not only as online users, but as consumers and as individuals. There is no published material whatsoever to assume that Google’s Public DNS service has been compromised in any way by such agency activity, but at the same time there is no undertakings by Google as to what use it makes of the DNS data generated by this free service, nor any undertakings that others may have had access to such data.
As Renesys reported at the end of October () Google’s DNS service has left Brazil, and the report suggests that this action by Google is in response to forthcoming Brazilian legislation that will require Internet companies operating in Brazil to store data about Brazilian users within Brazil.
Did the level of public use of Google’s Public DNS services change in response to these events?
We have re-run the same experiment in the ensuing months, and the picture is certainly not one of monotonically increasing up and to the right adoption of Google’s public DNS service. Numbers were at their lowest in August, when the stories of the Snowden revelations and their consequences appeared to be well covered throughout the world’s press. Since then the adoption rate has resumed its increase, and by November it appears that the level of use is back to where it was in May.
| All-Google | Mixed-Google | No-Google | |
| May-13 | 5.3% | 1.9% | 92.8% |
| Jul-13 | 4.6% | 2.1% | 93.4% |
| Aug-13 | 4.4% | 2.1% | 93.5% |
| Sep-13 | 4.7% | 2.1% | 93.2% |
| Oct-13 | 5.1% | 2.2% | 92.6% |
| Nov-13 | 5.0% | 2.4% | 92.6% |
Table 2 – Use of Google’s Public DNS May – November 2013
If we compare the September ’13 numbers against the May ‘13 numbers we can derive a national table of those countries where the level of use of Google’s DNS service fell over that period, and those countries where it rose. Table 3 shows the top 20 list of countries where use fell over that period, and Table 4 shows a comparable list where this use increased.
| Rank | CC | Delta OFF | MAY% | SEP % | Country |
| 1 | NI | 37.7% | 56.1% | 18.3% | Nicaragua |
| 2 | PS | 22.7% | 53.1% | 30.4% | Occupied Palestinian Territory |
| 3 | BO | 21.5% | 33.2% | 11.7% | Bolivia |
| 4 | BN | 10.2% | 56.1% | 45.8% | Brunei Darussalam |
| 5 | KE | 8.2% | 27.5% | 19.2% | Kenya |
| 6 | AL | 6.4% | 16.7% | 10.3% | Albania |
| 7 | LA | 6.3% | 26.0% | 19.6% | Lao People's Democratic Republic |
| 8 | MZ | 6.3% | 17.5% | 11.2% | Mozambique |
| 9 | PK | 6.1% | 18.2% | 12.0% | Pakistan |
| 10 | JM | 5.3% | 27.9% | 22.6% | Jamaica |
| 11 | TR | 5.2% | 19.9% | 14.7% | Turkey |
| 12 | AZ | 5.1% | 49.1% | 43.9% | Azerbaijan |
| 13 | TZ | 4.9% | 39.7% | 34.7% | United Republic of Tanzania |
| 14 | GT | 3.5% | 36.4% | 32.9% | Guatemala |
| 15 | BA | 3.1% | 9.0% | 5.8% | Bosnia and Herzegovina |
| 16 | SR | 2.5% | 5.0% | 2.5% | Suriname |
| 17 | IT | 2.3% | 14.4% | 12.0% | Italy |
| 18 | EG | 2.2% | 18.8% | 16.6% | Egypt |
| 19 | UG | 2.1% | 18.4% | 16.3% | Uganda |
| 20 | AF | 2.1% | 50.2% | 48.1% | Afghanistan |
Table 3 – Falling Use of Google’s Public DNS: May to September ‘13
And the list where use increased over the same period:
| Rank | CC | Delta ON | MAY% | SEP% | Country |
| 1 | KH | 21.7% | 9.5% | 31.2% | Cambodia |
| 2 | TN | 18.7% | 4.3% | 23.0% | Tunisia |
| 3 | EU | 17.0% | 8.2% | 25.2% | European Union* |
| 4 | DZ | 16.1% | 37.1% | 53.3% | Algeria |
| 5 | NG | 15.7% | 29.9% | 45.7% | Nigeria |
| 6 | AM | 15.1% | 10.0% | 25.2% | Armenia |
| 7 | MW | 14.4% | 24.7% | 39.1% | Malawi |
| 8 | AW | 9.1% | 2.8% | 11.9% | Aruba |
| 9 | BD | 8.2% | 22.1% | 30.4% | Bangladesh |
| 10 | LK | 8.2% | 3.7% | 11.9% | Sri Lanka |
| 11 | ZW | 7.6% | 22.1% | 29.7% | Zimbabwe |
| 12 | GH | 7.3% | 21.3% | 28.7% | Ghana |
| 13 | IQ | 6.9% | 22.0% | 29.0% | Iraq |
| 14 | MV | 6.5% | 18.9% | 25.5% | Maldives |
| 15 | BH | 5.6% | 7.9% | 13.6% | Bahrain |
| 16 | MM | 5.5% | 11.4% | 16.9% | Myanmar |
| 17 | PH | 5.2% | 7.0% | 12.2% | Philippines |
| 18 | VN | 5.1% | 42.0% | 47.1% | Vietnam |
| 19 | DO | 4.3% | 5.3% | 9.6% | Dominican Republic |
| 20 | AR | 4.0% | 6.9% | 11.0% | Argentina |
* The EU entry is an anomaly - some resources in Europe are not geo-located to an individual country, but are listed as the EU region. This entry is not to be confused with the aggregation of all EU countries!
Table 4 – Rising Use of Google’s Public DNS: May to September ‘13
A similar picture can be drawn at the level of networks whose clients have their DNS queries directed to Google’s Public DNS service. Table 5 shows this for the top 20 such networks, using the originating AS as the network indicator, for September 2013.
| Rank | AS | Count | ALL | MIXED | NO | ASName |
| 1 | 45899 | 4,449 | 51.4% | 2.0% | 46.4% | VNPT-AS-VN VNPT Corp,VN,Vietnam |
| 2 | 7552 | 1,597 | 38.6% | 1.8% | 59.5% | VIETEL-AS-AP Vietel Corporation,VN,Vietnam |
| 3 | 18403 | 2,560 | 35.9% | 1.1% | 62.8% | FPT-AS-AP T, Technology,VN,Vietnam |
| 4 | 4230 | 505 | 29.1% | 11.4% | 59.4% | EMBRATEL-EMPRESA BRASILEIRA DE TELECOMUNIC, Brazil |
| 5 | 34296 | 440 | 26.1% | 46.5% | 27.2% | MILLENICOM-AS MILLENI.COM,DE,Germany |
| 6 | 17762 | 315 | 26.0% | 22.8% | 51.1% | HTIL-TTML-IN-AP Tata Teleservices Maharashtra Ltd,IN,India |
| 7 | 17974 | 7,162 | 25.1% | 5.4% | 69.4% | TELKOMNET-AS2-AP PT Telekomunikasi Indonesia,ID,Indonesia |
| 8 | 3549 | 529 | 22.5% | 6.4% | 71.0% | GBLX Global Crossing Ltd.,US,United States of America |
| 9 | 131090 | 583 | 19.9% | 15.6% | 64.4% | CAT-IDC-4BYTENET-AS-AP ,TH,Thailand |
| 10 | 131222 | 577 | 19.7% | 24.9% | 55.2% | MTS-INDIA-IN 334,Udyog Vihar,IN,India |
| 11 | 8452 | 6,612 | 19.3% | 6.5% | 74.1% | TE-AS TE-AS,EG,Egypt |
| 12 | 8517 | 452 | 19.2% | 8.8% | 71.9% | ULAKNET National Academic Network,TR, Turkey |
| 13 | 174 | 596 | 19.1% | 3.8% | 77.0% | COGENT Cogent/PSI, US,United States of America |
| 14 | 55824 | 558 | 18.6% | 14.8% | 66.4% | RSMANI-NKN-AS-AP National Knowledge Network,IN,India |
| 15 | 17451 | 455 | 18.4% | 4.8% | 76.7% | BIZNET-AS-AP BIZNET NETWORKS,ID,Indonesia |
| 16 | 9387 | 280 | 17.8% | 37.1% | 45.0% | AUGERE-PK AUGERE-Pakistan,PK,Pakistan |
| 17 | 36947 | 6,806 | 17.7% | 36.2% | 45.9% | ALGTEL-AS,DZ,Algeria |
| 18 | 14754 | 981 | 17.3% | 5.4% | 77.2% | Telgua,GT,Guatemala |
| 19 | 18101 | 1,009 | 16.9% | 6.5% | 76.5% | Reliance Communications.DAKC MUMBAI,IN,India |
| 20 | 20960 | 269 | 16.3% | 6.6% | 76.9% | TKTELEKOM-AS TK Telekom sp. z o.o.,PL,Poland |
Table 5 – Use of Google’s Public DNS by Network: September ‘13
And again its possible to look at those networks where the change in use has varied between May and September. The following two tables show the top 20 networks with falling and rising use.
| Rank | AS | Delta OFF | May | Sep | AS Name |
| 1 | 17754 | 62.4% | 75.9% | 13.5% | EXCELL-AS Excellmedia,IN,India |
| 2 | 15975 | 46.9% | 57.9% | 10.9% | Hadara,PS,Occupied Palestinian Territory |
| 3 | 14754 | 14.7% | 37.4% | 22.7% | Telgua,GT,Guatemala |
| 4 | 38547 | 14.2% | 38.9% | 24.7% | WITRIBE PAKISTAN,PK,Pakistan |
| 5 | 10620 | 13.2% | 16.2% | 3.0% | Telmex Colombia S.A.,CO,Colombia |
| 6 | 45609 | 10.7% | 12.4% | 1.7% | BHARTI-AS Bharti Airtel,IN,India |
| 7 | 36423 | 7.6% | 18.0% | 10.3% | SAN-JUAN-CABLE,PR,Puerto Rico |
| 8 | 45595 | 7.4% | 14.2% | 6.8% | Pakistan Telecom Company,PK,Pakistan |
| 9 | 34984 | 6.9% | 20.4% | 13.4% | Tellcom Iletisim Hizmetleri,TR,Turkey |
| 10 | 47524 | 6.8% | 19.3% | 12.4% | TURKSAT-AS Turksat,TR,Turkey |
| 11 | 12978 | 6.8% | 21.6% | 14.8% | DOGAN-ONLINE,TR,Turkey |
| 12 | 4780 | 6.3% | 21.5% | 15.1% | SEEDNET Digital United Inc.,TW,Taiwan |
| 13 | 34569 | 6.2% | 6.2% | 0.0% | NETWORX-BG Networx-Bulgaria,BG,Bulgaria |
| 14 | 44957 | 5.5% | 15.9% | 10.4% | OPITEL Vodafone Omnitel N.V.,IT,Italy |
| 15 | 131090 | 5.4% | 41.0% | 35.5% | CAT-IDC-4BYTENET-AS-AP ,TH,Thailand |
| 16 | 47331 | 5.3% | 18.6% | 13.3% | TTNET TTNet A.S.,TR,Turkey |
| 17 | 8612 | 5.1% | 14.2% | 9.1% | TISCALI-IT Tiscali Italia S.P.A.,IT,Italy |
| 18 | 9498 | 4.7% | 24.7% | 20.0% | BBIL-AP BHARTI Airtel Ltd.,IN,India |
| 19 | 9121 | 4.7% | 19.2% | 14.5% | TTNET Turk Telekomunikasyon,TR,Turkey |
| 20 | 8452 | 4.4% | 30.3% | 25.8% | TE-AS TE-AS,EG,Egypt |
Table 6 – Falling Use of Google’s Public DNS by Network: May to September ‘13
| Rank | AS | Delta ON | May | Sep | AS Name |
| 1 | 45356 | 64.7% | 0.2% | 64.9% | MOBITEL-LK,,LK,Sri Lanka |
| 2 | 2609 | 24.7% | 5.4% | 30.1% | Tunisia BackBone AS,TN,Tunisia |
| 3 | 6648 | 18.6% | 26.8% | 45.5% | Bayan Telecommunications,PH,Philippines |
| 4 | 36947 | 17.3% | 36.6% | 54.0% | ALGTEL-AS,DZ,Algeria |
| 5 | 131222 | 13.8% | 30.9% | 44.7% | MTS-INDIA, Udyog Vihar,IN,India |
| 6 | 16637 | 11.2% | 6.2% | 17.5% | MTNNS-AS,ZA,South Africa |
| 7 | 18403 | 9.0% | 28.1% | 37.1% | FPT-AS-AP,VN,Vietnam |
| 8 | 12066 | 7.8% | 2.7% | 10.5% | TRICOM,DO,Dominican Republic |
| 9 | 10029 | 7.8% | 7.8% | 15.6% | Citycomnetworks-As Citycom,IN,India |
| 10 | 11664 | 6.9% | 12.7% | 19.6% | Techtel LMDS,AR,Argentina |
| 11 | 10139 | 6.0% | 1.4% | 7.4% | Smart Broadband, Inc.,PH,Philippines |
| 12 | 6939 | 5.8% | 5.6% | 11.5% | Hurricane Electric, Inc.,US,United States |
| 13 | 8997 | 5.7% | 8.7% | 14.5% | Rostelecom,RU,Russian Federation |
| 14 | 4755 | 5.2% | 14.1% | 19.3% | TATA Communications,IN,India |
| 15 | 55824 | 5.0% | 28.4% | 33.5% | RSMANI, National Knowledge Net,IN,India |
| 16 | 45899 | 4.5% | 49.0% | 53.5% | VNPT-AS-VN VNPT Corp,VN,Vietnam |
| 17 | 6503 | 4.1% | 4.4% | 8.6% | Axtel, S.A.B. de C.V.,MX,Mexico |
| 18 | 10292 | 4.1% | 2.5% | 6.7% | CWJAM ASN-CWJAMAICA,JM,Jamaica |
| 19 | 7303 | 4.0% | 5.5% | 9.5% | Telecom Argentina S.A.,AR,Argentina |
| 20 | 9829 | 3.9% | 4.4% | 8.4% | BSNL National Internet Backbone,IN,India |
Table 7 – Rising Use of Google’s Public DNS by Network: May to September ‘13
Conclusions
There is no doubt in the value of Google’s public DNS service.
It’s a welcome step to see a DNS resolution service take DNS security seriously, and validate the responses that they pass back to their clients. It’s also a welcome step to see a very large scale DNS service operate using dual stack capabilities. The Google service operates with integrity and does not appear to filter the DNS in arbitrary ways. And it’s well engineered, so it’s fast and reliable. And it’s free. So these are all good reasons to use the service.
But of course TNSTAAFL, and while there is no specific information from Google as to how the p-DNS data might be used by the company, there is no doubt that a real time feed of the online activities of some 7% of the entire Internet user base is a rich vein of information, and this data stream could be added to the existing corporate information sets to add to the accuracy of the individual profiles that fuel their advertising business. Whether the same information is accessible to various US government agencies, and under what terms, is not something that appears to have been mentioned in the recent disclosures.
For some, this may be an acceptable tradeoff of some level of information about their online use in exchange for service. For others such an exchange may be a step too far. And for others the decision has been placed out of their hands, as their service provider may have decided to use Google’s service in any case. But in the morass of the other issues with the DNS, including the various forms of exploitation and attack, and the ongoing issues with the DNS being perverted to perform massive DOS attacks, the various forms of use of DNS-like names in differing contexts, new and old TLDs, colliding names, IDNs and every other topic that forms the universe of DNS discourse, its still really encouraging for me to see that there are still some folk are talking high quality DNS resolution performance seriously!
![]()
Disclaimer
The views expressed are the authors' and not those of APNIC, unless APNIC is specifically identified as the author of the communication. APNIC will not be legally responsible in contract, tort or otherwise for any statement made in this publication.
![]()
About the Author
GEOFF HUSTON B.Sc., M.Sc., has been closely involved with the development of the Internet for many years, particularly within Australia, where he was responsible for the initial build of the Internet within the Australian academic and research sector. He is author of a number of Internet-related books, and has been active in the Internet Engineering Task Force for many years.