|
The ISP Column
An occasional column on things Internet
|
|
|
Other Formats:
|
|
|
|
|
When?
September 2010
Geoff Huston
At the October 2010 ARIN meeting the inevitable question came up once more in one of the open microphone sessions: "Exactly when are we going to run out of IPv4 addresses? Could you please provide the date when the first request for an allocation of IPv4 address space will be refused?"
I have been publishing such a date for some years now at http://ipv4.potaroo.net (which, by the way, currently predicts that IANA will hand out its last IPv4 address blocks on 10 June 2011, and also predicts that APNIC will be the first RIR to exhaust its pool, predicted to occur on the 29th January 2012), but I'll be the first to admit that it's a pretty unreliable forecast.
Paradoxically, the closer we get to exhaustion the less reliable this forecast becomes. Other models predict that IANA pool exhaustion will occur in the first quarter of 2010 (http://www.tndh.net/~tony/ietf/ipv4-pool-combined-view.pdf) rather than closer to the middle of the year. Why do these predictions disagree by as much as 6 months? Surely, as we get closer to exhaustion, the easier it is to predict the time when that last address block heads out the door? What's so hard about agreeing on a date when the addresses will run out?
It's hard to make an accurate prediction with high confidence, and in this column I'd like to spend a little time explaining why the remaining life for IPv4 is becoming less certain rather than more certain as the pool drains out to the bottom, and offer a more useful prediction that encompasses the degree of variance that lies behind the data sets being used to model predictions of IPv4 address exhaustion.
There are two main factors here that introduce uncertainty onto the predictive models: firstly we are operating in a bi-modal world of elephants and mice, and secondly, it's not a single draining function operating on a single pool, but five independent entities each with their own draw rate pulling chunks from the central pool. I'd like to explore these two factors in a little more detail before heading into the statistics.
Of Elephants and Mice
Statistical predictive techniques all start with the premise that tomorrow will be much like today. Even though this will not be the case for everyone, it will be the case for so many folk that we can refine this a little to say: "on average, tomorrow will be a lot like today". But this is a steady state world, which does not match the changes we see over time. So we can refine this technique to include the second premise, that, "on average, the differences that we observed between yesterday and today will be present as differences between today and tomorrow". Now. if the take a single individual case this will probably not be the case. Individuals do not typically behave in such a precise regular pattern (or perhaps we do, but that's a different area of behavioural study!). But taken in large enough numbers, in other words looking at the collective actions of masses of individuals, the individual variations are less important, and the average of all the individuals becomes a more accurate description of the group as a whole. In other words groups tend to behave with a higher degree of statistical alignment than individuals.
So we can apply this statistical analysis to the group of entities who draw addresses from the address registries, and look at the average rate of address consumption, and also look at the variation over time. The first figure is a plot of the amount of addresses allocated by the RIRs since 1 January 2005.
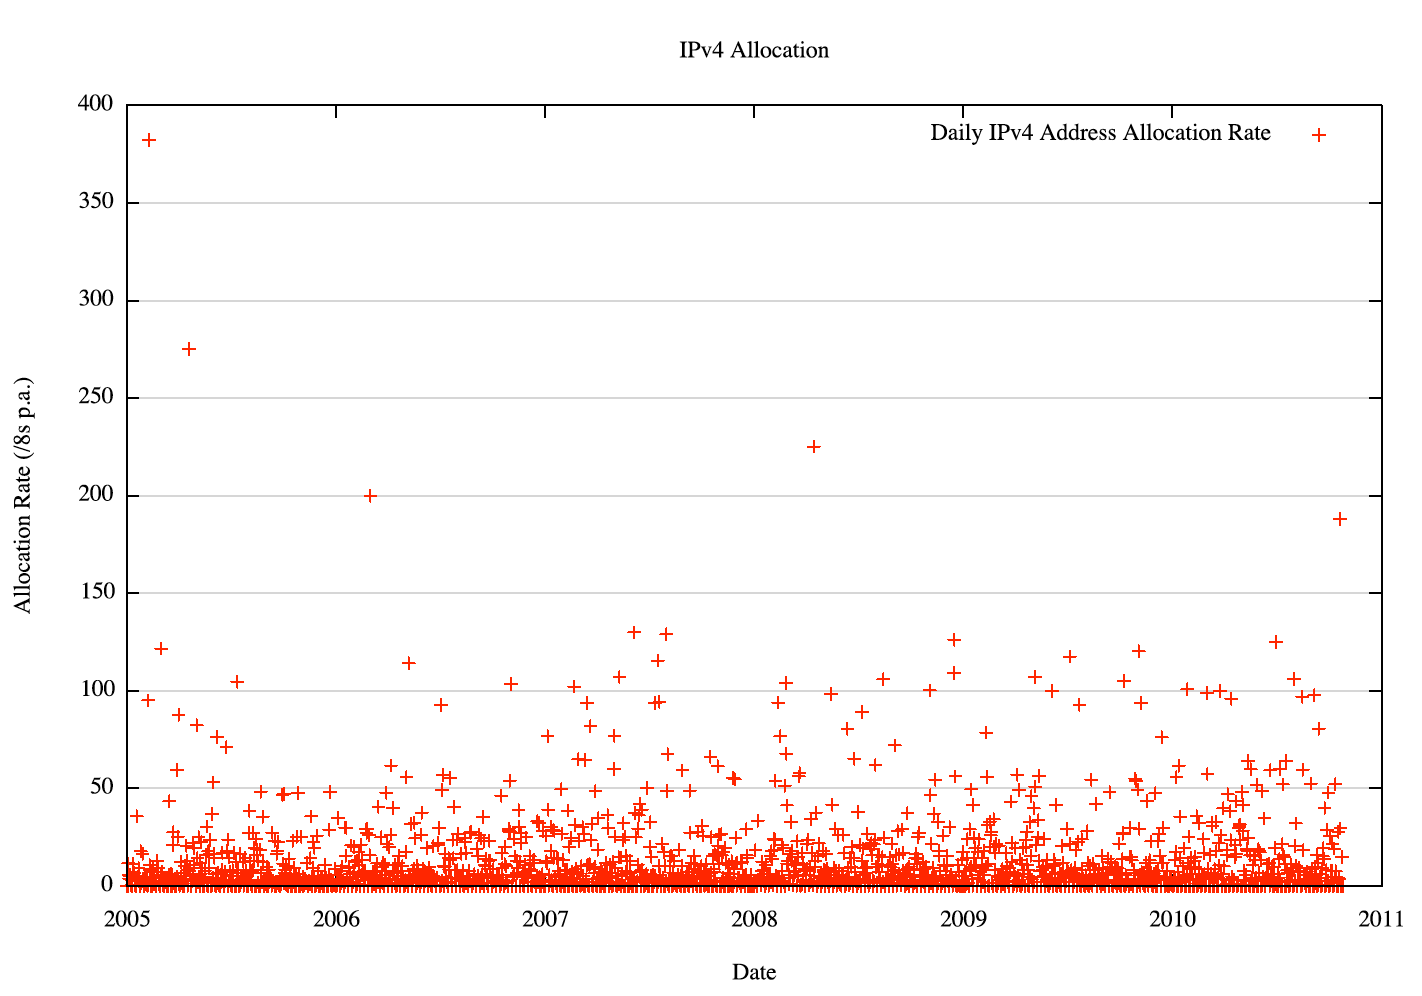
Figure 1 - Daily IPv4 Address Allocations: 2005 to the present
This is a very "noisy" sequence, with a small number of high value outliers that correspond to those days when large allocations of a /8 or /9 in size were made. The underlying trend in the data sequence is drowned out by these variants. But there is some form of trend within the data, perhaps best seen if we use a logarithmic scale for the individual data points, as shown in Figure 2.
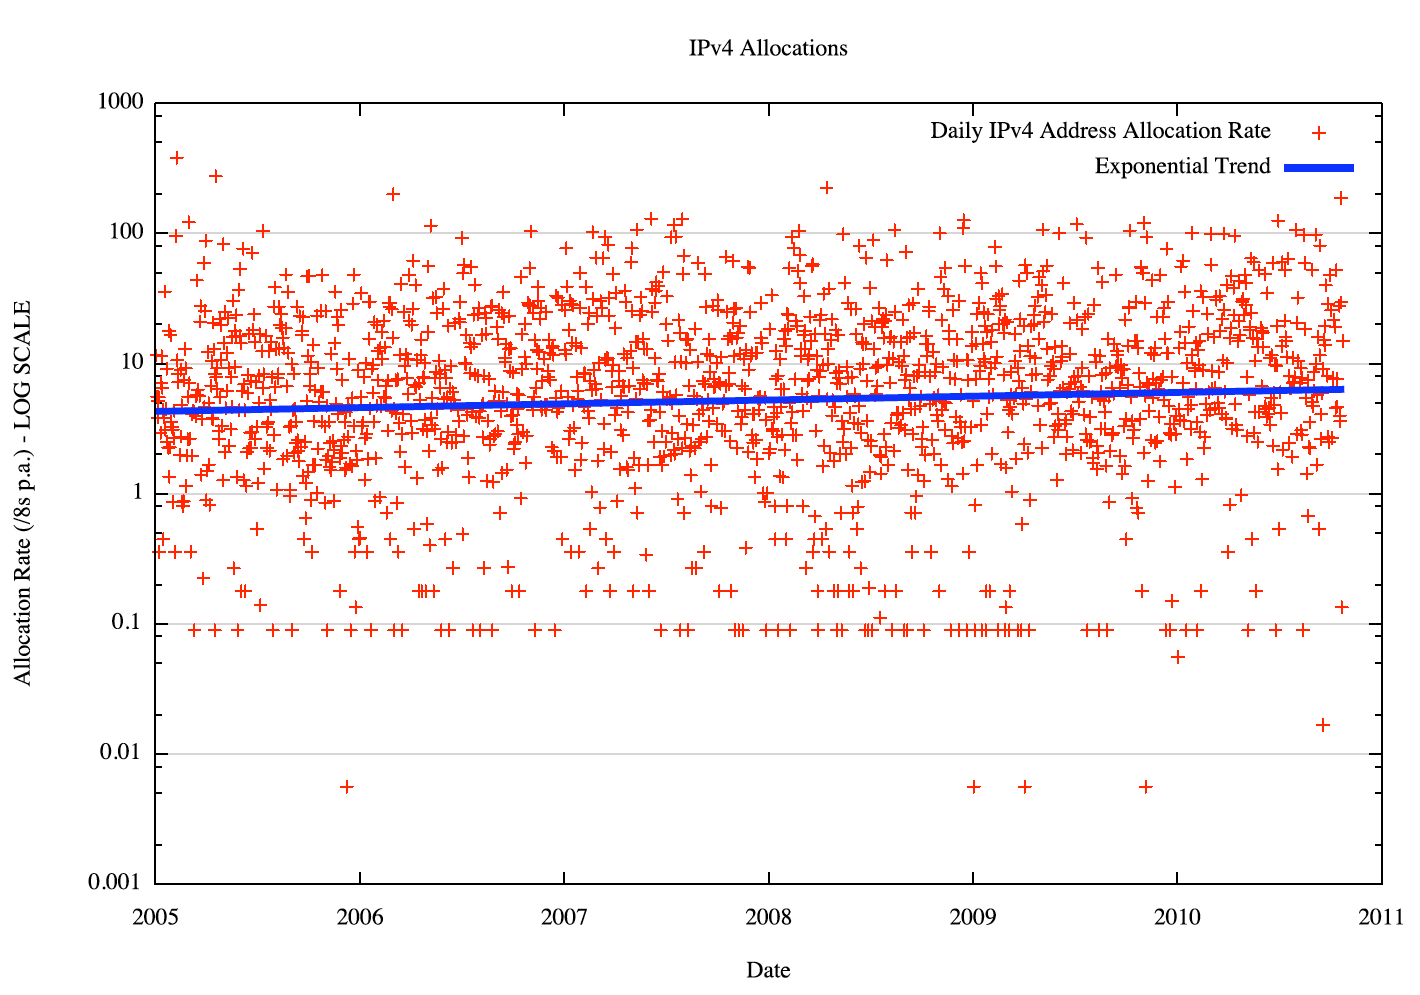
Figure 2 - Daily IPv4 Address Allocations: 2005 to the present - log scale
But perhaps a more critical question to ask is: What is causing this statistical "noise" and is it significant? Underlying this question is a question about the "uniformity" of the population that draws addresses from the pool. Are we seeing the result of a large number of individual transactions, or is this high level of variance caused by a skew in the distribution of individual allocations?
Since address allocations are a reflection of the nature of the Internet industry itself we can rephrase this question somewhat: How "balanced" is this industry? Do we see a diverse collection of actors between large and small? Or has this industry bifurcated into a small number of very large entities and a larger pool of small entities? To address this question, the address allocation profile can reveal a lot about the "profile" of this industry.
Lets looks at the set of recent allocations, performed from 1 January 2010 to the last week of October 2010, and look at the range of sizes of address allocations:
Allocation
SizeNumber of
allocationsTotal Address
Count% of total Cumulative % /9 1 8,388,608 4.42% 4.42% /10 3 12,582,912 6.63% 11.05% /11 14 29,360,128 15.47% 26.51% /12 37 38,797,312 20.44% 46.95% /13 54 28,311,552 14.91% 61.87% /14 81 21,233,664 11.19% 73.05% /15 113 14,811,136 7.80% 80.85% /16 218 14,286,848 7.53% 88.38% /17 187 6,127,616 3.23% 91.61% /18 287 4,702,208 2.48% 94.08% /19 448 3,670,016 1.93% 96.02% /20 904 3,702,784 1.95% 97.97% /21 1,135 2,324,480 1.22% 99.19% /22 945 967,680 0.51% 99.70% /23 520 266,240 0.14% 99.84% /24 1,153 295,168 0.16% 100.00% Total 6,100 189,828,352
(11.31 /8s>
Table 1 - IPv4 Address Allocations Jan 2010 - October 2010
Of the 6,100 individual allocations performed in the 10 months from 1 January 2010 until the end of October 2010, some 55 allocations, or less than 1% of all allocations within the RIR system, accounted for 47% of all allocated addresses, or the equivalent of 5.3 /8s.
This makes any statistical predictive technique challenging, as the exercise is no longer some form of average applied to a large population, but instead we see the outcomes in terms of address distribution being heavily influenced by the actions of a relatively small number of entities who each request a /12 or greater when they request an IPv4 address allocation from the address registry.
Who are these folk? Sorting through the allocation data published by the RIRs it is possible to list those entities who received a 11 or larger in 2010:
Registry Country
CodeAllocation Date Entity arin US 50.128.0.0/9 2010-10-21 Comcast Cable Communications Holdings, Inc apnic KR 175.192.0.0/10 2010-01-27 Korea Telecom lacnic MX 187.192.0.0/10 2010-03-25 Uninet S.A. de C.V. apnic CN 223.64.0.0/10 2010-07-01 China Mobile Communications Corporation apnic AU 1.128.0.0/11 2010-05-18 Telstra apnic KR 1.224.0.0/11 2010-07-19 SK Broadband Co Ltd apnic KR 14.32.0.0/11 2010-08-02 Korea Telecom apnic KR 14.64.0.0/11 2010-08-02 Korea Telecom apnic VN 14.160.0.0/11 2010-08-16 VietNam Post and Telecom Corporation apnic VN 14.224.0.0/11 2010-08-16 VietNam Post and Telecom Corporation apnic CN 27.192.0.0/11 2010-04-14 China Unicom ripencc FR 77.128.0.0/11 2010-08-31 SFR France arin US 107.224.0.0/11 2010-10-01 AT&T Mobility LLC arin US 184.192.0.0/11 2010-05-13 Sprint Nextel Corporation lacnic BR 186.192.0.0/11 2010-03-03 Comite Gestor da Internet no Brasil (Brasillian National Registry) lacnic BR 186.224.0.0/11 2010-07-08 Comite Gestor da Internet no Brasil (Brasillian National Registry) apnic KR 223.32.0.0/11 2010-08-17 SK Telecom
Table 2 - Large IPv4 Address Allocations Jan 2010 - October 2010
Currently, the remaining pool of unallocated addresses numbers within the RIR system is the equivalent of 26.84 /8s (excluding all reserved addresses, and excluding the 5 /8s that have been set aside within the RIR system as the "last /8s". If the distribution of allocation sizes continues in the coming months, then some 13/8s, or a little under one half of this remaining space will be allocated in just 140 allocation transactions, and the largest 42 individual allocations will account for some 7 /8s.
If we want to understand when we are going to run down the address pool then we are not looking at the average of some 7,000 individual allocations per year, but the likely timing of the largest 20 or so transactions each year, and in the time remaining between now and exhaustion of the pool we are looking at the timing of the next 10-20 such large transactions, as they will effectively determine the date when the available address pool is exhausted.
Not 1 but 6
So far I've been looking at this in terms of a single pool of addresses and a single queue of entities who are drawing down from that pool in individual transactions. But this is not the case, and instead we need to look at this as a 6-party model, comprising of the IANA and the 5 individual RIRs.
The current set of practices regarding the behaviour of the RIRs in their interaction with IANA is described at http://www.icann.org/en/general/allocation-IPv4-rirs.html, plus a number of additional constraints that the RIRs have collectively imposed upon their interactions with IANA for additional IPv4 address allocations:
Each RIR will request further space from the IANA when its local pool of unallocated addresses reaches the lower of 33,554,432 addresses (or 2 /8s) and an amount of address space equal to 1.5 times the amount of address space allocated over the previous 6 months, or when its local pool reaches 8,388,608 addresses (or 1/2 /8).
The amount of address space the RIR will receive from the IANA :
The lower of 2 /8s and sufficient /8s to encompass a further 18 months of allocations, based on three times the total of the previous 6 months of allocations.
IANA has reserved the last 5 /8s, and will not hand them out using the above algorithm. Instead, when IANA hands out its 6th last /8, it will then distribute the last 5 /8s as well, distributing 1 /8 to each RIR.
In order to model this behaviour it is necessary to model each RIR's behaviour independently as a distinct consumer of /8s from the IANA pool. The number of /8s each RIR receives from IANA will depend not only on the RIR's own address allocation rate, but also on the allocation rates of the other RIRs. The time until IANA pool exhaustion is therefore an outcome of this interaction between the RIRs.
In order to predict the date of the first RIR to exhaust its local address pool, an additional address pool has to be factored in. There are a further 7.57 /8s that are part of the "Various Pool". These addresses are drawn from the pool of Class B and Class C addresses using the predecessor to the RIR system for general allocation. The RIRs plan to distribute the unallocated "gaps" in these address blocks equally between the RIRs, using a distribution described in http://bgp.potaroo.net/stats/nro/various.html. (It is noted that the apparent disparity in the allocation to the RIPE NCC is due to some interim allocation activity undertaken by the RIPE NCC in 188/8.)
Theme and Variations
A model of IPv4 address exhaustion is described at http://ipv4.potaroo.net. However, the weakness of this model is that it does not provide any consideration of variance based on the interaction between large and small allocations, and the interaction between the various RIRs.
I'd like to compare this earlier model with one presented here that factors in variance in the data and describes the effective date of exhaustion as a range of dates with an associated confidence level. To do this it is necessary to apply a model of variance to the underlying data.
For this exercise I'll use monthly allocation data rather than daily data. Figure 3 shows the allocations per month for all 5 RIRs for the period 2005 to the present.
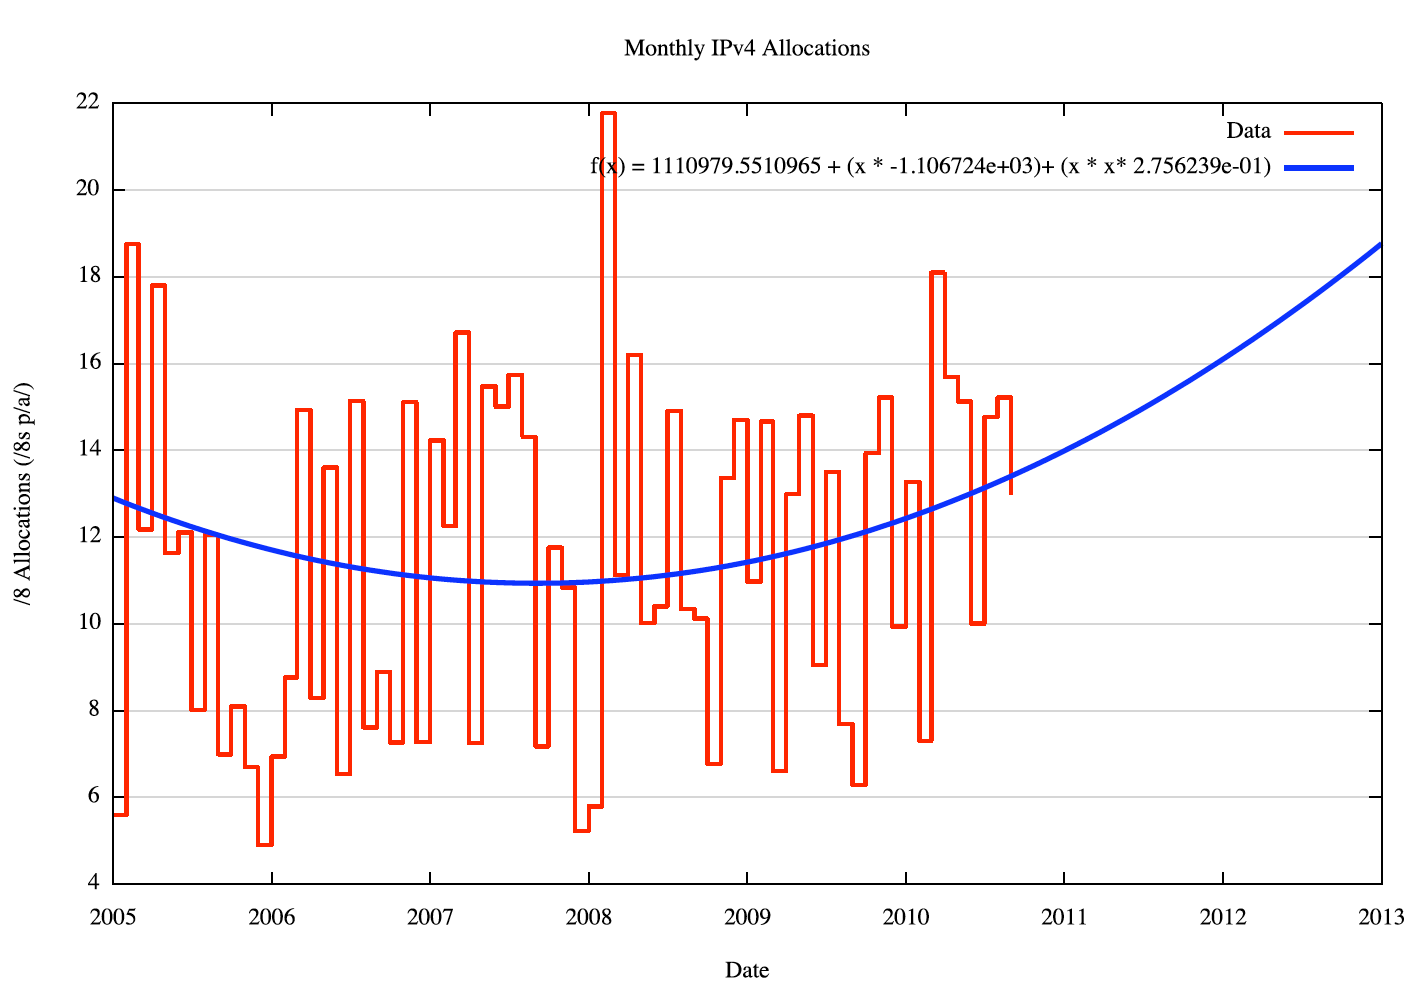
Figure 3 - Monthly IPv4 address allocations
The most striking feature of this data set is that the variance of this data series is quite high. The standard deviation from an O(2) polynomial best fit to this data is 3.8, indicating that each month's data is likely (within a confidence level of 95%) to vary from the fitted curve by the equivalent of +/- 7.6 /8s p.a., assuming a normal distribution of variance.
An analysis of the variance of this data is show in Figure 4, showing a smoothed plot of the distribution of variance from the curve fit, over the period 2005 - 2009. The distribution of data is close to a normal distribution, with a heavy tail on the positive variance, as is expected in an data set where the negative variance is bounded by the zero point and the positive variance is bounded by indirect constraints that admit a significantly higher level of potential variance.
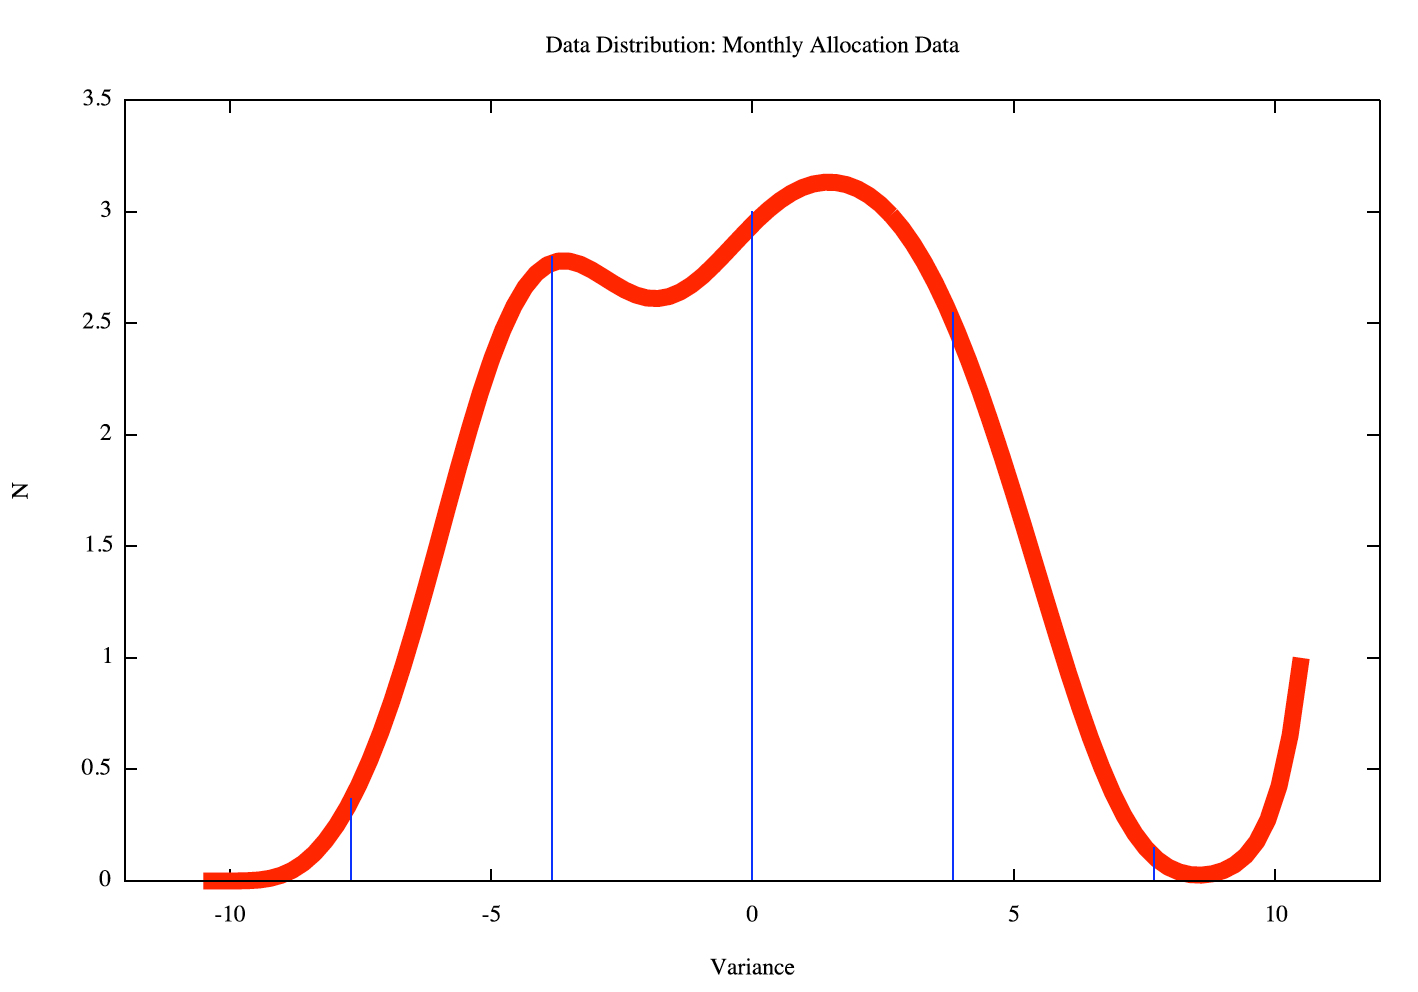
Figure 4 - Distribution of Monthly Address Allocation Data
The next step is to apply this variance to the model of address consumption, and run a number of "experiments" on the run out process.
The first step is to create a model of address consumption for each RIR. The same technique as shown above, namely of constructing a base data set of monthly allocations for each RIR, and then linear regression is used to find an O(2) polynomial best fit to the data.
In order to ensure that the most recent consumption data is of greater relative importance in determining a curve of best fit, the monthly address allocation data is relatively weighted, as per Table 3.
Year Relative Weight 2005 1 2006 1 2007 5 2008 5 2009 20 2010 20
Table 3 - Relative Weighting Applied to Allocation Data
The monthly allocation data, and the O(2) polynomial curve of best fit using linear regression applied to the weighted data, for each RIR, is shown in the following figures.
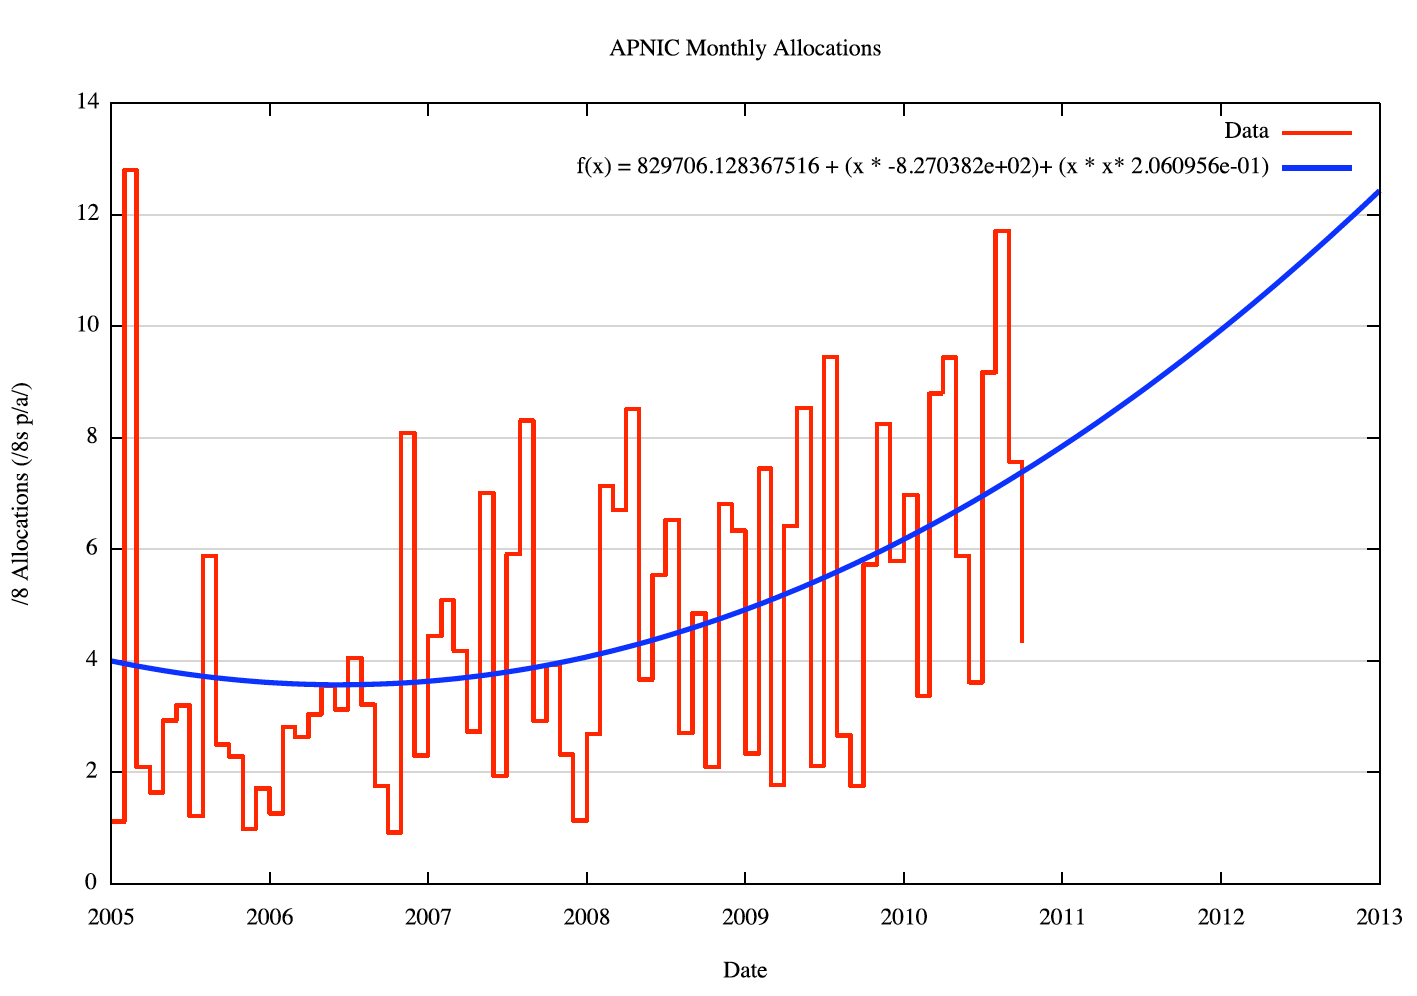 Figure 5 - APNIC Monthly Allocations |
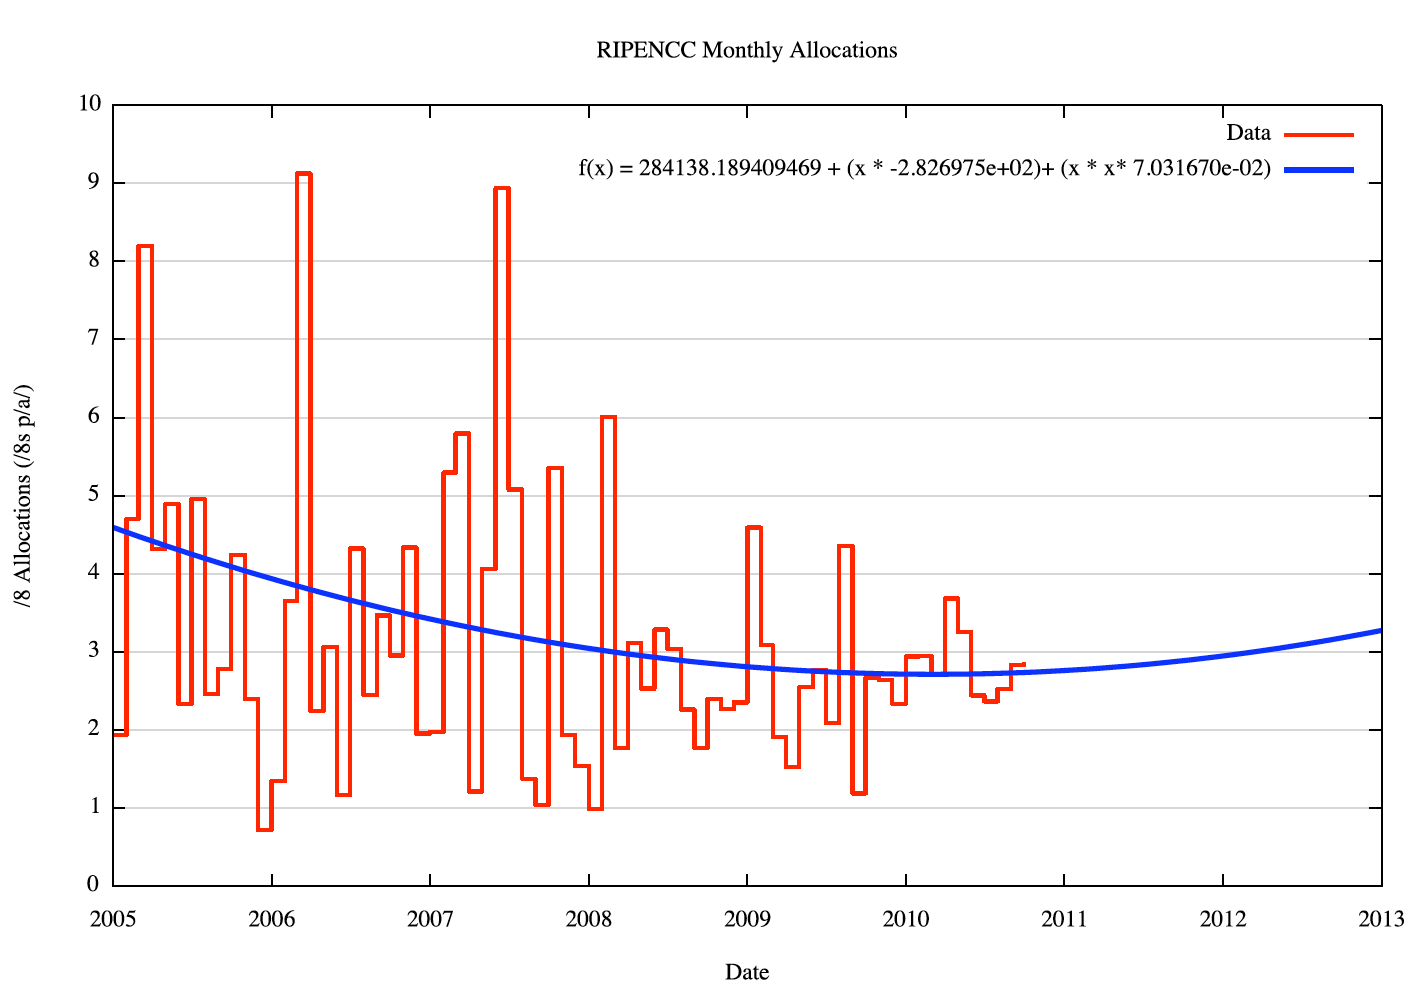 Figure 6 - RIPE NCC Monthly Allocations |
 Figure 7 - ARIN Monthly Allocations |
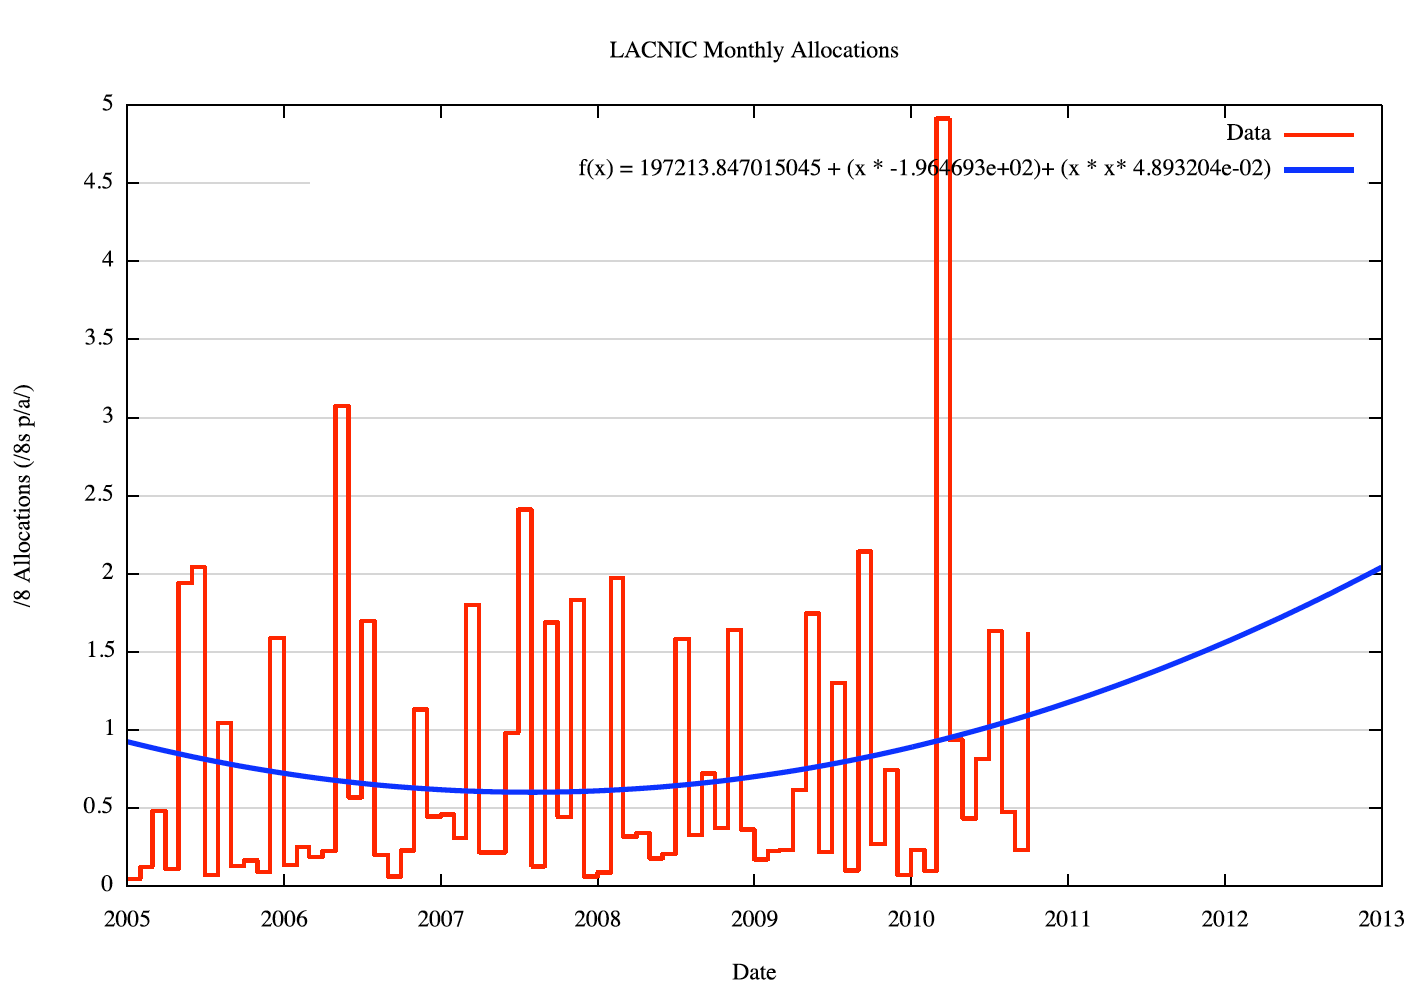 Figure 8 - LACNIC Monthly Allocations |
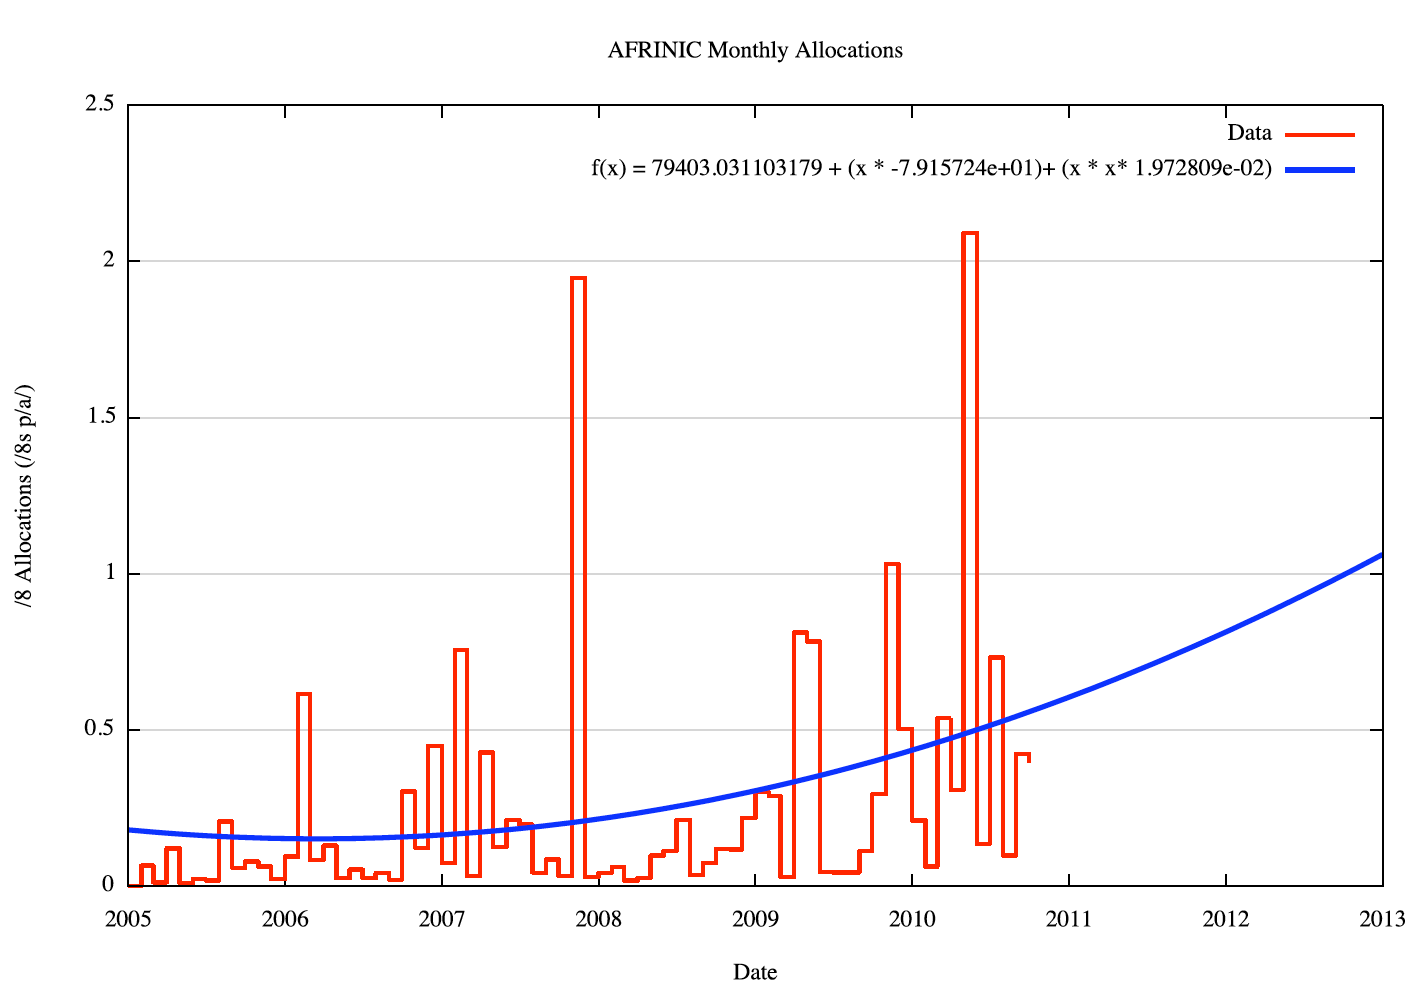 Figure 9 - AFRINIC Monthly Allocations |
The technique used here is to project each RIR's address demands forward using the O(2) polynomial curve as the predicted address demand. However, the model also applies randomly generated variance to each projected data point of monthly address consumption. The amount of monthly variation is generated using the same variance distribution derived from the variance of the 2007-2010 data from the fitted curve.
This then creates a set of 5 address consumption amounts per month, one for each RIR. The procedure is fired off with the current levels of available space in each RIR. When any RIR falls below the low threshold, and IANA still has remaining address blocks, the model will perform an IANA allocation as per the previously described algorithm. One IANA has handed out the last 5 /8s the model also distributes the remaining legacy B and C space to the RIRs.
In running this model, the data point of interest here is the time at which IANA reaches the low threshold of 5 /8s (at which time these last /8s are distributed to each RIR). At this point in time the IANA is effectively exhausted of available Ipv4 addresses.
The experiment in modeling the coming months using the statistical model has been executed 1 million times to obtain a distribution of expected exhaustion dates. From this the mean and the mean standard deviation values were obtained.
IANA Exhaustion: May 2011 Mean Standard Deviation: 1 Month, 5 days
This implies that with a 68% degree of certainty this model predicts IANA exhaustion in the period between the start of April to the end of June 2011, and with a 95% degree of certainty this event is predicted to occur in the period between the start of March 2011 to the end of July 2011.
This model is also able to predict the dates of IPv4 address exhaustion for each RIR. The model specifically excludes any allocations from the final /8s, and in effect predicts the month when each RIR will reach the point in time where all further allocations will be made from its final /8. It should be noted that this model does not take into account any recent returns of IPv4 addresses, nor does it include any future returns of IPv4 addresses to the RIRs. In particular, the recently announced return of address blocks from 45/8 are not included in this model. Also, importantly, this model does not factor in any displacement of demand. This is a critical weakness in this model, in that it is considered highly likely that as each RIR exhausts its pool of available IPv4 addresses some proportion of that region's residual unmet demand for IPv4 addresses will emerge in the remaining regions, further accelerating the other regions' demand for addresses. But, with these caveats, the predicted dates, and the mean standard deviation of these dates based on the repeated execution of this model are as follows:
| RIR | Exhaustion Date | Mean Standard Deviation |
| APNIC | November 2011 | 1 month, 7 days |
| RIPE NCC | September 2012 | 3 months, 17 days |
| ARIN | December 2012 | 2 months, 24 days |
| LACNIC | July 2013 | 2 months, 5 days |
| AFRINIC | July 2014 | 4 months, 11 days |
The distribution of exhaustion dates for IANA and the RIRs from the repeated iterations of this model is shown in Figure 10. The model was executed 1 million times, using a random selection of variation of address consumption for each RIR, as determined by the measured variation from the O(2) polynomial curve of best fit over the period 2007 – 2010.
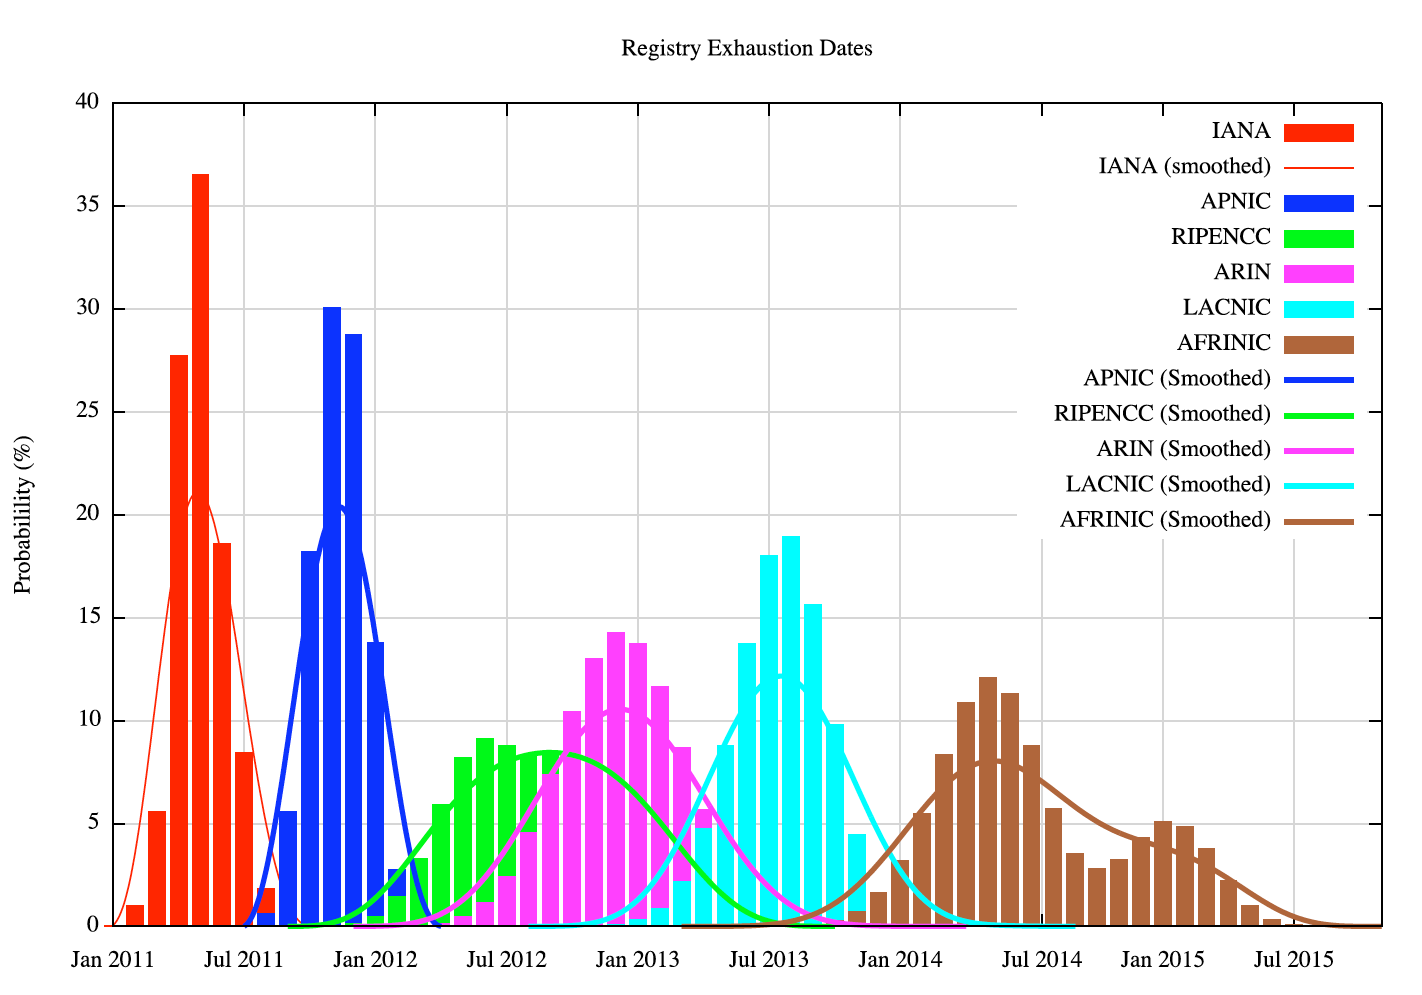
Figure 10 - Distribution of IANA and APNIC exhaustion dates
Of the remaining 7 /8s in the IANA pool available for general allocation, the probability of their distribution to each of the RIRs is as follows:
| RIR | IANA /8s 0 | 1 |
2 | 3 | 4 | 5 | APNIC | 0.00% | 0.00% | 11.43% | 35.05% | 44.37% | 9.14% | RIPE NCC | 35.59% | 20.04% | 44.73% | 0.00% | 0.00% | 0.00% | ARIN | 0.00% | 0.00% | 91.84% | 6.46% | 1.71% | 0.00% | LACNIC | 98.85% | 0.75% | 0.41% | 0.00% | 0.00% | 0.00% | AFRINIC | 71.44% | 28.56% | 0.00% | 0.00% | 0.00% | 0.00% |
It is certainly feasible that IANA will had out its last /8 in February of 2011, but this model assigns a higher degree of probability to this event occurring in the period April to June 2011. And as for the first RIR to exhaust its local pool of addresses, it is feasible that this will occur by mid 2011 with APNIC, but it is more likely that this will occur in November to December 2011, according to this model.
![]()
Disclaimer
The above views do not necessarily represent the views of the Asia Pacific Network Information Centre.
![]()
About the Author
Geoff Huston B.Sc., M.Sc., is the Chief Scientist at APNIC, the Regional Internet Registry serving the Asia Pacific region. He has been closely involved with the development of the Internet for many years, particularly within Australia, where he was responsible for the initial build of the Internet within the Australian academic and research sector. He is author of a number of Internet-related books, and was a member of the Internet Architecture Board from 1999 until 2005, and served on the Board of Trustees of the Internet Society from 1992 until 2001.